


Introduction
One of the big questions in psychiatry broadly is why conditions often overlap and whether this overlap reflects shared underlying mechanisms (Gandal et al., Reference Gandal, Haney, Parikshak, Leppa, Ramaswami, Hartl and Geschwind2018; Thapar, Cooper, & Rutter, Reference Thapar, Cooper and Rutter2016; The Brainstorm Consortium, 2018). It could be that there are common environmental or genetic factors that trigger comparable compensatory or adaptive brain processes subsequently emerging as psychiatric conditions at a phenotypic level (with specificity depending on interactions with other factors, Bishop, Reference Bishop2010; Frankenhuis et al., Reference Frankenhuis, Panchanathan and Nettle2016; Johnson, Reference Johnson2017; Johnson et al., Reference Johnson, Jones and Gliga2015; Karmiloff-Smith et al., Reference Karmiloff-Smith, Casey, Massand, Tomalski and Thomas2014; Thomas et al., Reference Thomas, Davis, Karmiloff-Smith, Knowland and Charman2016). Alternatively, it could be that symptoms of one condition lead to a behavioral profile characteristic of another (Bishop, Reference Bishop2017; Neale & Kendler, Reference Neale and Kendler1995; Sokolova et al., Reference Sokolova, Oerlemans, Rommelse, Groot, Hartman, Glennon and Buitelaar2017). Addressing such questions requires a developmental approach, since genetic and environmental risk factors act prenatally and disorders are commonly only diagnosed in childhood or later (Johnson, Jones, & Gliga, Reference Johnson, Jones and Gliga2015). The field of developmental psychopathology has long focused on uncovering the origins and course of “individual patterns of behavioral maladaptation” (Sroufe & Rutter, Reference Sroufe and Rutter1984) through a multidisciplinary integration of research approaches across the lifespan. Within this framework, mapping the “similarities and differences underlying diverse groups of risks and pathology” (Cicchetti, Reference Cicchetti1993, p. 474) is critical both scientifically and clinically.
From a clinical perspective, common vulnerability, protective or resilience factors could be an efficient target for prodromal screening procedures and non-specific interventions (Cicchetti, Reference Cicchetti1993). A focus on shared vulnerability is central to the Early Symptomatic Syndromes Eliciting Neurodevelopmental Clinical Examinations (ESSENCE) framework, which advocates for clinical examination and intervention targeting a range of behavioral problems emerging before age 3–5 years without the need to dissect conditions at early stages (Gillberg, Reference Gillberg2010). Similarly, the Research Domain Criteria (RDoC) framework encourages researchers to focus their efforts on investigating transdiagnostic phenotypes, as a classification system of mental conditions based on biobehavioral dimensions cutting across current diagnostic categories might better reflect our understanding of mechanisms underlying psychopathology (Cuthbert & Insel, Reference Cuthbert and Insel2013). Conversely, identifying condition-specific etiological causes of neurobehavioral manifestations in some cases is essential to implement successful interventions, for example when medications targeting defined biological systems are available (Thapar et al., Reference Thapar, Cooper and Rutter2016). With regards to protective factors, the developmental psychopathology framework stresses the importance of identifying resilience factors that may contribute to positive adaption in the face of developmental risk and could be targets for preventative intervention programs (Cicchetti, Reference Cicchetti2013). However, it is important to note that adaptation may in some cases result in the amplification of behavioral differences and so interventions must be carefully designed (Johnson et al., Reference Johnson, Jones and Gliga2015).
Scientifically, studying whether early signs of behavioral variation lie on condition-specific or general pathways is crucial to understand developmental processes leading to the manifestation of clinical symptoms (Cicchetti, Reference Cicchetti1993; Dick, Reference Dick2018). This allows us to start to distinguish brain systems that might act as protective or resilience factors against a range of developmental risk from systems that act more specifically to produce a specific behavioral outcome (Johnson, Reference Johnson2012; Johnson, Gliga, Jones, & Charman, Reference Johnson, Gliga, Jones and Charman2014). Observing pathways prior to symptoms is a powerful approach to disentangle whether different conditions are associated in terms of early signs and vulnerability factors (Elsabbagh & Johnson, Reference Elsabbagh and Johnson2010; Jeste & Geschwind, Reference Jeste and Geschwind2014; Wade, Prime, & Madigan, Reference Wade, Prime and Madigan2015). Conversely, if we could separate out patterns of cognitive, biological, or behavioral features of different conditions even in infancy, then this would suggest that they may be etiologically dissociable (Johnson et al., Reference Johnson, Gliga, Jones and Charman2014). In this proof-of-principle study we combined longitudinal behavioral and genotype data (a multimodal approach considered essential to making progress in developmental psychopathology; Cicchetti, Reference Cicchetti2013) to make a step forward in understanding developmental processes underlying the emergence of neurodevelopmental conditions.
Autism spectrum disorder (ASD) and attention-deficit/hyperactivity disorder (ADHD) are two of the most common neurodevelopmental conditions. ASD diagnosis is assigned typically between 3 and 5 years of age (Baio et al., Reference Baio, Wiggins, Christensen, Maenner, Daniels, Warren and Dowling2018; Brett, Warnell, McConachie, & Parr, Reference Brett, Warnell, McConachie and Parr2016) based on the presence of impairments in social interaction and communication, and restricted interests and repetitive behaviors as well as signs of sensory hyper- or hyposensitivity (American Psychiatric Association, 2013). ADHD is defined through clinical observation of the emergence, typically after 6 years of age (Halperin & Marks, Reference Halperin and Marks2019), of two types of behavioral manifestations: inattentiveness and/or hyperactivity and impulsiveness (American Psychiatric Association, 2013). Twin, family, and DNA-based studies showed that both ASD and ADHD are highly heritable, indicating that genetic factors explain most of the liability of these conditions (Hidalgo-Lopez, Gomez-Alzate, Garcia-Valencia, & Palacio-Ortiz, Reference Hidalgo-Lopez, Gomez-Alzate, Garcia-Valencia and Palacio-Ortiz2019; Larsson, Chang, D-Onofrio, & Lichtenstein, Reference Larsson, Chang, D-Onofrio and Lichtenstein2014; Miller et al., Reference Miller, Musser, Young, Olson, Steiner and Nigg2019; Tick, Bolton, Happé, Rutter, & Rijsdijk, Reference Tick, Bolton, Happé, Rutter and Rijsdijk2016). Substantial clinical overlap has been found between ADHD and other neurodevelopmental conditions, in particular ASD (Hollingdale, Woodhouse, Young, Fridman, & Mandy, Reference Hollingdale, Woodhouse, Young, Fridman and Mandy2019; Lai et al., Reference Lai, Kassee, Besney, Bonato, Hull, Mandy and Ameis2019). Importantly, between 20 and 50% of children who have received a diagnosis of ADHD also meet criteria for ASD and between 30 and 80% of children who have been diagnosed with ASD also meet criteria for ADHD, raising the question whether common causal mechanisms might underlie behavioral manifestations of the two neurodevelopmental conditions (Rommelse, Franke, Geurts, Hartman, & Buitelaar, Reference Rommelse, Franke, Geurts, Hartman and Buitelaar2010).
Symptoms of both ADHD and ASD likely result from a complex interaction between emerging neurodevelopmental vulnerabilities and aspects of the child's prenatal and postnatal environment (Geschwind, Reference Geschwind2011; Thapar, Cooper, Eyre, & Langley, Reference Thapar, Cooper, Eyre and Langley2013). However, research so far has produced mixed evidence on whether common or distinct developmental pathways underlie these conditions (Johnson et al., Reference Johnson, Gliga, Jones and Charman2014; Visser, Rommelse, Greven, & Buitelaar, Reference Visser, Rommelse, Greven and Buitelaar2016). On the one hand, twin and molecular research studies indicate that phenotypic overlap between the two conditions is partly explained by shared genetic factors (Rommelse et al., Reference Rommelse, Franke, Geurts, Hartman and Buitelaar2010; Stergiakouli et al., Reference Stergiakouli, Davey Smith, Martin, Skuse, Viechtbauer, Ring and St Pourcain2017). Similarly, familial studies indicate that family members of people with ASD show increased levels of ADHD symptoms, compared to relatives of individuals with no neurodevelopmental condition (Chien et al., Reference Chien, Chou, Chiu, Chou, Wu, Tsai and Gau2017). This suggests that familial factors are likely to have a general effect on ASD and ADHD symptomatology, possibly due to shared attention-related problems linked to pleiotropic risk factors underlying attention and social difficulties (Sokolova et al., Reference Sokolova, Oerlemans, Rommelse, Groot, Hartman, Glennon and Buitelaar2017). On the other hand, specific genetic and environmental influences have been found for the two conditions, suggesting that they are partly etiologically distinct and that co-occurrence of features, rather than complete comorbidity, is often observed in individuals who show both symptoms of ASD and ADHD (Ronald, Larsson, Anckarsater, & Lichtenstein, Reference Ronald, Larsson, Anckarsater and Lichtenstein2014; The Brainstorm Consortium, 2018). Evaluating whether early phenotypes reflecting genetic effects are specifically associated with ASD versus ADHD could shed light on the mechanisms underlying clinical manifestations of these two conditions and the role of early factors contributing to increased susceptibility.
The concept of “developmental endophenotype”
In seeking to identify the factors that mediate between genetic variation and later symptomatology, the developmental psychopathology framework has several natural points of intersection with the effort to identify endophenotypes in psychiatry. Endophenotypes are conceptualized as quantitative measures that are closer to the biological bases of the disorder or condition than clinical phenotypes; these measures must be reliably quantifiable, state-independent, that is they can be observed when clinical symptoms are not, and they are found to a higher extent in unaffected relatives of affected individuals than in the typical population (Gottesman & Gould, Reference Gottesman and Gould2003). The concept of endophenotype in psychiatry has been introduced as a potential tool to help resolve questions about etiological models, because it provides a genetically tractable target lying in the gap between genetic liability and neurodevelopmental process (Flint & Munafò, Reference Flint and Munafò2007). Thus, both the concept of endophenotypes and the field of developmental psychopathology originated from the recognition that linking the distal etiology of neurodevelopmental disorders to their proximal symptoms required an intermediate level of analysis.
Since the original framework was proposed by Gottesman and Gould (Reference Gottesman and Gould2003), the endophenotype construct has been revised to improve its utility in clinical practice and scientific discovery (Iacono, Malone, & Vrieze, Reference Iacono, Malone and Vrieze2017). One approach is to test whether endophenotypes share genetic bases with the psychiatric phenotype through using molecular genetic data, such as polygenic risk scores (Dick, Reference Dick2018; Iacono et al., Reference Iacono, Malone and Vrieze2017). In line with the RDoC approach (Insel, Reference Insel2014), it has been proposed that endophenotypes should be tested for association with dimensional traits and clinical characteristics, rather than limiting the analysis to categorical Diagnostic and Statistical Manual of Mental Disorders (DSM) diagnosis (Beauchaine & Constantino, Reference Beauchaine and Constantino2017; Iacono et al., Reference Iacono, Malone and Vrieze2017). Further, the criterion of state-independence has been elaborated as the possibility that an endophenotype is observed earlier in development than the behavioral manifestation of a clinical condition (Flint & Munafò, Reference Flint and Munafò2007; Skuse, Reference Skuse2001). This latter point resonates with the developmental psychopathology approach, where there is explicit recognition of the need to study age-dependent manifestations of particular characteristics and how they may combine to produce cascading outcomes (Cicchetti, Reference Cicchetti1993). Measures obtained at critical developmental time-points that reflect emerging components of cognition or affect and are linked to genetic effects have been defined as “developmental endophenotypes” (Johnson & Fearon, Reference Johnson and Fearon2011). Studying developmental endophenotypes in populations with a higher likelihood of developing a neurodevelopmental condition can help understand risk and protective mechanisms underlying individual variability in cognitive and affective functions and identify target functions for early interventions (Green et al., Reference Green, Pickles, Pasco, Bedford, Wan, Elsabbagh and McNally2017; Skuse, Reference Skuse2001).
Identifying developmental endophenotypes of ASD and ADHD
Prospective studies of infants with an older sibling with ASD have uncovered a range of potential developmental endophenotypes (Jones, Gliga, Bedford, Charman, & Johnson, Reference Jones, Gliga, Bedford, Charman and Johnson2014; Szatmari et al., Reference Szatmari, Chawarska, Dawson, Georgiades, Landa, Lord and Halladay2016). Infants with an older sibling with ASD are considered at elevated likelihood of neurodevelopmental conditions, having a 20% chance of developing ASD themselves (Messinger et al., Reference Messinger, Young, Ozonoff, Dobkins, Carter, Zwaigenbaum and Sigman2013; Ozonoff et al., Reference Ozonoff, Young, Carter, Messinger, Yirmiya, Zwaigenbaum and Stone2011), and up to a 30% chance of developing related conditions (Charman et al., Reference Charman, Young, Brian, Carter, Carver, Chawarska and Zwaigenbaum2017; Ozonoff et al., Reference Ozonoff, Young, Belding, Hill, Hutman, Johnson and Iosif2014). Such work has shown a range of early alterations that could represent developmental endophenotypes, including delayed attainment of motor milestones, faster head circumference growth, different temperamental characteristics, and difficulties in disengaging and maintaining attention (Johnson et al., Reference Johnson, Gliga, Jones and Charman2014). Infant sibling studies offer unique opportunities to investigate the dynamic interaction between susceptibility and resilience factors underlying developmental trajectories (Szatmari, Reference Szatmari2018). However, such studies thus far have typically focused on infants with a familial history of ASD without specifically accounting for the presence of related conditions like ADHD in the family. Thus, the current literature does not allow us to evaluate whether these measures reflect atypicalities that are involved in the pathway to neurodevelopmental conditions in general, or whether they indicate condition-specific signs of a diverse developmental trajectory.
Measures of attention as potential developmental endophenotypes
The present paper is a proof-of-principle study to explore how we can study the specificity or universality of developmental endophenotypes in the early emergence of ASD and ADHD. To do this, we chose to focus on a domain that is closely linked to both ASD and ADHD: attention. Visual attention is a domain-general cognitive function which serves to prioritize processing of certain stimuli over others in order to select environmental information for learning and memory (Amso & Scerif, Reference Amso and Scerif2015; Scerif, Reference Scerif2010). Importantly, attention is listed in the RDoC framework as a construct of transdiagnostic relevance (Cuthbert & Insel, Reference Cuthbert and Insel2013). In early development, changes in attention reflect the gradual development of the interaction between neurocognitive control mechanisms and salient perceptual characteristics of the sensory world (Scerif, Reference Scerif2010). The development of attention is influenced by the organization of the maturing brain so that during the first year of life infants start to build the ability to direct or inhibit attention on a volitional basis (endogenous attention). The study of individuals with rare monogenic disorders such as Fragile X and Williams syndromes, which often present with elevated ASD and/or ADHD traits, suggests that molecular pathways involved in ASD and ADHD might disturb this process. In fact, these syndromes are characterized by early disruptions of the hierarchical organization of the neural networks underlying the development of attention (Amso & Scerif, Reference Amso and Scerif2015; Atkinson & Braddick, Reference Atkinson, Braddick, Braddick, Atkinson and Innocenti2011). In line with this idea, shared genetic factors have been found to underlie inattention and attentional switching capacity in adults and children with co-occurring symptoms of ASD and ADHD (Polderman et al., Reference Polderman, Hoekstra, Vinkhuyzen, Sullivan, Van Der Sluis and Posthuma2013; Sinzig, Morsch, Bruning, Schmidt, & Lehmkuhl, Reference Sinzig, Morsch, Bruning, Schmidt and Lehmkuhl2008). Thus, correlates of attention could represent candidate developmental endophenotypes for both ASD and ADHD, and early disruptions to attention could theoretically contribute to the overlap between the two conditions. However, to date there is very little direct empirical evidence concerning the development of early attention skills in relation to both genetic risk and later symptom profiles for ASD and ADHD.
Aims of the study and analytical approach
In the present study we aimed to explore analytical approaches for using developmental endophenotypes to understand pathways to neurodevelopmental conditions. We operationalized this by examining if and at what level (liability or later traits) differences in attention are specifically involved in the developmental path to ASD and ADHD. To quantify attention, we used eye-tracking to measure look duration to a selected object or stimulus despite the presence of distractors. This measure is thought to reflect endogenous attention (Conejero & Rueda, Reference Conejero and Rueda2017; Gliga, Elsabbagh, Andravizou, & Johnson, Reference Gliga, Elsabbagh, Andravizou and Johnson2009) involving processes that require selective attention and maintenance of engagement to a particular stimulus as well as inhibition of exogenous effects of the competing stimuli (Colombo & Cheatham, Reference Colombo and Cheatham2006). Look durations to a selected object or item in infancy correspond to brain (event-related potentials of the scalp field) and physiological (heart rate) measures associated with states of attention (Richards, Reference Richards2008). This suggests that this behavioral measure can be used as an endophenotype because it is closely related to brain and physiological states in the organism. Moreover, a recent twin study showed that a large proportion of the variance in how long toddlers look at areas of a visual scene is genetically related (Constantino et al., Reference Constantino, Kennon-McGill, Weichselbaum, Marrus, Haider, Glowinski and Jones2017).
Our candidate developmental endophenotype was peak look duration at faces in an eye-tracking face pop-out task at 14 months of age. We selected this measure because it has already been well studied in infants with familial liability for ASD (de Klerk, Gliga, Charman, & Johnson, Reference de Klerk, Gliga, Charman and Johnson2014; Elsabbagh et al., Reference Elsabbagh, Gliga, Pickles, Hudry, Charman and Johnson2013; Hendry et al., Reference Hendry, Jones, Bedford, Gliga, Charman, Johnson and Wass2018; Wass et al., Reference Wass, Jones, Gliga, Smith, Charman and Johnson2015). Earlier work had suggested (counter to expectations) that longer unbroken episodes of looking to faces were present in 18- to 30-month-old children with ASD relative to neurotypical controls, and that this was dimensionally related to poorer language skills and higher symptom levels within the ASD group (Webb et al., Reference Webb, Jones, Merkle, Namkung, Greenson, Murias and Dawson2010). Interestingly, this was consistent with the observation that in typical development, peak unbroken look duration to faces typically decreases in the infant population across the first year of life and that infants who do not show this decline also have worse outcomes at 18, 24, and 36 months (Colombo, Shaddy, Richman, Maikranz, & Blaga, Reference Colombo, Shaddy, Richman, Maikranz and Blaga2004). This early work also showed that typically developing toddlers with a sibling with an ASD diagnosis also showed a longer duration of looking to faces than do typically developing toddlers without an older sibling with ASD, albeit with a smaller effect size (Webb et al., Reference Webb, Jones, Merkle, Namkung, Greenson, Murias and Dawson2010; see also Jones, Dawson, Kelly, Estes, & Webb, Reference Jones, Dawson, Kelly, Estes and Webb2017). This raises the possibility that peak look duration is an endophenotype that fulfils the criteria for being present in nonaffected family members at a higher rate than in the typical population.
We selected the 14-month time-point because prospective studies have subsequently shown that peak looks to faces within an array are longer at 14–15 months for infants with older siblings with ASD than those without. This effect was less pronounced in the same infants tested at 8 months (Elsabbagh et al., Reference Elsabbagh, Gliga, Pickles, Hudry, Charman and Johnson2013). A subsequent study with a larger but overlapping cohort indicated that the effect was only significant at 14 but not 8 months; further, the change between 8 and 14 months predicted later parent report of effortful control (Hendry et al., Reference Hendry, Jones, Bedford, Gliga, Charman, Johnson and Wass2018). Indeed, at 6- to 8-months shorter fixation durations in the same task were linked to later ASD (Wass, Scerif, & Johnson, Reference Wass, Scerif and Johnson2012), suggesting that the nature of this putative endophenotype may change over the developmental period in which endogenous influences on visual attention strengthen (Colombo, Reference Colombo2001). Further, within the group of infants with older siblings with ASD there were no significant differences in peak look to faces at 14 months between children with and without a later diagnosis of ASD (Elsabbagh et al., Reference Elsabbagh, Gliga, Pickles, Hudry, Charman and Johnson2013 section 4.3.2; replicated in an expanded cohort in Hendry et al., Reference Hendry, Jones, Bedford, Gliga, Charman, Johnson and Wass2018, p. 8). This further supports the evidence from Webb et al. (Reference Webb, Jones, Merkle, Namkung, Greenson, Murias and Dawson2010) that longer peak looks are not driven solely by children with a diagnostic outcome of ASD, but are rather shared across siblings as a group. Building on this work, Hendry and colleagues showed in a partially overlapping cohort that longer looks to faces in infancy were associated with reduced effortful control in toddlerhood, suggesting that differences between infants with and without siblings with ASD may be related to their risk for later effortful control difficulties, rather than categorical ASD (Hendry et al., Reference Hendry, Jones, Bedford, Gliga, Charman, Johnson and Wass2018). Interestingly, these effects were not observed in relation to other competing non-social stimuli, possibly indicating that these effects only emerge in response to the stimuli that primarily capture the attention of infants with and without later ASD within a particular task (Elsabbagh et al., Reference Elsabbagh, Gliga, Pickles, Hudry, Charman and Johnson2013).
Previous work thus indicates that a longer peak look to faces is present in typically developing toddlers with a sibling with ASD (Webb et al., Reference Webb, Jones, Merkle, Namkung, Greenson, Murias and Dawson2010); is present in 14-month-old infants with an older sibling with ASD and is not specific to later ASD diagnosis (Elsabbagh et al., Reference Elsabbagh, Gliga, Pickles, Hudry, Charman and Johnson2013; Hendry et al., Reference Hendry, Jones, Bedford, Gliga, Charman, Johnson and Wass2018); emerges between 8 and 14 months (Hendry et al., Reference Hendry, Jones, Bedford, Gliga, Charman, Johnson and Wass2018); and may be dimensionally related to later effortful control (Hendry et al., Reference Hendry, Jones, Bedford, Gliga, Charman, Johnson and Wass2018). However, this work thus raises the question: what then is this measure of visual attention an endophenotype for? Possibly, this disruption in visual attention does relate to ASD outcome, but sufficient power is required to demonstrate this. Alternatively, longer peak looks to faces may relate to conditions that highly co-occur with ASD but have partially distinct aetiologies, such as ADHD. This may explain why the association with diagnostic status is much clearer in clinically referred samples, where co-occurrence is likely greater (Webb et al., Reference Webb, Jones, Merkle, Namkung, Greenson, Murias and Dawson2010). Alternatively, longer peak looks may reflect a domain-general protective factor like executive attention (or effortful control, Hendry et al., Reference Hendry, Jones, Bedford, Gliga, Charman, Johnson and Wass2018) that would be expected to be impaired in children with both later ASD and ADHD symptoms.
In the present study, we introduce one operationalization of a developmental psychopathology framework for beginning to examine whether longer peak looks to faces are a putative endophenotype for ASD, ADHD, or both. Specifically, in a large sample we ask whether longer peak looks to faces are related to specific risk factors or outcome measures of ASD once sample sizes are large enough; or whether peak looks to faces are related to specific risk factors or outcome measures of the strongly co-occurring and aetiologically overlapping condition ADHD; or whether data are more consistent with peak looks to faces representing a general protective factor that acts in the pathway to both conditions (Johnson et al., Reference Johnson, Gliga, Jones and Charman2014). To do this, we use four different approaches: (a) familial liability based on family history and symptoms in first-degree family members; (b) genetic liability measured with polygenic scores; (c) temperament traits in toddlerhood which are found in individuals with later symptoms of the two clinical conditions; (d) elevated ASD and ADHD traits at 6 years of age.
For familial liability (a), we considered the presence of ASD and/or ADHD symptomatology in first-degree family members. This allowed us to identify groups of infants with a familial history of ASD, ADHD, both conditions and neither. Additionally, we were interested in complementing the familial liability analysis by making use of genetic information (b). Genome-wide association studies (GWASes)—that test the association between known variations of the DNA sequence that are common in the population and the trait of interest in very large samples—have demonstrated that many psychiatric conditions, including ASD and ADHD, are polygenic, meaning that they are influenced by many common genetic variants each of which has an individually small effect (Hong et al., Reference Hong, Ripke, Neale, Faraone, Purcell and Perlis2013; Visscher et al., Reference Visscher, Wray, Zhang, Sklar, McCarthy, Brown and Yang2017). However, even though DNA sequence variants identified in GWASes individually have very little effect on outcome, they act independently and additively and can be aggregated into a single genetic “score,” termed polygenic score (Dudbridge, Reference Dudbridge2013). Polygenic scores provide an individual-specific estimate for genetic propensity for a phenotypic trait or condition (such as ASD or ADHD), and correspond to the sum of trait-related effects sizes of genetic variants across the genome identified in the original GWAS (Wray et al., Reference Wray, Lee, Mehta, Vinkhuyzen, Dudbridge and Middeldorp2014). The application of polygenic scores has become widespread in genetic research because they can be utilized to empirically assess genetic liability for psychiatric conditions, as genetic predictor variables. We evaluated the association between peak look duration at the face and polygenic score for ASD and ADHD. For comparability to the familial liability analysis, we also took a categorical approach where we identified individuals who were in the extreme tail of the distribution for ASD/ADHD polygenic score, considering them at elevated genetic liability for ASD or ADHD, respectively.
Although endophenotypes can be present when the clinical symptoms are not, one requirement is that they are linked to a clinical condition. However, a critical point emerging from studies of infants with elevated likelihood of ASD is that developmental trajectories are dynamic and children show different profiles of the nature and timing of symptom development (Ozonoff et al., Reference Ozonoff, Young, Brian, Charman, Shephard, Solish and Zwaigenbaum2018). Thus, it may be that an endophenotype is stable/state independent, but the symptom profile that it is related to changes over developmental time. At the group level, early signs of emerging symptomatology can be robustly identified by two years of age (Ozonoff et al., Reference Ozonoff, Young, Landa, Brian, Bryson, Charman and Iosif2015). However, in some cases clinical manifestations might not emerge until age five years (Ozonoff et al., Reference Ozonoff, Young, Brian, Charman, Shephard, Solish and Zwaigenbaum2018). Moreover, the effect of genetic factors on ASD and ADHD traits, though present across childhood, becomes stronger with age (Stergiakouli et al., Reference Stergiakouli, Davey Smith, Martin, Skuse, Viechtbauer, Ring and St Pourcain2017). One way to capture the link between genetic factors, developmental endophenotypes and clinical condition even if timing of emergence of the latter is variable is to test the association between endophenotype and symptom emergence at different time-points in development (Iacono et al., Reference Iacono, Malone and Vrieze2017). In order to evaluate whether our developmental endophenotype was informative of the earliest behavioral signs of a neurodevelopmental condition, we then tested whether peak look duration in infancy was associated with having ASD- and ADHD-related temperament traits in toddlerhood (c). Previous research on children with a first-degree relative with ASD and ADHD has shown that temperament characteristics at 2 years of age were predictive of later ASD and ADHD symptomatology (Auerbach et al., Reference Auerbach, Berger, Atzaba-Poria, Arbelle, Cypin, Friedman and Landau2008; Shephard et al., Reference Shephard, Bedford, Milosavljevic, Gliga, Jones and Pickles2019). In a cohort that is partly overlapping with the present one, Shephard et al. (Reference Shephard, Bedford, Milosavljevic, Gliga, Jones and Pickles2019) found that high parent-report levels of shyness at 2 years of age were associated with ASD symptoms in mid-childhood, while low inhibitory control in toddlerhood was predictive of later ADHD symptoms (Shephard et al., Reference Shephard, Bedford, Milosavljevic, Gliga, Jones and Pickles2019), in line with other research (see Visser et al., Reference Visser, Rommelse, Greven and Buitelaar2016 for a review). Therefore, we used these temperament measures as early indicators of clinical characteristics. Implementing the same categorical approach that we used in the familial and genetic liability analysis, we dichotomized parent-report measures of temperament and tested the effect of elevated ASD and ADHD-related traits in toddlerhood. Additionally, we tested the linear association between our candidate developmental endophenotype and parent-report levels of shyness and inhibitory control at 2 years. Last, we examined our developmental endophenotype in relation to clinical traits in mid-childhood (d), when symptoms of neurodevelopmental conditions usually have clearly emerged (Ozonoff et al., Reference Ozonoff, Young, Brian, Charman, Shephard, Solish and Zwaigenbaum2018). We compared children with typical versus elevated ASD/ADHD, defined based on clinical thresholds for diagnosis for parent-report questionnaires commonly used in clinical and research practice: the Social Responsiveness Scale for ASD (Constantino & Gruber, Reference Constantino and Gruber2012) and the Conners for ADHD (Conners, Reference Conners2008). Additionally, in line with the views of Beauchaine and Constantino (Reference Beauchaine and Constantino2017) and Iacono et al. (Reference Iacono, Malone and Vrieze2017) on the importance of examining the association between endophenotypes and dimensional variation in psychiatric traits, we tested the relationship between peak look duration at the face and continuous ASD and ADHD traits. Finally, to verify the specificity of our results to the particular a priori measure we selected, we repeated all analyses for the mean peak look duration across all stimuli.
Materials and methods
Participants
The sample for the present study included 335 participants who took part in Phase 1, 2, and 3 of the British Autism Study of Infant Siblings (BASIS, http://www.basisnetwork.org) and provided eye-tracking data for the face pop-out task at around 14 months of age (M = 14.37, SD = 1.17). The sample from Phases 1 and 2 included 155 infants with an elevated-likelihood of developing ASD (EL, 75 females) defined by having at least one older sibling with a community diagnosis of ASD, and 67 infants with a typical likelihood of developing ASD (TL, 38 females), defined by having at least one older sibling and no family history of ASD. Phase 3 participants were recruited for the Studying Autism and ADHD Risks (STAARS) project, that included infants with (n = 95, 44 females) and without (n = 18, 7 females) an older sibling or a parent with a community clinical diagnosis of ASD and/or ADHD or a research classification of probable ADHD (n = 2; as summarized in Supplementary Table SM.1 and Methods details section 4). For all Phases, infants with no family history of ASD or ADHD were recruited from a volunteer database at the Centre for Brain and Cognitive Development, Birkbeck University of London and had no known medical or developmental condition at the time of enrolment. Informed written consent was provided by the parent(s) prior to the commencement of the study.
Table 1 provides information relative to the number of male and female participants, peak look duration at the face, age (in months) and Early Learning Composite and Visual Reception scores of the Mullen Scales of Early Learning (MSEL) as measures of developmental level and visual skills, respectively, at the time of eye-tracking data collection by recruitment group (EL vs. TL). Supplementary Table SM.2 shows the total number of participants involved in the present study divided by Phase and recruitment group.
Table 1. Composition characteristics of the participants included in the present study by recruitment group (EL vs. TL) and mean scores of the behavioral measures collected at 14 months of age.

EL: elevated likelihood of autism spectrum disorder (ASD) and/or attention-deficit hyperactivity disorder (ADHD) based on familial history of first-degree family members, TL: typical likelihood of ASD and/or ADHD based on familial history of first-degree family members, N = number of participants or trials, SD = standard deviation, MSEL: Mullen Scales of Early Learning.
Measures
Peak look duration
The candidate developmental endophenotype used in the present study consisted of the average peak look duration at the face stimulus across all valid trials of a face pop-out task. The face pop-out task (described in Elsabbagh et al. (Reference Elsabbagh, Gliga, Pickles, Hudry, Charman and Johnson2013) and Gliga et al. (Reference Gliga, Elsabbagh, Andravizou and Johnson2009)) uses arrays of five pictures presented such that when placed at a distance of approximately 60 cm from the infant the five individual pictures on one slide had an eccentricity of 9.3° and covered an approximate area of 5.2° × 7.3°. The pictures included: a face with direct gaze, a mobile phone, a bird, a car and a control stimulus defined as “noise” or “scrambled-face,” obtained by randomizing the phase spectra of the face stimulus while keeping the amplitude and color spectra constant (Halit, Csibra, Volein, & Johnson, Reference Halit, Csibra, Volein and Johnson2004). An example of the array is presented in Figure 1.

Figure 1. Example of one slide containing an array of five stimuli presented during the face pop-out eye-tracking task.
During the task, infants were seated on their caregivers’ lap approximately 60 cm from the screen. For Phases 1 and 2, a 17-inch monitor with a 5:4 aspect ratio was used. For Phase 3 a 23″ 16:9 monitor was used and for comparability with previous phases stimuli were presented within a fixed 17-inches 5:4 virtual display surrounded by black borders (34.5 cm × 25.9 cm, 32.1° × 24.4° @ 60 cm viewing distance). All data were acquired on Tobii infra-red eye trackers (Phase 1, 1750 at 50Hz; Phase 2, T120 at 60Hz; Phase 3, TX-300 at 120 Hz). Online feedback as to the position of the child's eyes relative to the center of the eye tracker head box allowed experimenters to adjust the position of the arm-mounted eye trackers for optimal data quality. A five-point calibration sequence was run and recording only started when at least four points were successfully calibrated for each eye. Fourteen (Phase 1), seven (Phase 2) or six (Phase 3) different slides, containing arrays of five stimuli, were presented for 15 s each. To ensure that the infant's gaze was directed to the center, a small animation was presented in the center of the screen before each slide presentation. Visual presentation was accompanied by music to assist infants in maintaining attention throughout the task. Gaze data were processed using Tobii Studio in Phase 1 (T.G.) and using custom-written MATLAB scripts in Phases 2 and 3 (L.M.). Tobii eye trackers will acquire binocular gaze coordinates where possible, and monocular where only one eye is detected. The X and Y coordinates of binocular samples were averaged. Gaze to off-screen locations was marked as missing. Fixations <100 ms (Phase 1) or <50 ms (Phases 2 and 3) were removed. For Phases 2 and 3, raw data were first assigned to Area Of Interests (AOIs). Following this, missing data up to 200 ms were assigned to the AOI if gaps occurred within the same AOI. In both procedures, where gaps occurred between different AOIs, data were not interpolated.
Each trial was processed, then those with <25% valid samples or <5 s trial length (due to potential skipping) were marked as invalid. Only valid trials were included in subject averages. Subjects with <3 valid trials were excluded from analysis.
For each valid trial, peak look was calculated by taking the duration of the longest contiguous run of samples within an AOI (i.e., each look may be formed by multiple fixations, so long as they occur within an AOI). If no look was available for a particular stimulus, the trial was excluded from the mean peak calculations for that AOI. For each participant with at least three valid trials for the face stimulus (M = 8.38, SD = 3.29, range: 3–14), an average of peak look duration across trials was calculated and used as variable in subsequent analyses. The same procedure was applied to obtain peak look durations to each of the other four stimuli. Subsequently, peak look durations were averaged across trials and further averaged across stimuli in order to obtain a general measure of sustained attention which was not specific to the social stimulus (see Supplementary Figure SM.1B).
Peak look durations were averaged across the trials to provide a more stable characterization of individual differences (Colombo & Mitchell, Reference Colombo and Mitchell1990; Wass, Reference Wass2014), and following previous research (Hendry et al., Reference Hendry, Jones, Bedford, Gliga, Charman, Johnson and Wass2018; Jones et al., Reference Jones, Venema, Earl, Lowy, Barnes, Estes and Webb2016). In our sample, peak look duration was moderately correlated with mean look duration at the same stimulus (r(1667) = .466, p < .001, for the face stimulus only: r(335) = .460, p < .001). Supplementary Figure SM.1A shows that the distribution of peak look duration at the face varies across the three Phases of BASIS. Of note, a different ratio of children with and without familial liability for neurodevelopmental conditions were recruited across Phases. However, Phase had an effect on peak look duration at the face when restricting the analysis to TL children (Kruskal–Wallis test: χ 2(2) = 13.84, p = .001). While acknowledging that correcting for Phase could have biased the results given the different composition of likelihood-groups in the three cohorts, all subsequent analyses were repeated including Phase as a covariate to verify whether results were robust to this effect.
Familial liability
Familial liability was defined as having records of ASD or ADHD symptomatology among first-degree relatives. For ASD, liability was determined based on parent report of clinical diagnosis from a UK clinician in at least one of the older siblings (all Phases, n = 229, where six of the Phase 3 children had also a parent with a condition) or parents (Phase 3 only, n = 21, including 15 where the diagnosis was assigned to parent only and six where a condition was diagnosed in both parent and sibling, see Supplementary Table SM.1 for details), supported when possible with diagnostic letters and questionnaire data. Specifically, a diagnosis of ASD was confirmed if the older sibling met the ASD threshold on the Development and Well-Being Assessment (DAWBA, Goodman, Ford, Richards, Gatward, & Meltzer, Reference Goodman, Ford, Richards, Gatward and Meltzer2000) and/or had a score >15 on the Social Communication Questionnaire (SCQ, Rutter, Bailey, & Lord, Reference Rutter, Bailey and Lord1993). For ADHD, parent report of clinical diagnosis of ADHD was required in at least one of the first-degree family members, or a first-degree relative had to meet clinical cut-offs on the Conners 3-Parent questionnaires (Conners, Reference Conners2008) as outlined in SM 4. Participants were excluded from this analysis if there was no recent information on the presence of ADHD traits in the family and no questionnaire on ADHD available for the older siblings (n = 36 for Phase 1, n = 14 for Phase 2).
Overall, of the 285 participants who had both valid peak look at the face data and data on familial liability, 179 had at least one family member with a diagnosis of ASD (n = 94 EL-ASD + n = 85 EL-ASD/ADHD), 106 had at least one family member with ADHD (n = 21 EL-ADHD + n = 85 EL-ASD/ADHD) and 85 were TL infants with no familial history of ASD or ADHD in the first-degree relatives.
Genetic liability
Saliva and/or cheek-swab DNA samples were collected from the Phase 1, 2, and 3 participants as detailed in the Supplementary Materials (section 1). Following genotyping and quality control procedures (summarized in Supplementary Table SM.3), good quality genetic data were available for 243 BASIS infants of European ancestry. Polygenic scores for ASD and ADHD were constructed using LDpred (Vilhjálmsson et al., Reference Vilhjálmsson, Yang, Finucane, Gusev, Lindström, Ripke and Price2015) based on the most recent GWASes for ASD and ADHD, both meta-analyses of data collected by the Lundbeck Foundation Initiative for Integrative Psychiatric Research (iPSYCH) and Psychiatric Genomic consortia. Specifically, the ASD GWAS reports results from 18,382 ASD cases and 27,969 controls (Grove et al., Reference Grove, Ripke, Als, Mattheisen, Walters and Won2019) while the ADHD GWAS comprised 19,099 ADHD cases and 34,194 controls (Demontis et al., Reference Demontis, Walters, Martin, Mattheisen, Als and Agerbo2019). Details of polygenic score construction and validation are reported in the Supplementary Materials (section 2, Figures SM.2 and SM.3).
Polygenic scores data calculated with PT = 1 were standardized (ASD: M = 0, SD = 1, range: −2.73 to +3.52; ADHD: M = 0, SD = 1, range:−2.71 to +2.54) and tested for association with peak look data. Additionally, for the categorical approach illustrated above, we defined infants as having elevated genetic liability for ASD or ADHD if they were in the top quartile for ASD and/or ADHD polygenic score in our sample, respectively. ASD liability was assigned to individuals who were in the top quartile of the ASD polygenic score distribution (polygenic score above 0.554). Similarly, ADHD liability was assigned to individuals in the top quartile of the ADHD polygenic score (polygenic score above 0.604).
Of the 335 participants with valid peak look duration data, 185 also provided good-quality genotype data for polygenic score analysis. Of these, 44 were classified as having high ASD genetic liability (n = 27 ASD + n = 17 ASD/ADHD), 44 as having high ADHD genetic liability (n = 27 ADHD + n = 17 ASD/ADHD) and 114 for neither (see Table 3 for descriptives and mean scores). Supplementary Figure SM.4 illustrates the ASD and ADHD top-quartile polygenic scores’ thresholds for the individuals with good quality peak look duration data.
Toddler temperament traits
The Early Childhood Behavior Questionnaire (ECBQ) was collected for a total of 321 participants across Phases 1, 2, and 3 when they were around 2 years of age (M = 24.87 months, SD = 1.64). The ECBQ is a parent-report questionnaire designed to evaluate temperament traits in the first three years of life (Rothbart, Ahadi, Hershey, & Fisher, Reference Rothbart, Ahadi, Hershey and Fisher2012). It includes 18 subscales whose scores are constructed by clustering items assessing different dimensions of temperament (Putnam, Gartstein, & Rothbart, Reference Putnam, Gartstein and Rothbart2006). For the present research, the shyness subscale scores (M = 3.32, SD = 1.16, range: 1–7) and the inhibitory control subscale scores (M = 4.11, SD = 1.18, range: 1–6.6) were used as indices of temperament traits predictive of later ASD and ADHD symptomatology, respectively (Shephard et al., Reference Shephard, Bedford, Milosavljevic, Gliga, Jones and Pickles2019; Visser et al., Reference Visser, Rommelse, Greven and Buitelaar2016). Individuals in the top quartile of our sample distribution for shyness (score above 4.00) were classified as having ASD-related temperament traits; individuals in the bottom quartile for inhibitory control (score below 3.33) were classified as having ADHD-related temperament traits in toddlerhood. Of the 335 participants with valid peak look data, 272 provided ECBQ data. Of those, 65 had ASD-related temperament traits (n = 42 ASD + n = 23 ASD/ADHD), 59 had ADHD-related temperament traits (n = 36 ADHD + n = 23 ASD/ADHD) and 171 neither elevated ASD- or ADHD-related temperament traits (see Table 3 for descriptives and mean scores, Supplementary Figure SM.5 for sample characterization based on the quartile thresholds). Additionally, we tested the linear association between peak look and ECBQ shyness and inhibitory control scores.
Mid-childhood clinical traits
The second edition of the Social Responsiveness Scale (SRS, Constantino & Gruber, Reference Constantino and Gruber2012) School Age version was administered to the parents of Phase 1 and 2 infant siblings when they were 6-year-old (N = 105). This questionnaire provides a quantitative measure of autistic-like behavior that has been extensively used in both clinically ascertained and population-based samples of subjects (Constantino & Todd, Reference Constantino and Todd2005; Frazier et al., Reference Frazier, Ratliff, Gruber, Zhang, Law and Constantino2014). Raw scores are converted to t scores to reflect age and gender norms. The total t score was used as a measure of ASD traits.
The third edition of the Conners Parent form, created to evaluate ADHD traits in school-age children aged between 6 and 18 years (Kao & Thomas, Reference Kao and Thomas2010), was administered to parents of Phase 1 and 2 infant siblings when they reached mid-childhood (N = 103). Additionally, the Conners Early Childhood form was used for 12 Phase 2 participants who were younger than 6 at the time of recruitment for this part of the data collection. The Conners Global Index was computed for the two versions of the questionnaire. This score is recommended for detailed examination of ADHD and related features such as executive functioning, learning, aggression, hyperactivity/impulsivity, peer relations, and inattention. For this study, the Global Index total t scores were calculated and used as a measure of ADHD clinical traits.
The sample for this analysis included 102 participants for whom both SRS-2 and Conners measures were obtained (mean age = 6.77, SD = 0.78). Of the 335 participants with valid peak look duration data, 94 provided both SRS (M = 54.46, SD = 17.04, range: 38–104) and Conners (M = 57.32, SD = 15.76, range: 40–91) data for this study. Twenty-two participants with SRS total t score above the standard clinical thresholds for mild to moderate difficulties in the autism spectrum of 60 were classified as having elevated ASD traits (n = 6 ASD + n = 16 ASD/ADHD). Twenty-nine participants scoring above the conventional clinical threshold of 65 on the Conners Global Index t score were classified as having elevated levels of ADHD traits (n = 13 ADHD + n = 16 ASD/ADHD). Fifty-nine participants were considered typically developing (“neither” group, see Supplementary Figure SM.6).
Table 2 summarizes the variables used and sample sizes for all the analyses. Table 3 describes the sample and measures divided into ASD only, ADHD only, ASD/ADHD and neither ASD nor ADHD liability/traits for the four analyses. A correlation table between the continuous variables (polygenic scores, toddler temperament traits and mid-childhood clinical traits) can be found in the Supplementary Materials (Figure SM.7).
Table 2. Instruments and sample sizes for the analyses conducted in this study.

ADHD: attention deficit-hyperactivity disorder; ASD: autism spectrum disorder; N tot: number of participants with information on the measure of interest; N peak look: number of participants included in the study as providing both information on the measure of interest and valid peak look at the face data. N (%) ASD: number (percentage of the sample included in the study, i.e., N peak look) of participants with elevated ASD liability/traits (ASD + ASD/ADHD); N (%) ADHD: number (percentage of the sample included in the study) of participants with elevated ADHD liability/traits (ADHD + ASD/ADHD); GWAS: Genome-Wide Association Study; ECBQ: Early Childhood and Behavior Questionnaire; SRS: Social Responsiveness Scale.
Table 3. Descriptives and mean scores of the measures used in the four analyses by group: attention-deficit hyperactivity disorder (ADHD) liability/traits only, autism spectrum disorder (ASD) only, both ASD and ADHD (ASD/ADHD) and neither. Results of the analysis of variance (ANOVAs) comparing the four groups are reported for the continuous measures.
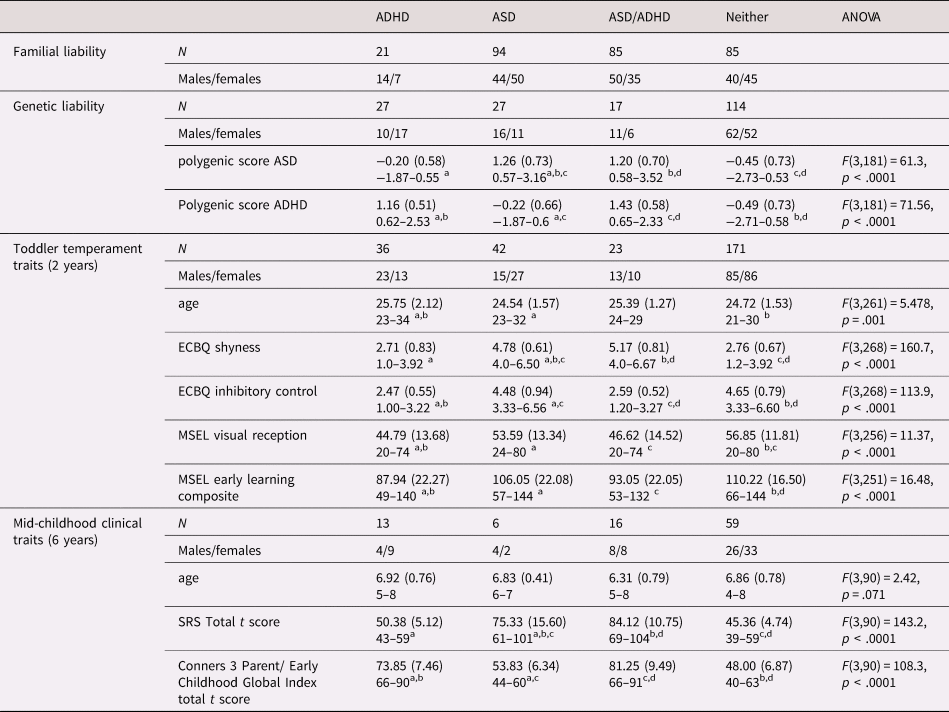
ECBQ: Early Childhood and Behavior Questionnaire; MSEL: Mullen Scales of Early Learning; SRS: Social Responsiveness Scale.
a,b,c,d Different superscript letters denote that groups are significantly different from each other based on Tukey's Honest Significant Difference post-hoc analyses with 95% family-wise confidence level.
Statistical analyses
All analyses were conducted using peak look duration at the face at 14 months as dependent variable. Peak look data were nonnormally distributed (Shapiro–Wilk normality test: W = 0.879, p < .001), with the presence of extreme, though plausible, values. Therefore, the log-transformed peak look data were used in subsequent analyses. In addition, to test the specificity of results for the face condition, analyses were repeated using the log-transformed average peak look duration at all five stimuli (face, noise, car, phone, and bird) as the dependent variable.
Similarly to other research studying comorbid neurodevelopmental disorders (Banaschewski, Neale, Rothenberger, & Roessner, Reference Banaschewski, Neale, Rothenberger and Roessner2007; Greimel et al., Reference Greimel, Wanderer, Rothenberger, Herpertz-Dahlmann, Konrad and Roessner2011; Tye et al., Reference Tye, Asherson, Ashwood, Azadi, Bolton and McLoughlin2014), we used a 2 × 2 factorial design to evaluate the contribution of the two conditions (additive effects) and of their interaction (multiplicative effect) to peak look duration. A nonsignificant interaction would provide evidence in favor of the additive model (Bedford et al., Reference Bedford, Pickles, Gliga, Elsabbagh, Charman, Johnson and Volein2014). Given that our groups were often unbalanced for size, we used Type II analysis of variance (ANOVAs) to test for the main effects and interaction effect of having elevated ASD (ASD/ADHD + ASD vs. ADHD + neither) or ADHD (ASD/ADHD + ADHD vs. ASD + neither) familial liability, genetic liability, temperament traits in toddlerhood, and clinical traits in mid-childhood, respectively.
Partial eta-squared ($\eta _p^2$ ) were used as measures of the effect sizes.
Three linear regressions were used to test for the relationship between log-transformed peak look data and the continuous variables for genetic liability (ASD and ADHD polygenic scores), temperament traits in toddlerhood (shyness and inhibitory control ECBQ scores) and clinical traits in mid-childhood (SRS and Conners total t scores).
Number of valid trials for the face pop-out task was significantly different between recruitment groups (t(132.1) = 5.800, p < .001, see Table 1) and was thus included as a covariate in all ANOVA and regression analyses. Age (in months) was also included as a covariate in all analyses. Additionally, all analyses were repeated including Phase as a covariate, given the slight differences in processing parameters.
Results
Familial liability
Familial liability analyses were conducted on the 285 participants for whom it was possible to define the presence of ASD and ADHD in first-degree relatives, as described in the methods section. For peak look duration at the face, log-transformed peak look durations met the assumptions of normality of the distribution (Shapiro–Wilk test: W = 0.997, p = .801) and homogeneity of variance (Levene's test: F(3,281) = 2.010, p = .113). There was a significant main effect of having a family history of ADHD (F(1,279) = 4.150, p = .043, $\eta _p^2$ = 0.015), but not of ASD (F(1,279) = 0.757, p = .385, $\eta _p^2$
 = 0.003). Similarly, the nonsignificant result of the interaction term did not support a multiplicative effect of having elevated familial liability for both conditions on peak look duration at the face (F(1,279) = 0.340, p = .528, $\eta _p^2$
 = 0.001). When removing Phase as a covariate, we found no significant main effect of having a family history of ASD (F(1,277) = 0.129, p = .719, $\eta _p^2$
 < 0.001) or ADHD (F(1,277) = 1.162, p = .282, $\eta _p^2$
 = 0.004) and no significant interaction between ASD and ADHD (F(1,277) = 0.578, p = .448, $\eta _p^2$
 = 0.002). To further explore whether our results were due to the fact that Phase 3 only included individuals with familial liability for ADHD and not ASD, we repeated the analyses in the Phase 3 cohort only. Results confirmed there was no main effect of either condition (ASD: F(1,107) = 1.136, p = .289, $\eta _p^2$
 = 0.010, ADHD: F(1,107) = 1.767, p = .187, $\eta _p^2$
 = 0.016), nor significant interaction between ASD and ADHD (F(1,107) = 1.536, p = .218, $\eta _p^2$
 = 0.218).
For mean peak look duration at all stimuli, analyses revealed that was no significant effect of ASD (F(1,279) = 0.730, p = .394, $\eta _p^2$ = 0.003; with Phase as covariate: F(1,277) = 1.105, p = .294, $\eta _p^2$
 = 0.004), ADHD (F(1,279) = 0.338, p = .562, $\eta _p^2$
 = 0.001; with Phase as covariate: F(1,277) = 0.425, p = .515, $\eta _p^2$
 = 0.002) and no significant interaction effect (F(1,279) = 0.649, p = .421, $\eta _p^2$
 = 0.002; with Phase as covariate: F(1,277) = 0.023, p = .880, $\eta _p^2$
 < 0.001).
Genetic liability
Genetic liability analyses were conducted on the subset of 185 participants who provided good-quality genotype data for polygenic score analysis. Log-transformed peak look duration at the face data had a normal distribution (W = 0.994, p = .619) and homogeneous variance between groups (F(3,181) = 1.328, p = .267). Our categorical analysis revealed that there was a significant main effect of increased genetic liability for ADHD (F(1,179) = 4.05, p = .045, $\eta _p^2$ = 0.021), but not for ASD (F(1,179) = 0.017, p = .898, $\eta _p^2$
 < 0.001, Figure 2). The interaction effect was also non-significant (F(1,179) = 0.809, p = .370, $\eta _p^2$
 = 0.005), indicating that having increased polygenic factors for both conditions did not influence peak-look durations at the face. When including Phase as a covariate, peak look duration at the face was not significantly different between infants with and without elevated polygenic score for ASD (F(1,177) = 0.017, p = .895, $\eta _p^2$
 < 0.001) or ADHD (F(1,177) = 1.623, p = .204, $\eta _p^2$
 = 0.009). The interaction term was also nonsignificant (F(1,177) = 1.274, p = .260, $\eta _p^2$
 = 0.007). When examining the linear relationship with the two polygenic scores, we found that peak look duration at the face was significantly associated with polygenic score for ADHD (β = 0.078, standard error = 0.034, p = .023, Figure 3; with Phase as covariate: β = 0.068, SE = 0.032, p = .035) but not for ASD (β = 0.002, SE = 0.034, p = .944; with Phase as covariate: β = 0.006, SE = 0.033, p = .864).
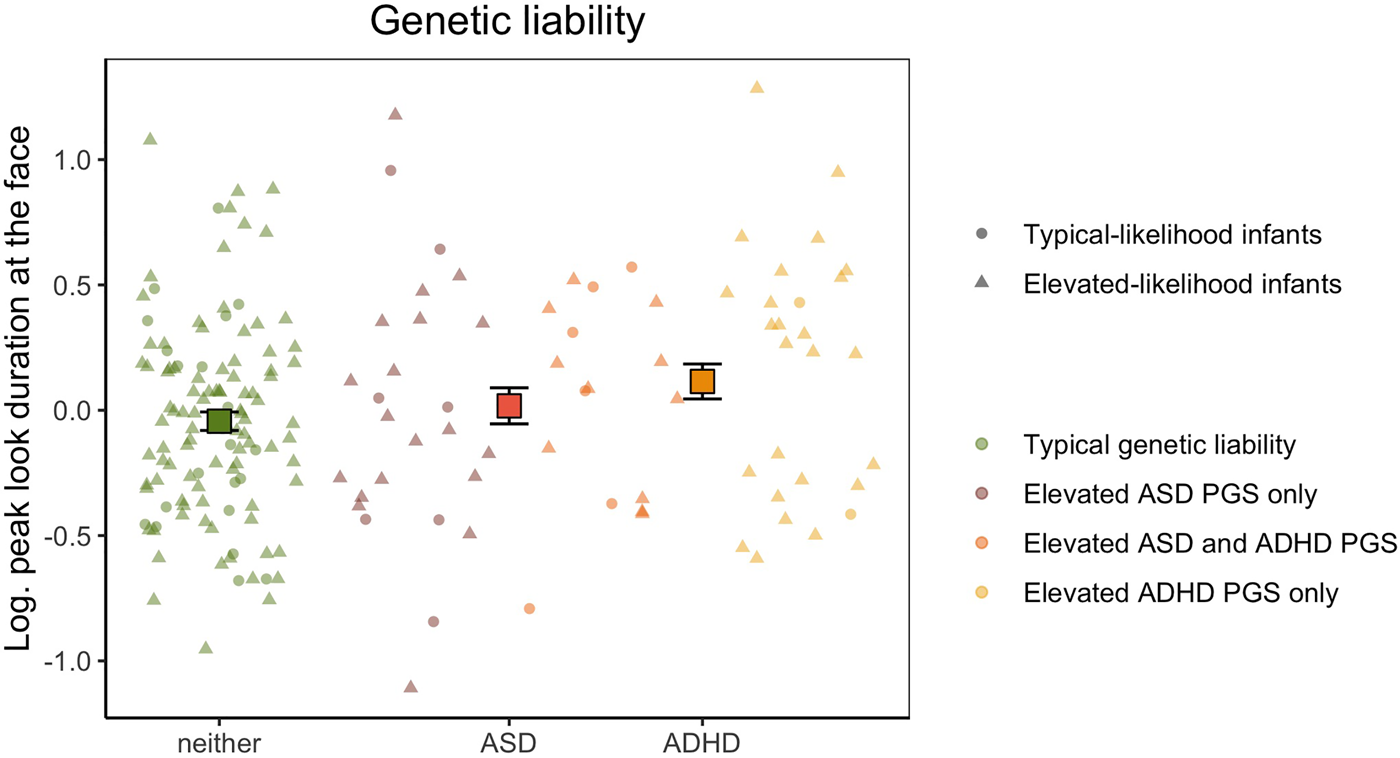
Figure 2. Mean peak look duration at the face for infants with elevated genetic liability of autism spectrum disorder (ASD), attention-deficit hyperactivity disorder (ADHD) or neither conditions. The peak look duration values presented on the y-axis are log-transformed and adjusted for the effect of number of valid trials and age. Error bars represent ±1 standard error of the mean. All individual data are represented by points (elevated-likelihood of ASD and/or ADHD(EL)) or triangles (typical-likelihood of ASD and/or ADHD (TL)) and color-coded based on whether the infant had typical genetic liability (green), polygenic score in the top quartile for ASD only (brick), polygenic score in the top quartile for ADHD only (yellow), or polygenic score in the top quartile for both ASD and ADHD (orange).

Figure 3. Linear relationship between peak look duration at the face (on the y-axis) and attention-deficit hyperactivity disorder (ADHD) polygenic score (on the x-axis). Peak look duration values are log-transformed and adjusted for the effect of number of valid trials and age. The shaded area around the black regression line represents the standard error of the beta estimate. All individual data are represented by points (elevated-likelihood of ASD and/or ADHD (EL)) or triangles (typical-likelihood of ASD and/or ADHD (TL)) and color-coded based on whether the infant had typical genetic liability (green), polygenic score in the top quartile for ASD only (brick), polygenic score in the top quartile for ADHD only (yellow), or polygenic score in the top quartile for both ASD and ADHD (orange). Color-coded regression lines for each of these subgroups are also presented in the figure.
When examining mean peak look to all stimuli, our categorical analysis revealed that there was no significant main effect of having elevated ASD (F(1,179) = 0.341, p = .559, $\eta _p^2$ = 0.002) or ADHD genetic liability (F(1,179) = 0.402, p = .527, $\eta _p^2$
 = 0.002) and no significant interaction effect (F(1,179) = 2.108, p = .148, $\eta _p^2$
 = 0.012). The same pattern of results was found when including Phase as a covariate (ASD: F(1,177) = 0.033, p = .857, $\eta _p^2$
 < 0.001; ADHD: F(1,177) = 0.269, p = .605, $\eta _p^2$
 = 0.002; ASD*ADHD: F(1,177) = 1.963, p = .163, $\eta _p^2$
 = 0.011). When testing their linear relationship, we found no association between mean peak look duration at all stimuli and polygenic score for ASD (β = 0.005, SE = 0.021, p = .805; with Phase as covariate: β = <0.001, SE = 0.020, p = .993) and ADHD (β = 0.006, SE = 0.021, p = .781; with Phase as covariate: r = .008, SE = 0.020, p = .682).
Toddler temperament traits
Of the 335 infants with valid peak look data at 14 months, 272 also had ECBQ scores at 2 years. For these children, log-transformed peak look durations were normally distributed (W = 0.997, p = .918) and variance homogenous between groups for the 2 × 2 factorial design (F(3,268) = 1.286, p = .279). We found that having elevated levels of shyness at two years was not significantly associated with peak look duration (F(1,266) = 0.739, p = .391, $\eta _p^2$ = 0.003, with Phase as covariate: F(1,264) = 0.055, p = .815, $\eta _p^2$
 < 0.001). There was also no effect of having elevated ADHD-related temperament traits, that is poor inhibitory control (F(1,266) = 1.311, p = .253, $\eta _p^2$
 = 0.005, with Phase as covariate: F(1,264) = 0.269, p = .605, $\eta _p^2$
 = 0.001) and interaction result did not support a multiplicative model where having elevated traits in both conditions significantly related to peak look duration (F(1,266) = 0.603, p = .438, $\eta _p^2$
 = 0.002, with Phase as covariate: F(1,264) = 0.534, p = .465,$\eta _p^2$
 = 0.0012).
The lack of evidence for an association between peak look durations at the face at 14 months and the selected temperament traits at 2 years was confirmed by the results of the multiple regression including continuous ECBQ shyness (β = −0.004, SE = 0.023, p = .850; with Phase as covariate: β = 0.014, SE = 0.022, p = .537) and inhibitory control scores (β = −0.030, SE = 0.027, p = .274; with Phase as covariate: β = −0.010, SE = 0.027, p = .703).
For mean peak look at all the stimuli in the array, we found no main effect of having elevated ASD traits (F(1,266) = 0.217, p = .642, $\eta _p^2$ < 0.001, with Phase as covariate: F(1,264) = 0.592, p = .442, $\eta _p^2$
 = 0.002) nor ADHD traits (F(1,266) = 1.235, p = .267, $\eta _p^2$
 = 0.005, with Phase as covariate: F(1,264) = 0.839, p = .361, $\eta _p^2$
 = 0.003). Further, there was no significant interaction effect (F(1,266) = 0.086, p = .770, $\eta _p^2$
 < 0.001, with Phase as covariate: F(1,264) = 0.101, p = .751, $\eta _p^2$
 < 0.001). While there was no linear association between mean peak look duration at all stimuli and ECBQ shyness scores (β = −0.011, SE = 0.015, p = .471, with Phase as covariate: β = −0.013, SE = 0.015, p = .392), we found that longer looking times at the stimuli in the array at 14 months of age was associated with reduced inhibitory control at 2 years (β = −0.038, SE = 0.017, p = .029). However, this result was not confirmed from the analyses which included Phase as a covariate (β = −0.026, SE = 0.018, p = .146).
Mid-childhood clinical traits
With our categorical approach, we tested whether peak look duration at the face in infancy was associated with elevated levels of ASD and/or ADHD clinical traits during mid-childhood defined using conventional clinical thresholds of the SRS and Conners Global Index total t scores (Figure 4) in 94 children with available questionnaire data at 6 years of age. The log-transformed peak look duration data had normal distribution (W = 0.988, p = .577) and equal variance between groups (F(3,90) = 0.607, p = .612). We found a trend of association between peak look duration at the face in infancy and elevated ASD traits at 6 years (F(1,88) = 3.218, p = .076, $\eta _p^2$ = 0.035), which became statistically significant when including Phase as covariate (F(1,87) = 4.202, p = .043, $\eta _p^2$
 = 0.046). Longer peak look duration at the face was observed in infants who later showed elevated ADHD traits (F(1,88) = 6.401, p = .013, $\eta _p^2$
 = 0.068, with Phase as covariate: F(1,87) = 4.948, p = .029, $\eta _p^2$
 = 0.053). The interaction effect was not significant, indicating that children with elevated levels of traits of both ASD and ADHD at 6 years did not show a specific pattern of peak look duration at the face in infancy (F(1,88) = 0.049, p = .826, $\eta _p^2$
 < 0.001, with Phase as covariate: F(1,87) = 0.018, p = .893, $\eta _p^2$
 < 0.001).
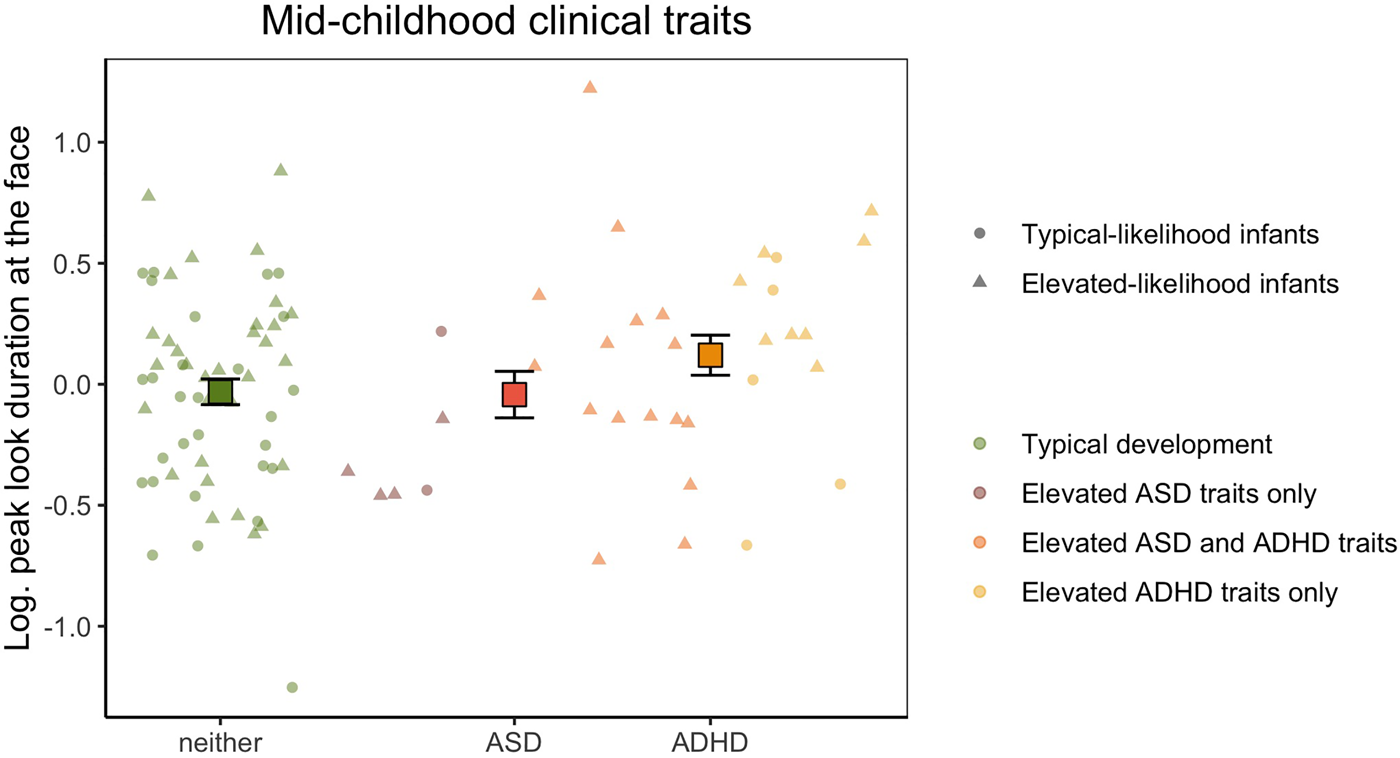
Figure 4. Mean peak look duration at the face for infants with typical development and children with elevated autism spectrum disorder (ASD) or attention-deficit hyperactivity disorder (ADHD) traits in mid-childhood. The peak look duration values presented on the y-axis are log-transformed and adjusted for the effect of number of valid trials and age. Error bars represent ±1 standard error of the mean. All individual data are represented by points (elevated-likelihood of ASD and/or ADHD (EL) or triangles (typical likelihood of ASD and/or ADHD (TL)) and color-coded based on whether the infant had typical development (green), scored above the ASD threshold only in the parent-report questionnaire (brick), scored above the ADHD threshold only in the parent-report questionnaire (yellow), or scored above the threshold for both ASD and ADHD (orange) at 6 years of age.
When examining the linear relationship with continuous t scores, we found no association with SRS t scores (β = −0.003, SE = 0.004, p = .271; with Phase as covariate: β = −0.004, SE = 0.003, p = .237) and a trend of positive association with Conners Global Index t scores (β = 0.007, SE = 0.004, p = .083) which was weaker when including Phase as a covariate (β = 0.005, SE = 0.004, p = .163).
Analyses on mean peak look duration at all the stimuli in the pop-out array revealed that there was no significant main effect of ASD (F(1,88) = 1.575, p = .213, $\eta _p^2$ = 0.018) or ADHD (F(1,88) = 1.803, p = .183, $\eta _p^2$
 = 0.020) outcome in mid-childhood. Additionally, there was no significant interaction effect (F(1,88) = 0.045, p = .832, $\eta _p^2$
 < 0.001). All these results were confirmed when including Phase as a covariate in the ANOVA models (ASD: F(1,87) = 1.790, p = .184, $\eta _p^2$
 = 0.020; ADHD: F(1,87) = 1.351, p = .248, $\eta _p^2$
 = 0.015; ASD*ADHD: F(1,87) = 0.066, p = .798, $\eta _p^2$
 < 0.001).
No significant associations were found between mean peak look duration and the SRS (β = −0.003, SE = 0.002, p = .181; with Phase as covariate: β = −0.003, SE = 0.002, p = .174) or Conners (β = 0.004, SE = 0.003, p = .176; with Phase as covariate: β = 0.003, SE = 0.003, p = .243) total t scores.
Discussion
The focus of this study was to develop a new framework for assessing how infant metrics reflecting emerging components of cognition might relate to different susceptibility and outcome profiles and how they can be used to study specificity of developmental trajectories, and thereby to evaluate whether they partially fulfil criteria for endophenotypes. As a proof-of-principle, we looked at early attention in the pathway to ASD and ADHD in infants considered at elevated likelihood of ASD and ADHD because of the presence of these conditions in first-degree family members. A series of analyses were conducted to investigate the relationship between familial and genetic liability factors, looking behavior in a face pop-out task recorded with eye-tracking at 14 months of age and later behavioral signs of the two neurodevelopmental conditions. Longer peak look duration at the face was found in infants with elevated polygenic score for ADHD, but not ASD. Further, longer peak look duration at the face in infancy was significantly associated with increased severity of ADHD traits in mid-childhood, while a weaker association was found with later ASD traits.
Overall, these findings suggest that peak look duration at the face amongst distractor items at the beginning of the second year of life should be further investigated as a specific developmental endophenotype of ADHD, as it is linked to genetic factors and to later traits associated with a clinical condition (Iacono et al., Reference Iacono, Malone and Vrieze2017). Further work should now explore whether it further co-segregates with categorical diagnosis of ADHD, and whether it is elevated in categorically unaffected siblings of children with ADHD as it is in typically developing children with an older sibling with ASD (Webb et al., Reference Webb, Jones, Merkle, Namkung, Greenson, Murias and Dawson2010). The statistical models used in the present study provided no evidence of an additive or multiplicative effect of ASD, indicating that the presence of liability or emerging traits of both conditions was not predictive of atypical looking behavior to faces more than the effects of liability and traits of ADHD alone. However, there was also a marginally significant association between early peak look to faces and later elevated ASD traits categorically (though not dimensionally, and the categorical effect was only significant when Phase was controlled). Below we present further considerations on the results obtained in this study and discuss possible models for the development of psychopathology arising from combining different type of data and multiple observations across childhood.
Polygenic effects
To validate a measure as an endophenotype, it is crucial to verify that it not only reflects increased familial liability for a clinical condition, but it also has a molecular genetic basis (Iacono et al., Reference Iacono, Malone and Vrieze2017). To this aim, we tested whether polygenic scores for ASD and ADHD explained any of the variance seen in our candidate developmental endophenotype, peak look duration at the face at 14 months of age. Polygenic scores, in which the effects of genotypes at many locations across the genome are summed, are increasingly used to query the genetic architecture of psychological traits and their correlates, where many genes of very small effect are responsible for heritability (Plomin, Reference Plomin2013). To our knowledge, no studies have investigated polygenic contributions to infant behavioral endophenotypes. However, there is suggestive evidence that polygenic scores for psychiatric conditions are significantly associated with neuroanatomical markers of atypical development in infants (Cullen et al., Reference Cullen, Krishnan, Selzam, Ball, Visconti, Saxena and Edwards2019) and with continuous phenotypes relying on social attention skills (Warrier et al., Reference Warrier, Grasby, Uzefovsky, Toro, Smith, Chakrabarti and Baron-Cohen2018) and cognitive test scores (Hagenaars et al., Reference Hagenaars, Harris, Davies, Hill, Liewald, Ritchie and Deary2016) in childhood. Taken together, these and our findings suggest that characterization of genetic liability in (necessarily smaller) deeply phenotyped prospective longitudinal cohorts will be a powerful way in which to explore the developmental paths to neurodevelopmental and psychiatric conditions.
The present results demonstrated that polygenic contribution to our candidate developmental endophenotype was highest when considering common variants associated with ADHD. The base GWAS used for ADHD polygenic score calculation (Demontis et al., Reference Demontis, Walters, Martin, Mattheisen, Als and Agerbo2019) is larger (by ~700 cases and ~6,000 controls) than the one currently available for ASD (Grove et al., Reference Grove, Ripke, Als, Mattheisen, Walters and Won2019). Moreover, while a polygenic score obtained from the ASD GWAS predicts 2.45% of the variability in the ASD clinical phenotype (Grove et al., Reference Grove, Ripke, Als, Mattheisen, Walters and Won2019), the ADHD polygenic score explains around 5.5% of the variance in categorical diagnosis of ADHD (Demontis et al., Reference Demontis, Walters, Martin, Mattheisen, Als and Agerbo2019) in large populations. Thus, it is possible that the present result simply reflects the greater predictive power of a polygenic score obtained from the ADHD GWAS summary statistics, rather than indicating genetic specificity. It will be important to confirm whether the variance in peak look duration explained by the ASD polygenic score increases as larger discovery GWASes for ASD are reported and more powerful polygenic scores emerge (Anney et al., Reference Anney, Ripke, Grove, Damm Als, Mattheisen, Walters and Børglum2017; Geschwind & Konopka, Reference Geschwind and Konopka2009). Further, it should be noticed that GWASes capture common genetic contributions to clinical conditions identified in adult populations, which might not necessarily be informative of developmental effects.
In the main analyses looking at genetic liability as a categorical variable, we found that being in the top quartile of the distribution for ADHD polygenic score was significantly associated with peak look duration. Further, when examining the linear association between polygenic score and the continuous endophenotype obtained in the score construction (section 2 of the Supplementary Materials), we saw that the aggregate effect of variants known to be associated with ADHD predicted maximum 1.7% of the variance in peak look duration at the face in the BASIS infants. This effect is undoubtedly very small in absolute terms, and is unlikely to have clinical utility. However, if put in the context of similar research, the amount of variance explained is higher than that observed in studies using polygenic scores to predict ASD-relevant continuous traits tested during childhood in large cohorts. For example, an ASD polygenic score predicted 1.3% of the variance in autistic traits at 8 years of age (St Pourcain et al., Reference St Pourcain, Robinson, Anttila, Sullivan, Maller, Golding and Davey Smith2018) in a sample of 5,553 children. A polygenic score for cognitive empathy significantly predicted 0.3% of the variance in the performance in a computerized test of “theory of mind” abilities in 4,577 13-year-olds (Warrier & Baron-Cohen, Reference Warrier and Baron-Cohen2018). Our data suggest that a categorical approach comparing groups individuals at low and elevated genetic liability (i.e., the latter being defined as those at the tail of the polygenic score distribution, see also Li, Reference Li2019) could help identifying elements of atypical development that should be targeted by symptomatology-specific intervention (Jeste & Geschwind, Reference Jeste and Geschwind2014).
The effect of polygenic scores should not be considered an exhaustive evaluation of the genetic contributions to the examined developmental endophenotype. A more precise picture of genetic effects would be provided by assessing whether rarer genetic variants (including inherited and de novo copy number variants, or CNVs) also account for part of the variability seen in infant peak look duration. First-degree relatives of individuals with ASD have an increased rate of rare genetic variants and advanced paternal age is also associated with an increased risk of de novo mutations (Iossifov et al., Reference Iossifov, Ronemus, Levy, Wang, Hakker, Rosenbaum and Wigler2012; Leppa et al., Reference Leppa, Kravitz, Martin, Andrieux, Le Caignec, Martin-Coignard and Geschwind2016); given the established role of de novo CNVs in liability to ASD, this is an avenue worth exploring in studies of infants at elevated likelihood of ASD. In the future, comprehensive genetic characterization of longitudinal infant cohorts would allow researchers to conduct a more powerful validation of developmental endophenotypes and provide more accurate information about the contribution of the full spectrum genetic factors underlying the emergence of psychopathology (Dick, Reference Dick2018; Iacono et al., Reference Iacono, Malone and Vrieze2017).
Combining data to understand mechanisms
Examining the role of developmental endophenotypes in the pathway to neurodevelopmental conditions might inform on processes occurring during specific developmental periods when genetic factors have more powerful effects. Based on previous studies specifically examining infant peak look duration at faces (Hendry et al., Reference Hendry, Jones, Bedford, Gliga, Charman, Johnson and Wass2018; Jones et al., Reference Jones, Dawson, Kelly, Estes and Webb2017; Webb et al., Reference Webb, Jones, Merkle, Namkung, Greenson, Murias and Dawson2010), we predicted that longer looking time in infancy would have been associated with behavioral characteristics of neurodevelopmental conditions later in childhood. Indeed, we found that longer peak look duration at 14 months of age related to both increased genetic vulnerability for ADHD and later ADHD clinical manifestations (Kao & Thomas, Reference Kao and Thomas2010). This is consistent with another study showing that infant siblings of children with ASD who later received a diagnosis of ADHD presented longer look durations at the screen during an eye-tracking task from three months of age compared to children without ADHD, and no change in duration across the first two years of life (Miller, Iosif, Young, Moore Hill, & Ozonoff, Reference Miller, Iosif, Young, Moore Hill and Ozonoff2018). Thus, longer peak look durations in infancy could reflect genetically driven atypicalities of brain structure or function resulting in domain-general problems which affect sensory processing and attentional control often seen in individuals with ASD and ADHD (Gliga, Jones, Bedford, Charman, & Johnson, Reference Gliga, Jones, Bedford, Charman and Johnson2014; Piven, Elison, & Zylka, Reference Piven, Elison and Zylka2017; Polderman et al., Reference Polderman, Hoekstra, Vinkhuyzen, Sullivan, Van Der Sluis and Posthuma2013).
Indeed, hypoactivation of brain networks involved in attention and executive functioning has been consistently reported by functional magnetic resonance imaging (fMRI) studies in children and adults with ADHD (Cortese et al., Reference Cortese, Kelly, Chabernaud, Proal, Di Martino, Milham and Xavier Castellanos2012). In line with the idea that longer look durations relate to emerging difficulties in executive functioning, in a previous study on a subset of the present cohort, change in peak look duration between 9 and 15 months significantly predicted later effortful control skills, whereby children with weaker effortful control at three years of age showed a smaller decline in peak look duration at faces with age in infancy (Hendry et al., Reference Hendry, Jones, Bedford, Gliga, Charman, Johnson and Wass2018). A possible explanation for these findings could be that in the face pop-out task children with stronger attentional control became more successful (i.e., faster) in shifting the gaze away from the face stimulus and directing it to the other stimuli in the array in the second year of age. Similarly, in an independent typical-likelihood population, shorter duration of looks during infancy predicted better inhibitory control in adolescence (Sigman, Cohen, & Beckwith, Reference Sigman, Cohen and Beckwith1997), providing further evidence of a possible link between early look duration profiles and emerging executive function (Conejero & Rueda, Reference Conejero and Rueda2017). Of note, our toddlerhood analyses did not reveal a significant association between look duration at 14 months and inhibitory control at 2 years of age. As the effect of genotype in neurodevelopmental trajectories becomes stronger with age across childhood (Stergiakouli et al., Reference Stergiakouli, Davey Smith, Martin, Skuse, Viechtbauer, Ring and St Pourcain2017), our candidate developmental endophenotype might indeed reflect an effect of ADHD-related genetic variants that is only emerging later in development. A further critical question will be to address whether looking profiles may associate differentially with later ADHD across development. Indeed, previous work has linked shorter look durations measured in the first few months of life to later ASD (Wass et al., Reference Wass, Jones, Gliga, Smith, Charman and Johnson2015) and ADHD (Papageorgiou, Farroni, Johnson, Smith, & Ronald, Reference Papageorgiou, Farroni, Johnson, Smith and Ronald2015). Developmental shifts in looking profiles are likely underpinned by the changing hegemony of the endogenous and exogenous attentional control systems over looking behavior (Colombo, Reference Colombo2001; Hendry, Johnson, & Holmboe, Reference Hendry, Johnson and Holmboe2019). Within a developmental psychopathology framework, atypicalities may manifest in different ways at different ages. Statistical techniques designed to ask whether later effects are causally mediated through earlier effects will be important in this area.
When considering possible mechanisms linking early peak look duration profiles and ADHD it is worth notice that our results were specific to faces. Control analyses revealed that no significant relationships were observed when examining mean peak look duration at all the stimuli. Notably, infants generally looked longer at the face in the arrays presented in our study (see Supplementary Figures SM.1A and SM.1B). The face likely thus captured attention more strongly, which may have made it harder for infants to disengage from it to orient to distractor objects (see also Colombo et al., Reference Colombo, Shaddy, Richman, Maikranz and Blaga2004). In fact, infants’ arousal levels during alerting influence their ability to orient attention towards a stimulus among distractors (Kleberg, del Bianco, & Falck-Ytter, Reference Kleberg, del Bianco and Falck-Ytter2019). Thus, dysfunctional modulation in the alerting network may influence attentional capacity especially for faces, that are possibly over-arousing stimuli given their complex nature (Keehn, Müller, & Townsend, Reference Keehn, Müller and Townsend2013; Senju & Johnson, Reference Senju and Johnson2009). Of note, an adult study reports dysregulation in the alerting systems and more distractibility due to conflicting stimuli in individuals with ADHD who also showed signs of mood disorder (Lundervold et al., Reference Lundervold, Halleland, Adolfsdottir, Halmøy, Plessen and Haavik2011). We might have observed a similar pattern in our infants who later showed elevated ADHD traits using the face pop-out task. Moreover, aggregate effects of genetic variants involved in the dopamine/norepinephrine neurotransmission (regulating the alerting attention system, see Petersen & Posner, Reference Petersen and Posner2012) were specifically associated with severity of symptoms in the hyperactive/impulsive domain in children with ADHD (Bralten et al., Reference Bralten, Franke, Waldman, Rommelse, Hartman, Asherson and Arias-Vásquez2013). Thus, our findings could reflect ADHD-related atypicalities in the alerting system due to genetic factors that lead to difficulties in disengaging from the face to direct attention to competing stimuli. Further investigations on the role of the alerting system in individuals at elevated genetic liability for ADHD should include multiple neurocognitive measures to disentangle the different aspects of selective attention involved in the developmental endophenotype analyzed in the current study (Beauchaine & Constantino, Reference Beauchaine and Constantino2017; Hommel et al., Reference Hommel, Chapman, Cisek, Neyedli, Song and Welsh2019).
This proof-of-principle study could help us to shed light on the overlap and specificity of developmental pathways to ASD and ADHD. In our sample, we found a high correlation between dimensional levels of ADHD and ASD traits at age 6 years (see Supplementary Figure SM.7), in line with previous reports (Chien et al., Reference Chien, Chou, Chiu, Chou, Wu, Tsai and Gau2017; Shephard et al., Reference Shephard, Bedford, Milosavljevic, Gliga, Jones and Pickles2019; Stergiakouli et al., Reference Stergiakouli, Davey Smith, Martin, Skuse, Viechtbauer, Ring and St Pourcain2017). However, while overlap of behavioral profiles is seen in mid-childhood, our results revealed that atypical look duration at the face among distractors is associated with later ADHD, while the link with later ASD is less strong (though possibly confounded by cohort-specific differences). This pattern of results indicates that our candidate developmental endophenotype could be more closely involved in the development of ADHD profiles. The fact that we saw little overlap between groups defined for the four levels of analysis (i.e., familial liability, genetic liability, toddler temperament traits, and mid-childhood clinical traits) indicates that in our sample elevated genetic liability for ADHD did not necessarily lead to high levels of ADHD traits in mid-childhood. Indeed, individual developmental paths result from cascades of processes interacting across childhood (Marechal et al., Reference Marechal, Johnson, Sirois, Spratling, Thomas and Westermann2007) and timing of genetic and environmental influences determines the effect of their contribution to trajectories over the course of development (Panchanathan & Frankenhuis, Reference Panchanathan and Frankenhuis2016). In one of their models of the developmental emergence of behavioral symptoms of ASD, ADHD and co-occurrence of the two conditions, Johnson et al. (Reference Johnson, Gliga, Jones and Charman2014) hypothesized that common susceptibility factors generate common adaptive processes that, depending on the developmental periods in which they are activated, produce condition-specific outcomes (Johnson et al., Reference Johnson, Gliga, Jones and Charman2014). The approach proposed in this study could be further expanded leveraging data collected at multiple time-points within infant-sibling studies to explore longitudinal changes in the contribution of developmental endophenotypes to neurodevelopmental conditions.
Another of the models proposed by Johnson et al. (Reference Johnson, Gliga, Jones and Charman2014) assumes that, while susceptibility factors as well as early signs that precede symptoms are condition-specific, the relation between these and future outcome depends on the presence of general protective factors. Thus, either ASD, ADHD or overlapping symptomatology might emerge depending on the interaction with a domain-general protective factor. The proposition that our candidate endophenotype could reflect individual differences in executive functioning could be interpreted according to this model. In fact, Johnson (Reference Johnson2012) theorized that executive function skills have a protective value across neurodevelopmental conditions, as individuals with strong executive function skills might be better able to compensate for early neural atypicalities related to presence of susceptibility factors (Johnson, Reference Johnson2012). Indeed, although peak look duration was specifically related to polygenic risk scores for ADHD and not ASD, the relation with mid-childhood traits of ASD was also significant if Phase was controlled. These findings provide preliminary evidence that should encourage future research to specifically test whether executive function skills mediate between ADHD-specific genetic liability factors and later broad neurodevelopmental traits.
Taken together, our results suggest that longer peak look duration at the face in infancy is a promising developmental endophenotype of ADHD, possibly reflecting enhanced vulnerability in early visual attention due to ADHD-related genetic factors that might affect alerting and/or executive function and contribute to the consolidation of ADHD-related behavioral features (Johnson et al., Reference Johnson, Gliga, Jones and Charman2014). As we showed in this proof-of-principle, investigating the relationship between early signs of atypical behavior, molecular genetics data and later behavioral traits might advance our knowledge on mechanisms underlying neurodevelopmental conditions.
What is familial liability?
Our methodological approach for this analysis might not be very sensitive in capturing the different aspects that contribute to familial liability effects. In the present study, “familial liability” was measured as the presence of ASD and/or ADHD symptomatology in one of the first-degree family members reported by parents. While this approach has been widely used to obtain a proxy of increased genetic predisposition to psychopathology, it does not allow us to disentangle how different elements of the familial environment of the individual contribute to shaping their developmental trajectory. Individuals within the same family share not only part of their DNA sequence, but also the same rearing and socioeconomic environment. While examining the relationship between developmental endophenotypes and the presence of diagnosis in first-degree family members could serve as initial step of analysis, considerations on our results suggest that future investigations should aim to disentangle the different factors contributing to or confounding the effect of bio-ecological contexts underlying familial liability.
Differently from previous reports analyzing overlapping cohorts of Phase 1 and 2 participants (Elsabbagh et al., Reference Elsabbagh, Gliga, Pickles, Hudry, Charman and Johnson2013; Hendry et al., Reference Hendry, Jones, Bedford, Gliga, Charman, Johnson and Wass2018), in our study we did not find evidence for an association between familial liability for ASD and peak look duration at the face in a face pop-out task in the second year of age. However, we found that familial liability for ADHD was associated with the same measure. This result was not robust to including Phase as a covariate in the analysis nor when examining only the Phase 3 sample (which was the only cohort with individuals classified as having familial liability for ADHD but not ASD). This indicates that the observed result might primarily derive from having familial liability for the two neurodevelopmental conditions in the older sibling. Of note, recurrence for these neurodevelopmental conditions within families can vary by degree of relatedness (see Franke et al., Reference Franke, Faraone, Asherson, Buitelaar, Bau, Ramos-Quiroga and Reif2012; Sandin et al., Reference Sandin, Lichtenstein, Kuja-Halkola, Larsson, Hultman and Reichenberg2015). In fact, parental nonshared genetic variants (Kong et al., Reference Kong, Thorleifsson, Frigge, Vilhjalmsson, Young, Thorgeirsson and Stefansson2018), indirect effects of parental genome (Wertz et al., Reference Wertz, Belsky, Moffitt, Belsky, Harrington, Avinun and Moffitt2019) as well as parent–sibling relationships (Oliver & Alison, Reference Oliver and Alison2018) can have specific effects on the offspring's psychological traits. Future analyses should aim to study each element specifically to deeply understand whether any of these play an additional role that complement the effect of aggregate polygenic variation.
Limitations and further considerations for future research
A first challenge of this project was to reduce differences between Phases when defining familial liability groups. Our choice was to exclude the participants for whom we had no recent parent-report information on the presence of ADHD traits in the family, if no questionnaire on ADHD was available for the older siblings. This indeed led to the exclusion of a potentially informative subset of the sample and introduces additional risk of selection bias in our cohort (Wolke et al., Reference Wolke, Waylen, Samara, Steer, Goodman, Ford and Lamberts2009). Moreover, for one of the cohorts (Phase 3), our recruitment criteria were based on the presence of one of the two clinical conditions in the individual's parent and/or an older sibling. As recurrence might change by degree of relatedness and different mechanisms be involved in this process, as discussed above, future studies aiming to investigate these should consider eliminating or controlling for this difference. Using registries of routinely collected health data in large-scale cohorts might help to understand family-level differences and to identify potential confounders when examining effects of familial liability (Fearon, Reference Fearon2019).
In the present study, to have a consistent approach when evaluating ASD and ADHD-related liability and traits using data from different sources, we applied a categorical approach dichotomizing continuous variables used to measure the degree of ASD and ADHD liability/symptomatology. While pre-defined thresholds for ASD and ADHD clinical characterization exist for SRS and Conners total t scores, which were used to assess traits at age 6 years, there were no previous indications from normative samples for condition cut-offs for the polygenic and ECBQ scores. Therefore, we assigned, for each of the polygenic and ECBQ scores, value of 1 to ASD and ADHD dummy variables for individuals in the extreme quartile of the distribution. This approach allowed us to obtain a discrete number of individuals in each group and to use a unique method to define elevated genetic and behavioral burden for neurodevelopmental conditions. However, our quartile thresholds were based on all available BASIS data of each specific measure and are necessarily relative to the current sample. Given that the BASIS sample is mainly composed by individuals at elevated likelihood of ASD and/or ADHD, a replication on a population-based sample would be ideal to validate our results.
Another limitation of the present study is that clinical ASD and ADHD diagnosis was not available for a proportion of the participants. While recent revisions of the endophenotype concept suggested that examining relationships with dimensional transdiagnostic traits could provide more generalizable information on the role and clinical utility of candidate developmental endophenotypes (Beauchaine & Constantino, Reference Beauchaine and Constantino2017; Iacono et al., Reference Iacono, Malone and Vrieze2017), a validation based on DSM diagnosis, as required by the original framework (Gottesman & Gould, Reference Gottesman and Gould2003), was not possible in the present sample. This limitation indicates that future work using designs with diagnostic outcome will be required before peak looking duration as a condition-specific developmental endophenotype can be verified.
Importantly, observations on looking behavior based on the face pop-out screen-based paradigm used in the present study cannot be directly interpreted as endogenous attention directed to people during social interactions. Wass (Reference Wass2014) found that individual differences in peak look duration recorded with eye-tracking from 11-month-old typically developing infants were consistent across static and dynamic screen stimuli but were unrelated to individual differences in looking behavior during free play with objects. Indeed, susceptibility to high luminance contrasts and sudden changes in stimulus onset–offset may trigger individual differences on screen-based tasks, but are not relevant in more naturalistic context. In the latter, the complexity of the visual scene might have a different impact to looking behavior compared to the limited number of uncontrolled distractors in screen-based tasks (Wass, Reference Wass2014). These considerations illustrate that in future research it will be important to further investigate to what extent the measures selected as candidate developmental endophenotypes of neurodevelopmental conditions reflect responses obtained in ecologically valid contexts. Importantly, peak look duration differed by Phase and interpreting the effect of Phase is complicated in the BASIS sample. As explained in the Supplementary Methods section 4, Phases differed in the ratio of individuals with familial history for the conditions as well as in some aspects of the face pop-out task, and on the visit protocol the pop-out task was embedded. In this study, we considered as “robust” the results that were significant with and without the inclusion of Phase as a covariate. While combining cohorts in order to obtain large sample sizes may be advantageous to obtaining sufficient power and generalizability for the study of endophenotypes (Dick, Reference Dick2018), this challenges researchers in finding ways to deal with between-cohort differences.
Accuracy and precision of eyetracking data were only recorded in the Phase 3 sample, but show that the quality of at least this proportion of the data is sufficient for the metrics calculated (see Supplementary Figure SM.9). While these metrics are important when interpreting the results of AOI analyses, we believe that the face pop-out task is relatively protected against spatial error for two reasons. First, the stimuli were large (~3.5°–9°) and arranged in an annular array, with a minimum separation (between closest edges) of ~3.5°. Even in cases of particularly poor calibration, accuracy drift of this magnitude would be substantial and is not expected. Second, the arrangement of each AOI within the annular array was balanced across slides. The influence of systematic spatial error should therefore not bias the results toward any particular AOI once averaged across all trials.
Conclusions
The present study combines three different cohort datasets of eye-tracking measures as well as genotype data and parent-report questionnaire data for over 300 infants with and without a first-degree family member with ASD or ADHD. We found that early alterations in visual attention, represented by longer look durations at face images among other items at 14 months of age, may lie on the path from genetic liability for ADHD to later traits of this condition, and that the early part of this developmental trajectory is not shared with ASD. Thus, a phenotype previously noted in elevated-likelihood infants as a group related to genetic risk for ADHD and later ADHD traits, although this emerged only by looking at symptoms in mid-childhood. This proof-of-principle study highlighted the importance of measuring multiple traits and having long-term follow-up data to uncover the role of developmental endophenotype on the trajectory to psychopathology. Future studies should use neurocognitive marker tasks (Beauchaine & Constantino, Reference Beauchaine and Constantino2017) and longitudinal models (Dick, Reference Dick2018; Fearon, Reference Fearon2019; Johnson et al., Reference Johnson, Gliga, Jones and Charman2014) to evaluate the relationship between domain-general processes and early signs of divergent developmental trajectories.
Supplementary Material
The supplementary material for this article can be found at https://doi.org/10.1017/S0954579420000930
Acknowledgments
We would like to thank all the families who participated in the British Autism Study of Infant Siblings (BASIS) and Studying Autism and ADHD Risks (STAARS). We also would like to acknowledge the following members of the BASIS-STAARS team for their contribution to data collection and experimental set-up: Mary Agyapong, Simon Baron-Cohen, Tessel Bazelmans, Rachael Bedford, Anna Blasi, Patrick Bolton, Susie Chandler, Celeste Cheung, Mayada Elsabbagh, Mutluhan Esroy, Janice Fernandes, Isobel Gammer, Holly Garwood, Amy Goodwin, Kristelle Hudry, Rianne Haartsen, Rebecca Holman, Sarah Kalwarowsky, Anna Kolesnik, Michelle Liew, Sarah Lloyd-Fox, Helen Maris, Bosiljka Milosavljevic, Louise O'Hara, Andrew Pickles, Laura Pirazzoli, Helena Ribeiro, Erica Salomone, Chloe Taylor, Leslie Tucker. We acknowledge Laurel Fish, Matthew Danvers, Candice Moore and Laura Lennuyeux-Comnene for support with the genetic data collection and Hamel Patel for DNA data pre-processing and genotyping. Thanks to Pasco Fearon, Kate Baker and Jacob Grove for fruitful discussions on the study approach and analytical methods.
Author Contributions
A.G. and E.J.H.J. wrote the manuscript with the contribution of L.M., M.H.J, T.G., T.C., E.M., A.H. and E.S. T.G. designed the eye-tracking task. G.P., J.B.A. and the BASIS team collected the eye-tracking and behavioral data. A.G and E.S. collected the mid-childhood questionnaire data and family history information. L.M. and T.G. pre-processed the eye-tracking data. A.G., E.M. and E.J.H.J. coordinated genetic data collection, extraction, and analyses. C.C. curated DNA extraction and genotyping. M.H.J., T.C., T.G., E.J.H.J. and the BASIS team conceived the BASIS and STAARS studies. All authors read and approved the final version of this manuscript.
Funding Sources
The genetic data collection and manuscript preparation have been supported by European Union's Horizon 2020 research and innovation program under the Marie Skłodowska-Curie [grant number 642996], Wellcome Trust Institutional Strategic Support Fund and Economic and Social Research Council [grant number ES/R009368/1] to A.G. The Simons Foundation Autism Research Initiative (SFARI) Pilot Award [grant number 511504] supported the genetic data generation and E.J.H.J and E.M. in conceiving the general approach. The experimental and behavioral data collection for all Phases of BASIS was funded by MRC Programme [grant numbers G0701484 and MR/K021389/1], the BASIS funding consortium led by Autistica (www.basisnetwork.org). The results leading to this publication have received partial funding from the Innovative Medicines Initiative (IMI) Joint Undertaking, under grant agreement No 115300, for the project EU-AIMS. This Joint Undertaking received resources from the European Union's Seventh Framework Programme (FP7/2007-2013), and the European Federation of Pharmaceutical Industries and Associations companies (EFPIA) in kind contribution and. Further, this work was supported by the IMI 2 Joint Undertaking under grant agreement No 777394 for the project AIMS-2-TRIALS which receives support from the European Union's Horizon 2020 research and innovation programme and the European Federation of Pharmaceutical Industries and Associations companies’ in-kind contributions, and from Autism Speaks, Autistica and the Simons Foundation for Autism Research Initiative.
Conflict of Interest
The authors declare no conflict of interest
Ethical Standards
Ethical approval for behavioral data collection for this study was obtained from a Health Research Authority of the English National Health Service (Research Ethics Committees -REC- reference number 08/H0718/76 and 06/MRE02/73). The collection of human saliva samples for DNA extraction and analysis received ethical approval as part of a project called BASIS—Human Genome or gBASIS (REC number 15/LO/0468).
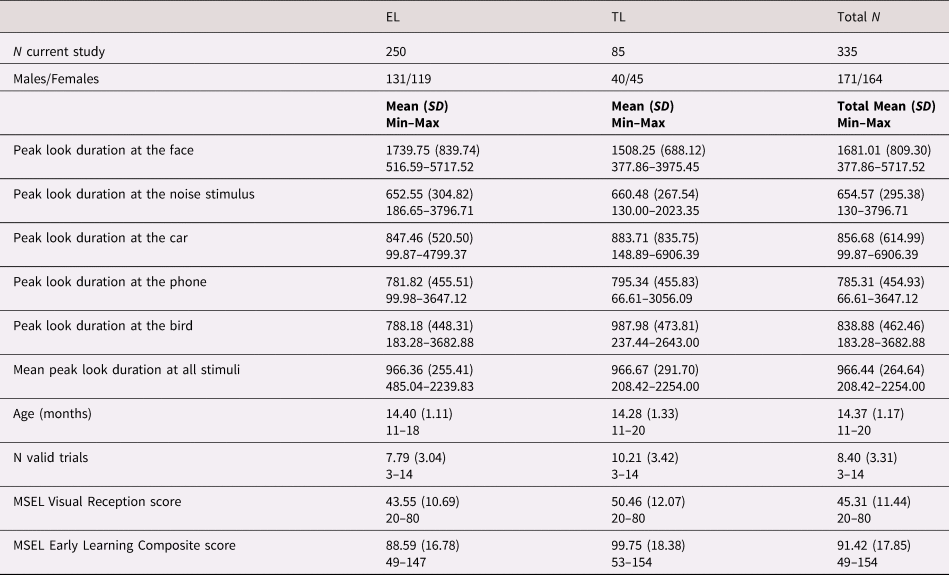


 Open access