


Adipocytes play a critical role in energy balance. The connection between fuel utilisation and skeletal re-modelling begins in the bone marrow with lineage allocation of mesenchymal stem cells to adipocytes or osteoblasts( Reference Kawai, Devlin and Rosen 1 ). Excessive consumption of high-fat diet (HFD) leads to obesity, and this results in deteriorated bone microarchitecture( Reference Gerbaix, Metz and Mac-Way 2 – Reference Gautam, Choudhary and Khedgikar 4 ). Ageing, secondary causes of osteoporosis including diabetes mellitus, glucocorticoids and immobility are also associated with bone marrow adiposity( Reference Rosen and Bouxsein 5 ). Importantly, fat in bone marrow might not only suppress osteoblasts but also might promote bone resorption, because marrow adipocytes secrete certain inflammatory cytokines capable of recruiting osteoclasts( Reference Xiao, Cui and Li 6 ). Therefore, understanding the signalling pathways that govern adipose differentiation may provide therapeutic strategies for both obesity and bone-related disorders.
There are various regulatory pathways that control both diseases. AMP-activated protein kinase (AMPK) plays a central role in the regulation of energy metabolism( Reference Viollet, Horman and Leclerc 7 ). The ability of AMPK to switch cells from an anabolic to a catabolic state suggests that activators of the kinase might be effective agents for the treatment of obesity, type 2 diabetes and the metabolic syndrome. Recent studies have shown the association between AMPK and wingless-related integration site (Wnt)/β-catenin signalling( Reference Zhao, Yue and Zhu 8 , Reference Zhao, Yue and Zhu 9 ). The Wnt/β-catenin pathway has been shown to inhibit adipogenesis by maintaining pre-adipocytes in an undifferentiated state through inhibition of CCAAT/enhancer-binding protein alpha (C/EBPα) and PPARγ ( Reference Bennett, Longo and Wright 10 , Reference Bennett, Ross and Longo 11 ) as well as to increase osteogenesis by directly regulating the runt-related transcription factor 2 (Runx2) gene( Reference Gaur, Lengner and Hovhannisyan 12 ). Wingless-related integration site-10b (Wnt-10b) has been found to be a potent inhibitor of adipogenesis( Reference Longo, Wright and Kang 13 , Reference Ross, Hemati and Longo 14 ). Forced expression of Wnt-10b or Wnt-1 in 3T3-L1 cells stabilises free cytosolic β-catenin by preventing proteasomal degradation of β-catenin and inhibiting the induction of PPARγ, thereby blocking adipogenesis( Reference Liu, Wang and Zuo 15 , Reference Li, Singh and Mofunanya 16 ). Moreover, the serine/threonine kinase glycogen synthase kinase-3 (GSK-3) has been recognised to coordinate with AMPK in phosphorylation( Reference Jin, George Fantus and Sun 17 ). However, some studies also report that β-catenin might inhibit adipogenesis by directly repressing transcription from the promoters of adipocyte genes( Reference Villanueva, Waki and Godio 18 , Reference Cawthorn, Bree and Yao 19 ).
Previous studies suggest that isoflavones may exert inhibitory effects on adipose tissue enlargement through assorted molecular pathways( Reference Orgaard and Jensen 20 – Reference Gautam, Khedgikar and Choudhary 22 ). Soya isoflavones have also been shown to be useful in preventing and treating postmenopausal osteoporosis because of their similarity in structure to oestradiol (E2), as E2 is a major regulator of adipocyte development and number in females and males( Reference Cooke and Naaz 23 ). Formononetin (FNT) (7-hydroxy-3(4-methoxyphenyl) chromone or 4′-methoxy daidzein) is a soya isoflavonoid, found abundantly in traditional Chinese medicine Astragalus mongholicus (Bunge) and Trifolium pratense L. (red clover) and in an Indian medicinal plant Butea monosperma ( Reference Maurya, Yadav and Singh 24 , Reference Wu, Li and Wu 25 ). Studies have shown that FNT induces apoptosis through various signalling pathways in prostate, breast and cervical cancer cell lines( Reference Chen, Zhao and Ye 26 – Reference Jin, Xu and Zhao 28 ). Moreover, our previous studies have shown that FNT stimulates osteoblast differentiation via the activation of p38 mitogen-activated protein kinase (MAPK) pathway, and oral administration of FNT in rodents increases bone mineral density at various anatomical positions( Reference Gautam, Bhargavan and Tyagi 29 , Reference Tyagi, Srivastava and Singh 30 ). However, the anti-obesity effect of FNT has not been explored. In this study, we show that FNT inhibits adipogenesis in 3T3-L1 pre-adipocytes and protects against obesity-induced bone loss in a HFD mouse model via AMPK and β-catenin activation. Overall, our study points to the fact that FNT acts as a dual therapeutic molecule both for obesity as well as obesity-induced bone loss.
Methods
In vitro studies
Cell culture and reagents
The 3T3-L1 fibroblast cell line was maintained in Dulbecco’s Modified Eagle’s medium (DMEM)/high glucose (Sigma-Aldrich) with 10 % newborn calf serum (Gibco™; Life Technologies), 100 units/ml penicillin and 100 µg/ml streptomycin at 37°C in a 5 % CO2 incubator. To induce differentiation, 100 % confluent 3T3-L1 pre-adipocytes (day 0) were stimulated for 2 d with MDI media (0·5 mm-3-isobutyl-1-methylxanthine (Sigma-Aldrich), 1 µm dexamethasone (DEX) (Sigma-Aldrich) and 5 µg/ml insulin (Gibco™) in DMEM/10 % fetal bovine serum (FBS; HyClone)). On day 3, the MDI media were replaced with differentiation media (5 µg/ml insulin in DMEM/10 % FBS). On day 6, the differentiation media were replaced with growth media (DMEM/10 % FBS). The cell culture media were changed every 2 d until full differentiation – that is, up to 9 d( Reference Jin, Xu and Zhao 28 ). To investigate the effect of FNT on adipogenesis in 3T3-L1, cells were differentiated in the presence or absence of FNT up to 9 d. Compound C (Sigma) was dissolved in dimethyl sulphoxide (DMSO) for cell culture studies (20-mm stock)( Reference Gao, Zhou and Xu 31 ). Cells were maintained in differentiation medium with compound C (10 µm), with or without FNT (10 nm), from day 0 to day 3 in six-well plates.
3-(4,5-Dimethylthiazol-2-yl)-2,5-diphenyltetrazolium bromide assay
The effect of FNT on cell viability of 3T3-L1 pre-adipocytes and differentiated adipocytes was analysed using 3-(4,5-dimethylthiazol-2-yl)-2,5-diphenyltetrazolium bromide (MTT). The 3T3-L1 pre-adipocytes were seeded at a density of 3×10³ cells/well in ninety-six-well plates. Both pre-adipocytes and mature adipocytes were incubated in culture medium, with or without FNT, for 48 h. After 48 h, the cells were incubated in the dark with an MTT solution for 4 h at 37°C. Formazan crystal products were dissolved in DMSO. Absorbance was measured spectrophotometrically at 570 nm (Molecular Devices).
Oil Red O staining
Differentiated 3T3-L1 adipocytes were fixed with 4 % formaldehyde for 20 min. Cells were then incubated with the Oil Red O (ORO) solution for 20 min and washed with PBS. The stained lipid droplets and cell morphology were observed by light microscopy (Nikon). Stained oil droplets were dissolved with isopropanol and quantified by spectrophotometry at 490 nm.
Measurement of intracellular reactive oxygen species generation
Differentiated 3T3-L1 cells were treated with or without FNT (10 nm concentration), lipopolysaccharide (LPS) (100 ng/ml) and N-acetyl-l-cysteine (NAC) (10 µm) for 48 h( Reference Lee, Song and Ju 32 ). Reactive oxygen species (ROS) determination was based on the oxidation of non-fluorescent 2,7-dichlorodihydrofluorescein diacetate (DCFDA) into a fluorescent dye – 2,7-dichlorofluorescein – by peroxide or nitric oxide production. Cells were washed with PBS and incubated for 30 min at 37°C in the dark with the oxidation-sensitive probe DCFDA (10 µg/ml) (Molecular Probes). Lysates were collected in 0·1 % Triton X-100, and production of ROS was measured by changes in fluorescence at an excitation wavelength of 495 nm and an emission wavelength of 525 nm.
Real-time PCR
Cells were homogenised using TRIzol reagent (Invitrogen), and total RNA was extracted according to the manufacturer’s protocol. For real-time PCR, complementary DNA was synthesised with Revert Aid cDNA synthesis kit (Fermentas) using 2·0 μg of total RNA. SYBR green chemistry was used for quantitatively determining the relative expressions of transcripts of all genes. All genes were analysed using the Light Cycler 480 (Roche Molecular Biochemicals) real-time PCR machine. Glyceraldehyde 3-phosphate dehydrogenase was used as an endogenous control in the comparative cycle-threshold (C T ) method. Primers for each specific gene are shown in the online Supplementary Table S2.
Western blot analysis
Cell pellets and tissues were lysed in radioimmunoprecipitation assay lysis buffer with 1 % phenylmethylsulfonyl fluoride, 1 % protease inhibitor cocktail and 1 % sodium orthovanadate. After treatment on ice for 30 min, cell lysates were clarified by centrifugation at 11 419 g for 30 min at 4°C to remove cell debris, and the protein content was measured by the Bradford method. Aliquots of the lysates were subjected to 10 % SDS-PAGE (with 5 % stacking gel) and transferred to a polyvinylidene fluoride membrane. The membranes were probed with PPARγ, C/EBPα, β-catenin, GSK-3β, phospho-GSK-3β (Ser-9) AMPK, phospho-AMPKα (T172) and β-actin antibodies (Abcam) followed by incubation with horseradish peroxidase-conjugated secondary antibodies (Cell Signaling Technology). β-Actin was used as a reference to normalise differences in the amounts of protein between samples. Membranes were developed using an enhanced chemiluminescence kit (Millipore) with ImageQuant LAS 4000 (GE Healthcare).
Immunofluorescence assay
After culturing 3T3-L1 cells in differentiation medium, with or without FNT, for 3 d, the cells were fixed with 80 % ethanol for 10 min, incubated in PBS containing 0·5 % Triton X-100 and washed three times with PBS. Cells were incubated with mouse monoclonal antibody against β-catenin (1:50) for 2 h at room temperature, followed by incubation with anti-mouse IgG Alexa 488 antibody (1:50) for 1 h. After washing with PBS, the cells were incubated for 1 min with DAPI (0·1 μg/ml) for nuclear staining at room temperature. Finally, the cells were examined and photographed using a fluorescent microscope (Eclipse 80i; Nikon) with the aid of an appropriate filter (excitation at 495 nm and emission at 519 nm).
In vivo studies
Animals and diet
All animal care and experimental procedures were approved by the Institutional Animal Ethics Committee (IAEC) with the number IAEC/2013/16, which followed the guidelines of the Committee for the Purpose of Control and Supervision of Experiments on Animals and conformed to the international norms of the Indian National Science Academy. In total, fifty, 4-week-old, male C57BL/6 mice were obtained from the National Laboratory Animal Centre and were randomly assigned to five groups: chow, HFD and HFD+FNT (0·1, 1, 10 mg/kg per d) of ten mice each. Animals were kept in a 12 h light–12 h dark cycle, with controlled temperature (22–24°C) and humidity (50–60 %), and were given ad libitum access to water and food. The control group was fed standard chow diet, and the remaining groups were fed HFD (D12109, 40 % kcal % fat; Research Diets, Inc.) (online Supplementary Table S1) for 12 weeks. Body weight was recorded weekly.
Biochemical analysis
Total cholesterol (TC), TAG, HDL and LDL were determined by colorimetric assays using a semiautomatic biochemistry analyser. TNFα and osteocalcin (OCN) levels were assayed using ELISA kits (Immunodiagnostic Systems Ltd) following the manufacturer’s protocols( Reference Gautam, Choudhary and Khedgikar 4 ).
Bone marrow cell culture
At the end of 12 weeks, bone marrow cells (BMC) were isolated from all mice groups and cultured according to our previously published protocol( Reference Gautam, Choudhary and Khedgikar 4 , Reference Gautam, Khedgikar and Choudhary 22 , Reference Khedgikar, Gautam and Kushwaha 33 ). For osteogenic differentiation, released bone marrow cells were collected and plated in forty-eight-well and twelve-well plates (1×10⁵, 2×10⁶ cells/well) in the culture medium, consisting of α-minimum essential media (α-MEM), supplemented with 10 % FBS, 100 nm DEX, 10 mm β-glycerophosphate and 50 µg/ml ascorbic acid, for alkaline phosphatase (ALP) activity and mineralisation, respectively. Both the ALP activity and the extracted stain (mineralised Ca nodules stained with alizarin) were quantified by an ELISA plate reader at 405 nm.
For adipogenic differentiation, 1×10⁷ BMCs were seeded in twenty-four-well plates and cultured in an adipogenic medium (DMEM) containing 1·0 µM DEX, 0·5 mm-isobutylmethylxanthine, 100 µm-indomethacin, 10 % FBS and insulin (10 µg/ml) for 7 d. On day 3, the medium was replaced with complete growth medium containing only insulin (10 µg/ml). The medium was replaced every 3rd day, and this was continued for 21 d. To quantify the incorporation of lipid, the area stained with ORO was measured by taking photomicrographs, and the extracted stain was quantified using an ELISA plate reader at 490 nm( Reference Gautam, Choudhary and Khedgikar 4 ).
Real-time PCR
Bone and adipose tissues were homogenised in liquid N2. Further procedures were carried out as described in the ‘Real-time PCR’ section of in vitro methods. Primers were designed using the Universal Probe Library (Roche Applied Sciences), and the sequences of primer sets for specific genes are shown in the online Supplementary Table S2( Reference Gautam, Choudhary and Khedgikar 4 , Reference Khedgikar, Kushwaha and Gautam 34 ).
Ex vivo micro-computed tomography
Micro-computed tomography (µCT) of excised bones was carried out using the SkyScan 1076 µCT scanner (Bruker MicroCT) as described earlier( Reference Gautam, Choudhary and Khedgikar 4 , Reference Khedgikar, Gautam and Kushwaha 33 , Reference Sashidhara, Kumar and Khedgikar 35 ). The X-ray source was set at 50 kV and 200 mA, with a pixel size of 9 µm. The bone samples were scanned at a voxel size of 9×9×9 µm. Reconstruction was carried out using SkyScan Nrecon software. A hundred projections were acquired over an angular range of 180°. Femora and tibia (cancellous bone) were analysed using CT analyser (CTAn, Skyscan) software. The threshold for analysis was determined empirically and set at 255 (scale 0–1000). For femoral and tibial metaphysis, 100 slices of secondary spongiosa were evaluated. µCT parameters bone volume/tissue volume (BV/TV), trabecular number (Tb.N), trabecular separation (Tb.Sp), trabecular thickness (Tb.Th), trabecular pattern factor (Tb.Pf) and the structure model index (SMI) of the distal femoral metaphysis (covering secondary spongiosa and the secondary ossification centre) and the proximal tibial metaphysis were evaluated. CTvol software was used to create three-dimensional (3D) models of bones( Reference Gautam, Choudhary and Khedgikar 4 , Reference Gautam, Kumar and Kushwaha 36 ).
Bone histomorphometry
Cross-sections (50-mm thickness) of the terminal periosteal regions of undecalcified femoral diaphysis of each mouse were obtained using an Isomet-Slow Speed Bone Cutter (Buehler). Images were captured using Leica-Qwin software (Leica Microsystems Inc.), and bone forming rate/bone surface (BFR/BS) and mineral appositional rate (MAR) were calculated( Reference Khedgikar, Kushwaha and Gautam 34 ).
Bone mechanical strength
Femora were subjected to a three-point bending test with bone strength tester model TK-252C (Muromachi Kikai Co. Ltd) for assaying bone mechanical strength according to previously published protocols( Reference Khedgikar, Kushwaha and Gautam 34 ).
Histology of adipose tissue
Abdominal fat pads were collected and fixed in PBS containing 4 % formalin, were embedded in paraffin and 6-µm-thick sections were stained with haematoxylin–eosin (H&E). Average adipocyte size of the fat pad was quantified by capturing four independent fields per blinded slide using ImageJ software (National Institutes of Health) and expressed in µm2/adipocyte( Reference Parlee, Lentz and Mori 37 ).
Statistical analysis
Values are expressed as means with their standard errors. Comparisons of each parameter among multiple treatments or groups were analysed by one-way ANOVA followed by Neuman–Keuls post hoc tests using Prism version 3.0 software. Student’s t test was used to study the statistical significance in experiments with only two treatments. Probability values <0·05 were considered to be statistically significant.
Results
Formononetin inhibits adipogenesis of 3T3-L1 pre-adipocytes
The chemical structure of the isoflavone FNT is shown in Fig. 1(A). To examine whether FNT possesses an inhibitory effect on cell viability, we tested the effect of FNT on both pre-adipocytes and mature adipocytes. Both pre-adipocytes and mature adipocytes were treated with different concentrations (100 pm, 10 nm, 1 µm) of FNT for 48 h. After treatment, the number of live cells was determined by MTT assay. Results show that 48 h of FNT treatment did not affect the viability of 3T3-L1 pre-adipocytes (Fig. 1(B)); however, FNT significantly decreased the cell viability of mature adipocytes at concentrations of 1 µm, 10 nm and 100 nm. The maximum cell viability decrease was found at 10 nm concentration, approximately 48 % (Fig. 1(C)), of FNT. To examine the effect of FNT on adipogenesis, 3T3-L1 cells were differentiated in the presence or absence of FNT from day 0 to 9. FNT treatment significantly inhibited lipid accumulation in mature 3T3-L1 adipocytes at concentrations of 100 pm, 10 nm and 1 µm, as shown in Fig. 1(D). Accumulation of ORO-stained lipid droplets was visible in most of the untreated control 3T3-L1 adipocytes (Fig. 1(D), upper panel); however, the number of detectable stained droplets decreased in the presence of FNT. Compared with the control, FNT decreased the percentage of adipogenesis by 36·2, 32·7 and 30·5 % at concentrations of 100 pm, 10 nm and 1 µm, respectively, as shown in the graph (Fig. 1(D), lower panel). As we found that FNT decreases cell viability in mature adipocytes, we examined whether the inhibitory effect of FNT could be related to apoptosis. We found that FNT has the ability to impede the process of adipogenesis by blocking the G1/S phase of the cell cycle; however, only a small population of cells (approximately 0·7 %) undergoes apoptosis after treatment with FNT (online Supplementary Fig. S1A). It is possible that decreased cell viability by FNT treatment may account for mitigation of cell proliferation rather than an apoptotic effect. For further experiments, 10 nm of FNT was used. Next, we investigated the expressions of C/EBPβ and C/EBPδ. The expressions of both genes increased during early stages of differentiation. FNT treatment for 48 h significantly reduced the expressions of C/EBPβ (P<0·05) and C/EBPδ (P<0·01) in differentiation-induced 3T3-L1 cells compared with control cells (Fig. 1(E)). Next, we differentiated 3T3-L1 cells with or without FNT for 9 d. The expressions of major adipogenic transcription markers PPARγ, C/EBPα and sterol regulatory element-binding protein (SREBP) were examined. We found that FNT treatment significantly reduced the expressions of all major transcription factors (P<0·001) (Fig. 1(F)), compared with non-treated cells. These data were also corroborated at the protein level (Fig. 1(G); online Supplementary Fig. S1C).
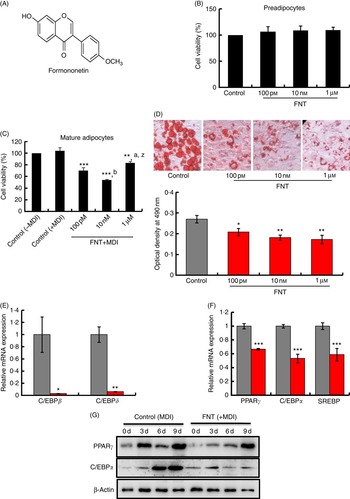
Fig. 1
(For figure see previous page) Effects of formononetin (FNT) on cell viability, lipid accumulation and adipogenic markers in 3T3-L1 pre-adipocytes. (A) Chemical structure of FNT. (B) 3T3-L1 pre-adipocytes were treated with indicated concentrations of FNT for 48 h. 3-(4,5-Dimethylthiazol-2-yl)-2,5-diphenyltetrazolium bromide (MTT) reagent was added to the medium. The absorbance was read at 570 nm. (C) Mature 3T3-L1 adipocytes were treated with or without FNT for 48 h, and MTT absorbance was read at 570 nm. (D) The morphological changes associated with cell differentiation were photographed after Oil Red O staining (upper panel), and stained lipids were extracted and quantified by measuring absorbance at 490 nm (lower panel). mRNA expressions of adipogenic markers (E) CCAAT/enhancer-binding protein beta (C/EBPβ) and C/EBPδ and (F) PPARγ, C/EBPα and sterol regulatory element-binding protein (SREBP). (G) Day-dependent expressions of PPARγ and C/EBPα were assessed by Western blotting. Results were obtained from three independent experiments in triplicate and are expressed as mean values with their standard errors, * P<0·05, ** P<0·01, *** P<0·001 v. control; a
P<0·05, 100 pm
v. 1 µm; b
P<0·01, 100 pm
v. 10 nm; z
P<0·001, 10 nm
v. 1 µm. E, F: ![]() , control;
, control; ![]() , FNT (10 nm).
, FNT (10 nm).
Formononetin induces reactive oxygen species generation and activates AMP-activated protein kinase/β-catenin signalling
We next investigated the mechanism behind the anti-adipogenic action of FNT. Several reports suggest an involvement of ROS in the signal transduction pathways leading to inhibition of lipid accumulation( Reference Hwang, Park and Shin 21 , Reference Findeisen, Pearson and Gizard 38 ). FNT treatment for 48 h significantly increased ROS generation (P<0·001), which was comparable with ROS induced by LPS, a positive control. Treatment with 10-mm NAC (a thiol-containing antioxidant) reduced ROS generation, whereas treatment with NAC and with FNT (10 nm) again increased ROS generation.
To examine whether AMPK is activated because of ROS generation induced by FNT, 3T3-L1 cells were treated with or without FNT up to 9 d, and AMPK activation was examined. Fig. 2(b) shows that the addition of FNT increased phosphorylation of AMPK day dependently, without affecting the protein level of AMPK, suggesting a direct regulatory role of FNT on AMPK activation in adipocytes. Along with AMPK activation, we also investigated whether the FNT-induced anti-adipogenic effect is β-catenin dependent. We found increased β-catenin levels in cells treated with FNT compared with controls (Fig. 2(b) and (c)). Nonetheless, there was an increase in phospho-GSK-3β (Ser-9) levels (Fig. 2(b) and (c)). Inhibition of a serine/threonine kinase, GSK-3β, is a critical event in β-catenin stabilisation and nuclear translocation. To confirm the stabilisation of β-catenin, we investigated the effect on upstream markers at transcriptional levels. mRNA expressions of Dickkopf-related protein-2 (DKK2), LDL receptor-related protein 5 (LRP5), Wnt-10b as well as β-catenin were examined. We found a significant decrease in the expression of DKK2 (P<0·01), 2·5-fold increase in the expression of LRP5, 2-fold increase in the expression of Wnt-10b and 5-fold increase in the expression of β-catenin (Fig. 3(a)). Immunofluorescence staining also revealed the increased nuclear localisation of β-catenin with FNT treatment, as shown in Fig. 3(b).
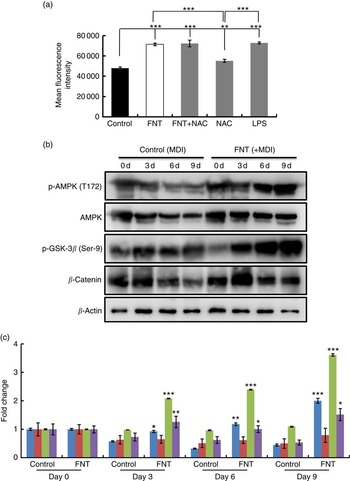
Fig. 2 Effect of FNT on reactive oxygen species (ROS) generation and AMP-activated protein kinase (AMPK) activation. Differentiated 3T3-L1 cells were treated with 10-nm formononetin (FNT), N-acetyl-l-cysteine (NAC) and lipopolysaccharide (LPS) for 48 h. (a) ROS generation induced by FNT. 3T3-L1 cells were treated with or without 10-nm FNT up to 9 d. (b) Day-dependent expressions of phospho-AMPK (p-AMPK) (T172), AMPK, phospho-glycogen synthase kinase-3β (p-GSK-3β) (Ser-9) and β-catenin by Western blotting. (c) Densitometric analyses of Western blot, showing fold change. Fold increase was calculated relative to control vehicle-treated cells. Results were obtained from three independent experiments in triplicate and are expressed as mean values with their standard errors. * P<0·05, ** P<0·01, *** P<0·001 v. the corresponding controls. ![]() , p-AMPK;
, p-AMPK; ![]() , AMPK;
, AMPK; ![]() , p-GSK-3β;
, p-GSK-3β; ![]() , β-catenin.
, β-catenin.

Fig. 3 Effect of formononetin (FNT) on wingless-related integration site (Wnt)/β-catenin signalling activators. Post-confluent 3T3-L1 pre-adipocytes were induced to differentiate in the absence or presence of FNT (added on day 0 of differentiation) for 9 d. (a) mRNA expressions of Wnt signaling-related molecules, Dickkopf-related protein-2 (DKK2), LDL receptor-related protein 5 (LRP5), wingless-related integration site-10b (Wnt-10b), β-catenin. (b) Nuclear localisation of β-catenin in the presence or absence of FNT. 3T3-L1 cells were treated with or without 10-nm FNT or compound C (Comp C) for 48 h. (c) Confirmation of AMP-activated protein kinase (AMPK) activation in the presence of inhibitor compound C, and protein expressions of phospho-AMPK (p-AMPK) (T172), AMPK, phospho-glycogen synthase kinase-3β (p-GSK-3β) (Ser-9), glycogen synthase kinase-3β (GSK-3β) and β-catenin; protein expression normalised with β-actin. (d) Densitometric analyses of Western blot showing fold change. Fold increase was calculated relative to control vehicle-treated cells. Results were obtained from three independent experiments in triplicate and are expressed as mean values with their standard errors. * P<0·05, ** P<0·01, *** P<0·001 v. the corresponding controls. a: ![]() , Control;
, Control; ![]() , FNT; d:
, FNT; d: ![]() , control;
, control; ![]() , FNT (MDI);
, FNT (MDI); ![]() , FNT (+MDI)+Comp C;
, FNT (+MDI)+Comp C; ![]() , MDI+Comp C.
, MDI+Comp C.
Next, to confirm whether the activation of AMPK was associated with β-catenin, we inhibited the expression of AMPK with compound C (6-[4-[2-(1-Piperidinyl) ethoxy] phenyl]-3-(4-pyridinyl) pyrazolo [1, 5-a] pyrimidine), a specific inhibitor of AMPK, and simultaneously checked the expression of β-catenin. There was a significant decrease in phosphorylated AMPK levels with decreased levels of β-catenin along with phosphorylated levels of Ser-9 GSK-3β residue (Fig. 3(c) and (d)). However, FNT treatment along with compound C restored their expressions (Fig. 3(c) and (d)).
Formononetin exerts in vivo anti-obesity effect
We next investigated in vivo the anti-obesity action of FNT in an HFD-induced obese mouse model. After 12 weeks, mice fed HFD showed higher body weights and more abdominal fat mass compared with mice fed a chow diet. Quantitative analysis of total body weight gain indicated a significant reduction in obesity in the HFD group supplemented with FNT compared with the HFD group. The average final weights of mice were reduced by approximately 18 % in the groups treated with 0·1, 1·0 and 10·0 mg/kg per d FNT (online Supplementary Fig. S3A). We did not observe any significant differences in food intake between the HFD group and the HFD supplemented with FNT groups (Table 1).
Table 1 Plasma biochemical parameters and food intake (Mean values with their standard errors; n 10 mice per group)
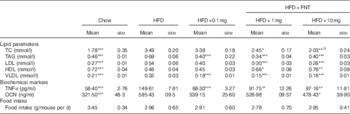
HFD, high-fat diet; FNT, formononetin; TC, total cholesterol; OCN, osteocalcin.
The mean value was significantly different from that of HFD group: * P<0·05, ** P<0·01, *** P<0·001, b P<0·01, when 10 mg/kg per d dose group was compared with 1 mg/kg per d dose group.
Measurement of adipose cells from H&E-stained tissue sections (Fig. 4(A)) revealed that FNT treatment along with HFD at all doses maintained the adipose cell sizes, comparable with the chow diet group, and rescued cells from hypertrophy. This decrease in hypertrophy of cells by FNT treatment in HFD animals was further confirmed by the decrease in the levels of PPARγ and C/EBPα at both transcriptional and translational levels in adipose tissue (Fig. 4(B) and (C)). FNT treatment of mice fed HFD also effectively down-regulated the expressions of TNFα and leptin at all the three doses (0·1, 1·0 and 10·0 mg/kg per d, respectively) (Fig. 4(B)). To investigate whether the anti-obesity effect of FNT is due to increased energy expenditure, we analysed the expressions of brown adipose tissue (BAT) markers. The main function of BAT is thermogenesis, which is mediated by up-regulation of uncoupling protein 1 (UCP1)( Reference Rothwell and Stock 39 , Reference Seale and Lazar 40 ). We found a significant increase in the expression of UCP1 in fat tissue of the HFD group treated with FNT at doses of 1 and 10 mg/kg per d (P<0·05) (Fig. 4(D)). Moreover, other markers of thermogenesis, elongation of very long-chain fatty acid (Elovl3) and deiodinase 2 (Dio2) were also found to be significantly increased in the HFD group treated with FNT at 1 (P<0·01) and 10 mg/kg per d doses (P<0·001), respectively, than the HFD group (Fig. 4(D)).

Fig. 4 Effects of formononetin (FNT) on high-fat diet (HFD)-induced obesity in C57BL/6 mice. (A) Haematoxylin–eosin staining of visceral white adipose tissue (WAT) (magnification 10×); the lower panel shows the quantitative analysis of adipocyte area using ImageJ software. (B) Real-time PCR (RT-PCR) analysis from WAT tissue of adipogenic markers and inflammatory markers – PPARγ, CCAAT/enhancer-binding protein alpha (C/EBPα), leptin and TNFα. (C) Expressions of PPARγ and C/EBPα in adipose tissue were assessed by Western blotting; (D) RT-PCR analysis of thermogenic genes, brown adipose tissue markers, uncoupling protein 1 (UCP1), elongation of very long-chain fatty acid (Elovl3) and deiodinase 2 (Dio2). Results were obtained from three independent experiments in triplicate and are expressed as mean values (n 5 mice/group), with their standard errors. * P<0·05, ** P<0·01, *** P<0·001 compared with the chow group. Scale bars represent 20 µm in (A). x
P<0·05, y
P<0·01, z
P<0·001, when 1·0 mg/kg per d dose compared with 0·1 mg/kg per d dose. p
P<0·05, r
P<0·001, when 10·0 mg/kg per d dose compared with 0·1 mg/kg per d dose. a
P<0·05, c
P<0·001, when 1·0 mg/kg per d dose compared with 10·0 mg/kg per d dose. ![]() , Chow;
, Chow; ![]() , HFD;
, HFD; ![]() , HFD+FNT.
, HFD+FNT.
Formononetin significantly improves biochemical parameters
Diet-induced obesity is accompanied by major changes in physiological and biochemical parameters( Reference Bhathena and Velasquez 41 , Reference Xiao, Cui and Li 42 ). At the end of the treatment, effects on plasma lipid parameters – TC, TAG, HDL, LDL, VLDL levels – were analysed, and are presented in Table 1. These data show that FNT significantly improved hyperlipidaemia and improved cholesterol metabolism. FNT-supplemented HFD mice showed a significant decrease in plasma TC by 3·24, 30 and 42 % at 0·1, 1·0 and 10 mg/kg per d doses, respectively, compared with HFD mice. Similarly TAG levels were decreased in the FNT-treated HFD group by 42·7, 51·41 and 42·44 % at 0·1, 1·0 and 10·0 mg/kg per d doses, respectively. Likewise, we observed changes in VLDL.
Next, we determined HDL and LDL levels in plasma. FNT treatment significantly increased HDL levels by 42·81 and 64·66 % at 1·0 and 10·0 mg/kg per d doses, respectively. LDL levels were robustly increased in HFD-fed animals (P<0·001), and FNT reduced LDL levels by 26·51, 44·8 and 51·49 % at 0·1, 1 and 10 mg/kg per d doses, respectively, compared with the HFD diet group (Table 1).
We further examined the effect of FNT on two other biochemical markers – TNFα and OCN. Higher TNFα levels correlated with adiposity and insulin resistance. FNT treatment in HFD-treated animals decreased circulating TNFα levels by 54·35, 38·67 and 35·06 % at 0·1, 1·0, 10·0 mg/kg per d doses, respectively (Table 1). Second, circulating levels of osteocalcin, which is regarded as a specific marker for bone turnover, were increased in HFD-fed animals (P<0·001), and FNT treatment significantly lowered the turnover at 10·0 mg/kg per d dose (P<0·05) (Table 1).
Formononetin restores high-fat diet-induced bone loss
As obesity-induced bone deterioration in HFD-fed mice( Reference Gautam, Choudhary and Khedgikar 4 ), we next investigated whether FNT could rescue mice from HFD-induced bone loss. Fig. 5(A) shows the dosing regimen in C57BL/6 mice supplemented with HFD as well as FNT orally for 12 weeks. After 12 weeks, we analysed the effect of HFD administration on bones through micro-computed tomography (µCT), as µCT is a high-resolution imaging modality that is capable of analysing bone structure with a voxel size in the order of 10 μm( Reference Campbell and Sophocleous 43 ). Fig. 5(B) shows the 3D structure of the femoral trabecular microarchitecture obtained using µCT imaging. HFD treatment for 12 weeks resulted in deterioration of trabecular bone microarchitecture, evident by measuring BV/TV of the distal femoral region that was decreased by 65 % in the HFD group compared with the chow group (Fig. 5(C)). FNT restored HFD-induced bone loss by increasing BV/TV by 62·6 and 109 % at 1 and 10 mg/kg per d doses, respectively, compared with the HFD group. Similarly, FNT increased Tb.Th at 10 mg/kg per d dose (P<0·001) and Tb.N at 1 and 10 mg/kg per d doses, respectively, compared with the HFD group (Fig. 5(D) and (E)). When we evaluated Tb.Sp, Tb.Pf and SMI, we found a significant decrease in the following factors at both 1 and 10 mg/kg per d doses, respectively, compared with the HFD diet (Fig. 5(F–H)). Similar patterns were observed in tibia as shown in Table 2.

Fig. 5 Formononetin (FNT) reverses high-fat diet (HFD)-induced bone loss in obese male mice. (A) Schematic representation of the experimental study. (B) Micro-computed tomography scanning of the right femur was performed, and three-dimensional images were constructed. Bone quality was evaluated by measuring trabecular bone parameters (C) bone volume to :tissue volume (BV:TV), (D) trabecular thickness (Tb.Th), (E) trabecular number (Tb.N), (F) trabecular separation (Tb.Sp), (G) trabecular pattern factor (Tb.Pf) and (H) the structure model index (SMI). Results were obtained from three independent experiments in triplicate and are expressed as mean values (n 10 mice/group), with their standard errors. * P<0·05, ** P<0·01, *** P<0·001 compared with chow group. b
P<0·01, when 10 mg/kg per d dose compared with 1 mg/kg per d dose. z
P<0·001, when 1 mg/kg per d dose compared with 0·1 mg/kg per d dose. r
P<0·001, when 10·0 mg/kg per d dose compared with 0·1 mg/kg per d dose. ![]() , Chow;
, Chow; ![]() , HFD;
, HFD; ![]() , HFD+FNT.
, HFD+FNT.
Table 2 Micro-architectural parameters of tibial metaphyseal region (Mean values with their standard errors; n 10 mice per group)
HFD, high-fat diet; FNT, formononetin; BV/TV, bone volume/tissue volume; Tb.Th, trabecular thickness; Tb.Sp, trabecular separation; Tb.N, trabecular number; Tb.Pf, trabecular pattern factor; SMI, structure model index.
Significantly different from that of HFD group: * P<0·05, ** P<0·01, *** P<0·001; b P<0·01, c P<0·001 when 10 mg/kg per d dose group compared with 1 mg/kg per d dose group.
We next assessed the dynamic histomorphometric parameters and mechanical strength of bone, as BFR and MAR evaluation might provide insight into the intracortical re-modelling rate. The data revealed about 48 and 45 % reduction in the MAR and BFR/BS in the HFD group, respectively. HFD mice supplemented with FNT, however, restored MAR by 35–70 % and BFR by 27–31 % compared with the HFD group (Table 3).
Table 3 Histomorphometry and Biomechanical strength of femur (Mean values with their standard errors; n 10 mice per group)
HFD, high-fat diet; FNT, formononetin; MAR, mineral apposition rate, pBFR/BS, peripheral bone formation rate/bone surface.
Significantly different from that of HFD group: * P<0·05, ** P<0·01, *** P<0·001; a P<0·05, when 10 mg/kg per d dose group was compared with 1 mg/kg per d dose group.
The three-point bending test was used to determine the mechanical properties of the midshaft femur, as shown in Table 3. HFD treatment for 3 months resulted in significant reduction in bone biomechanical strength as evidenced by approximately 41–42 % decrease in power, stiffness and energy compared with the chow group. HFD mice supplemented with FNT preserved bone biomechanical strength by showing increased maximal load (11–20 %), stiffness (63–86 %) and energy (41–71 %) compared with the HFD group.
Formononetin enhances osteogenic differentiation and decreases adipogenic differentiation of bone marrow stromal cells
To determine the changes in the number of osteoprogenitor cells and their osteogenic potential, after 12 weeks of dietary fat treatment, bone marrow stromal cells (BMSCs) from long bones of chow, HFD and HFD supplemented with FNT groups were isolated, and ex vivo cell cultures were performed. Fig. 6(A) shows that BMSCs from the FNT-treated HFD group significantly restored ALP activity at doses of 1·0 and 10·0 mg/kg per d, respectively (P<0·05), which was significantly decreased in the HFD-treated group compared with the chow group (P<0·01). The number of Alizarin-Red-stained Ca nodules, which represent the mineralising capability of the BMSCs as shown in Fig. 6(B), was decreased by approximately 50 % (P<0·05) in the HFD group compared with the chow group. FNT treatment at doses of 1·0 and 10·0 mg/kg per d restored the mineralising capability of BMSCs. To confirm the osteoprogenitor activity of BMSCs obtained from different groups, we analysed mRNA levels of osteoblast-specific markers, collagen type-1 (Col-1), RUNX2 and OCN, as shown in Fig. 6(C). FNT treatment along with HFD maximally increased the expression of Col-1 at 1 and 10 mg/kg per d doses (P<0·01), RUNX2 at 10 mg/kg per d dose (P<0·01) and OCN at all doses of FNT, respectively, compared with the HFD group. Fig. 6(D) shows differentiation in BMSCs towards the adipogenic lineage. Absorbance data of extracted ORO stain from the cells in the graph (right panel) show that there was about 34 % increase in adipogenesis in the HFD group compared with the chow group; however, FNT treatment dose-dependently inhibited adipogenesis at 0·1 (P<0·05), 1·0 (P<0·01) and 10·0 mg/kg per d (P<0·001). This was confirmed by analysing the expressions of adipocyte-specific markers such as PPARγ, C/EBPα and SREBP in differentiated BMSCs. Expressions of PPARγ, C/EBPα and SREBP were increased by 2-, 5- and 14-fold, respectively, in BMSCs differentiated to adipocytes in the HFD group, whereas FNT treatment significantly lowered their expressions at 0·1, 1 and 10 mg/kg per d doses (Fig. 6(E)).
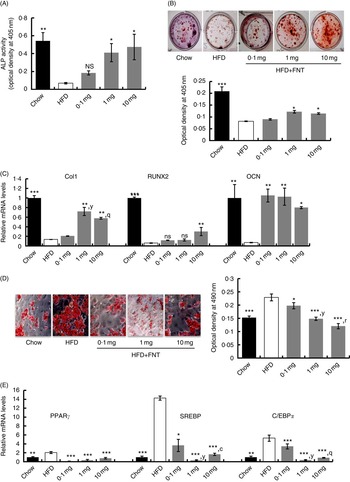
Fig. 6
(For figure see previous page) Formononetin (FNT) reverses high-fat diet (HFD)-induced commitment of bone marrow stromal cells (BMSCs). BMSCs were isolated from chow, HFD and FNT-supplemented with HFD groups and differentiated towards adipogenic and osteogenic lineage. (A) Alkaline phosphatase (ALP) activity was measured on the basis of absorbance at 405 nm (n 3; left panel). (B) Alizarin Red S staining (right upper panel) and quantification was performed by measuring absorbance at 405 nm (n 3; right lower panel). (C) mRNA expression of osteogenic markers collagen type-1 (Col1), runt-related transcription factor 2 (RUNX2) and osteocalcin (OCN) in BMSC. (D) Oil Red O staining (left panel). Quantification of Oil red O staining was performed by measuring absorbance at 590 nm (n 3; right panel) and (E) mRNA expressions of adipogenic markers PPARγ, CCAAT/enhancer-binding protein alpha (C/EBPα) and sterol regulatory element-binding protein (SREBP) in BMSC. Results were obtained from three independent experiments in triplicate and are expressed as means (n 5 mice/group), with their standard errors. * P<0·05, ** P<0·01, *** P<0·001 compared with chow group. y
P<0·01, when 1·0 mg/kg per d dose compared with 0·1 mg/kg per d dose. q
P<0·01,r
P<0·001, when 10·0 mg/kg per d dose compared with 0·1 mg/kg per d dose. c
P<0·001, when 1·0 mg/kg per d dose compared with 10·0 mg/kg per d dose. * P<0·05, ** P<0·01, *** P<0·001. ![]() , Chow;
, Chow; ![]() , HFD;
, HFD; ![]() , HFD+FNT.
, HFD+FNT.
Formononetin exerts anabolic and anti-resoptive action on bone
We next assessed the effect of 3 months of FNT treatment on the mRNA expressions of osteogenic, adipogenic and anti-resorptive genes directly in bones. Consistent with the results obtained from BMSC data, FNT treatment in HFD mice significantly restored the expressions of OCN at 10 mg/kg per d dose and osteopontin (OPN) at 1 and 10 mg/kg per d doses, respectively, which were decreased in the HFD group (P<0·001) compared with the chow group, as shown in Fig. 7(A).

Fig. 7 Effect of formononetin (FNT) on the expressions of osteogenic, adipogenic and resorptive genes in obese male mouse bone. Real-time PCR (RT-PCR) was performed on bone samples from the mice fed a normal diet and high-fat diet (HFD) with or without FNT. mRNA expressions of (A) PPARγ, osteocalcin (OCN), osteopontin (OPN) and resorptive genes, (B) receptor-activated NF-κB (RANK), tartarate-resistant acid phosphatase (TRAP) and (C) osteoprotegerin:RANK ligand (OPG:RANKL) ratio. The expressions of genes were normalised to that of glyceraldehyde 3-phosphate dehydrogenase (GAPDH). Results were obtained from three independent experiments in triplicate and are expressed as means (n 5 mice/group), with their standard errors. * P<0·05, ** P<0·01, *** P<0·001 compared with chow group. y
P<0·01, z
P<0·001, when 1·0 mg/kg per d dose compared with 0·1 mg/kg per d dose. q
P<0·01, r
P<0·001, when 10·0 mg/kg per d dose compared with 0·1 mg/kg per d dose. a
P<0·05, c
P<0·001, when 1·0 mg/kg per d dose compared with 10·0 mg/kg per d dose. ![]() , Chow;
, Chow; ![]() , HFD;
, HFD; ![]() , HFD+FNT.
, HFD+FNT.
PPARγ activation precludes osteogenesis and enhances the activation of haematopoietic stem cells, which give rise to osteoclasts; therefore, we checked the mRNA expression of the adipocyte-specific gene PPARγ, which was increased by 2·0-fold in the HFD v. the chow group, as shown in Fig. 7(A). FNT treatment in HFD-fed mice significantly decreased the expression levels of PPARγ in all dose groups (Fig. 7(A)).
These data show that expression levels of tartarate-resistant acid phosphatase (TRAP) and receptor-activated NF-κB, an osteoclast marker (RANK), were increased by 2- and 9-fold, respectively, in the HFD group; however, FNT treatment in HFD-fed mice showed a marked reduction in TRAP and RANK gene expression levels at 1·0 and 10·0 mg/kg per d (P<0·001) doses (Fig. 7(B)). Osteoblasts and osteoclasts have been reported to be regulated by the RANK ligand (RANKL) and osteoprotegerin (OPG) during bone modelling and re-modelling, respectively. Therefore, we examined the OPG:RANKL ratio. Notably, there was a decrease in the ratio in the HFD group compared with the chow group, whereas FNT significantly increased the OPG:RANKL ratio at 10 mg/kg per d dose, suggesting that FNT rescues bone loss, Fig. 7(C).
Discussion
Obesity and osteoporosis are prevalent in our society and pose a major challenge to the overall health and economy( Reference Lecka-Czernik and Stechschulte 44 ). There have been efforts to suppress obesity through pharmacological treatments. Many anti-obesity drugs that were initially approved by the United States Food and Drug Administration have since been withdrawn because of serious adverse effects, especially cardiovascular risks and minimal efficacy( Reference Rodgers, Tschop and Wilding 45 , Reference Heal, Gosden and Smith 46 ). Therefore, there is an imperative need to identify safer and more effective treatments to inhibit obesity in the long run. Recent studies have shown Wnt-ligands as potential therapeutic agents for obesity. A variety of naturally occurring flavonoids that are activators of the Wnt/β-catenin pathway( Reference Kushwaha, Khedgikar and Gautam 47 , Reference Liang, Yu and Lv 48 ) have been found to possess beneficial effects on health. Overall, natural compounds having anti-obesity and anti-osteoporotic effects have drawn attention because of their relative safety.
In the present study, we have identified FNT, an isoflavone, as an AMPK and β-catenin activator. The anti-adipogenic effect of FNT shows that it inhibits the differentiation of 3T3-L1 pre-adipocytes with down-regulation of key transcription factors, thus restoring metabolic alterations. 3T3-L1 cells proceed through two rounds of cell division as mitotic clonal expansion and then initiate the differentiation programme( Reference Tang, Otto and Lane 49 ). When the conversion from G1 to S stage takes place, C/EBPβ is hypophosphorylated and sequentially gets activated by glycogen synthase kinase-3β and MAPK, and finally both C/EBPβ and C/EBPδ directly induce the expressions of PPARγ and C/EBPα. FNT stopped the transition of cells from G1 to S stage with down-regulation of MAPK levels (online Supplementary Fig. S1) and decreased the expressions of PPARγ and C/EBPα.
Further, to obtain an insight into the anti-adipogenic activity, we found that FNT inhibited adipogenesis through ROS-induced AMPK activation. It has been studied that increased oxidative stress is responsible for the inhibition of adipogenesis during ageing( Reference Findeisen, Pearson and Gizard 38 ). Reports have already shown that ROS may activate the AMPK pathway. Some of the major isoflavones such as genistein, phytochemicals such as epigallocatechin gallate or capsaicin as well as 5-aminoimidazole-4-carboxamide ribonucleotide (AICAR), an analogue of AMP (AMPK activator), have been shown to suppress adipogenesis through AMPK activation and ROS generation( Reference Hwang, Park and Shin 21 , Reference Gautam, Kushwaha and Swarnkar 50 ). Likewise, we observed that FNT too activated the AMPK pathway via ROS generation and inhibited the adipogenic differentiation of 3T3-L1 cells. AMPK has a key role in the development of obesity. The metabolic syndrome, which is a cluster of related metabolic abnormalities including insulin resistance, abdominal obesity, hypertension and altered plasma lipids, especially hypertriacylglycerolaemia and low HDL-cholesterol, is potentially reversed by AMPK activation( Reference Hardie 51 ). Exercise is a best prevention tool for these altered physiological conditions, and it has been speculated that during exercise increase in AMPK phosphorylation is one of the major conviction( Reference Richter and Ruderman 52 ). In our study, we found FNT to be a potential activator of AMPK.
Further studies have documented that AMPK regulates cell differentiation via altering β-catenin expression( Reference Zhao, Yue and Zhu 8 ). Adipogenesis progresses through β-catenin-dependent or β-catenin-independent pathways, and some studies have shown β-catenin as an independent inhibitor of adipogenesis( Reference Zhao, Yue and Zhu 8 , Reference Zhao, Yue and Zhu 9 , Reference Cawthorn, Bree and Yao 19 ); therefore, we investigated the expression of β-catenin. FNT treatment stabilises the expression of β-catenin along with activation of AMPK. Next, we examined whether this β-catenin stabilisation was GSK-3β dependent, as Axin and adenomatous polyposis coli (APC) act as scaffolding proteins that facilitate GSK-3β to phosphorylate β-catenin( Reference Cawthorn, Bree and Yao 19 ). FNT increased the phosphorylation of GSK-3β (Ser-9), which rescued β-catenin degradation and increased its nuclear localisation. In addition to this, we also investigated whether FNT affects the Wnt target genes, as studies have shown a cross-relationship between AMPK and Wnt/β-catenin pathway( Reference Zhao, Yue and Zhu 9 , Reference Lee, Kang and Bae 53 ). Wnt-10b is a potent inhibitor of adipogenesis that must be suppressed for pre-adipocyte differentiation in vitro. We found that FNT treatment increased the transcriptional levels of Wnt-10b and nuclear accumulation of β-catenin. However, a deeper investigation is required to confirm the Wnt-pathway activation, as Ser-9 of GSK-3β is not regulated cells that are activated by Wnt or dishevelled( Reference Ding, Chen and McCormick 54 ). We majorly favour the involvement of AMPK and β-catenin in the anti-adipogenic activity of FNT. It is also possible that either FNT suppresses adipogenesis through independent actions of AMPK and β-catenin or through their cross-talk.
Our observations that FNT regulates AMPK and mediates anti-adipogenic effects via the β-catenin pathway have important physiological implications. AMPK has a central role in the regulation of energy metabolism and is regulated by numerous factors. In addition, AMPK is modulated by adipokines such as adiponectin and resistin and cytokines such as monocyte chemoattractant protein-1. We found that FNT modulated their expressions, as observed using the adipokine array (online Supplementary Fig. S3). This cross-talk of AMPK with the β-catenin pathway may exert long-term effects on tissue development and physiological functions, as both these signalling pathways are widely expressed in various tissues and conserved in the animal kingdom.
To further validate the effectiveness of FNT against obesity and the metabolic syndrome, we used an HFD-induced obese mouse model. HFD induces obesity in both humans and mice. FNT decreased total body weight of the C57BL/6 mice group on HFD. However, FNT did not decrease food intake; therefore, we sought to determine whether the anti-obesity effect of FNT is due to increased energy expenditure. As expected, we found increased expressions of thermogenic regulators such as UCP1, Elovl3 and Dio2 in the FNT-supplemented group. Mammals have two types of adipose tissue – one is white adipose tissue that specialises in lipid storage and undergoes pathological expansion during obesity, and the other is thermogenic BAT. BAT is a key thermogenic tissue in rodents and other small mammals, including newborn humans that defend core body temperature in cold weather( Reference Seale and Lazar 40 ). BAT evolved in mammals to dissipate large amounts of chemical energy as heat. Classic experiments in rodents have shown that BAT is activated and proliferates in response to over-feeding( Reference Rothwell and Stock 39 ). This so-called ‘diet-induced adaptive thermogenesis’ is an apparent compensatory mechanism to limit excess weight gain and obesity. Brown fat cells possess large numbers of mitochondria that contain a unique protein called UCP1( Reference Cannon and Nedergaard 55 ). With the help of UCP1, the energy in the mitochondrial electrochemical gradient is released in the form of heat( Reference Seale and Lazar 40 , Reference Cannon and Nedergaard 55 ). A therapy for weight loss must, therefore, involve a decrease in food intake and/or an increase in energy expenditure. In this case, FNT increased energy expenditure.
FNT effectively improved deregulated lipid levels in blood, aggravated by obesity and enlargement of adipose tissue by hypertrophy or hyperplasia. Obesity is also associated with low-grade chronic inflammation within fat tissue. TNFα, a pro-inflammatory marker expressed in and secreted by adipose tissue, is effectively suppressed by FNT in plasma and adipose tissue. Targeting TNFα and/or its receptors has been suggested as a promising treatment for insulin resistance and type 2 diabetes. We observed that FNT prevented fatty liver condition that abolished the concern of lipotoxicity (online Supplementary Fig. S2B) and suggests a possibility to develop an anti-obesity therapy without diet adjustments. Oestrogen depletion is one of the main causes of bone loss and osteoporosis; therefore, osteoporosis has been considered to be a female disease. However, our study indicates that abdominal fat is also an osteoporosis alarm for men( Reference Gautam, Choudhary and Khedgikar 4 ). Our present study focused on male mice, as males are more prone to obesity-induced bone loss. The bone loss induced by HFD was reversed by treatment with FNT as shown by µCT analysis. We found that FNT can be administered orally as a food supplement. Our data also show that FNT can inhibit the differentiation of pre-adipocytes. Thus, a small molecule that activates the AMPK/β-catenin pathway in this manner may represent a potential new class of anti-obesity supplements that can be easily administered.
Conclusion
In conclusion, our study demonstrates that the isoflavone FNT (1) has an anti-obesity effect in HFD-induced obese mice, (2) prevents obesity-induced bone loss, (3) activates the AMPK/β-catenin pathway and (4) increases energy expenditure via up-regulation of UCP1 under HFD conditions. These findings suggest that FNT has the potential to be a therapeutic for the treatment of obesity. We have validated the effect of FNT on an HFD-induced obesity mouse model as a representative model of human obesity.
Acknowledgements
The authors gratefully acknowledge generous funding from the Council of Scientific and Industrial Research (CSIR-BSC0201, ASTHI), Indian Council of Medical Research (ICMR), Department of Biotechnology (DBT), Government of India. The funders had no role in study design, data collection, data analysis or manuscript preparation.
Study conception and design: J. G., V. K., P. K., R. M., K. D., P. D., G. K. N., R. T; acquisition of data: J. G., P. K., V. K., D. C., G. K. N; analysis and interpretation of data: P. K., V. K., J. G., R. T; drafting of manuscript: J. G., R. T., D. S.; critical revision: P. D., R. M., D. S., P. K., V. K., D. C., J. G., R. T.
All authors declare no conflicts of interest.
Supplementary material
To view the supplementary material for this article, please visit https://doi.org/10.1017/S0007114517000149


