


Obesity is a worldwide health problem with an exponentially increasing prevalence among women of reproductive age in both developed and developing countries(Reference Chooi, Ding and Magkos1–Reference Ng, Fleming and Robinson4). Mexico is not an exception(Reference Barquera, Campos-Nonato and Hernandez-Barrera5), as the prevalence of overweight and obesity among women of childbearing age is 36·3 % and 38·5 %, respectively(6). This increase in occurrence is important since both human and animal studies have shown that in utero exposure to an obesogenic environment predisposes offspring to develop metabolic disorders such as obesity, insulin resistance, hyperinsulinemia, pro-inflammatory status and hyperlipidaemia in childhood and/or adulthood(Reference Catalano, Presley and Minium7–Reference Voerman, Santos and Patro Golab13). Several mechanisms, including changes in maternal metabolic hormones, impaired placental function, permanent organ or tissue structural changes, increase in oxidative stress, accelerated cellular aging and epigenetic alterations, have been proposed to link perinatal challenges with the development of diseases in adult life(Reference Rodriguez-Gonzalez, Castro-Rodriguez and Zambrano14,Reference Zambrano and Nathanielsz15) .
The Developmental Origins of Health and Disease concept is defined as the response to a specific challenge to the mammalian organism during a critical developmental time window that alters the trajectory of development with resulting effects on health that persist throughout life(Reference Zambrano and Nathanielsz15). Therefore, the nutritional supply to the fetus and/or newborn offspring is a key determinant that can affect an individual’s life-course metabolic homeostasis(Reference Barker16–Reference Nathanielsz18). The hypothalamus–adipose axis, which integrates peripheral insulin, leptin and nutritional information, probably plays a role in the programming of an individual’s metabolic pathways(Reference Breton17). During the perinatal period, for instance, rodents undergo active adipogenesis, beginning mostly in the final week of gestation, increasing in the early postnatal period and continuing after weaning. Consequently, the regulation of energy homoeostasis and adipocyte development are plastic and vulnerable to maternal stimuli, such as metabolic and nutritional factors, throughout these periods. Several studies demonstrate that maternal body composition at conception and during pregnancy and lactation has significant effects on the offspring’s adiposity(Reference Breton17). Studies on animals have clearly proven that maternal obesity (MO) increases offspring adult obesity and metabolic disorders(Reference Rodriguez-Gonzalez, Reyes-Castro and Bautista10,Reference Wankhade, Zhong and Kang19–Reference Zheng, Zhang and Gao21) ; furthermore, consumption of a HFD by offspring of obese mothers during their postnatal life enhances the metabolic dysfunction and influences the development of adipose tissue (size, diameter and number of adipocytes)(Reference Bariani, Correa and Dominguez Rubio22–Reference Sellayah, Thomas and Lanham25). Nonetheless, the effect of MO and postnatal HFD consumption on offspring adipocyte size (AS) distribution is an important question of physiological and clinical importance that remains to be elucidated.
Adipose tissue development plays a key role in metabolic homeostasis and is dependent on the establishment and maintenance of an appropriate adipocyte number and/or size(Reference Choe, Huh and Hwang26). Thus, abnormal changes in fat cell size are associated with metabolic impairment(Reference Palomaki, Koivukangas and Merilainen27). However, analysing the growth of adipose tissue has been challenging due to the heterogeneity of AS, which is not normally distributed. We have reported a mathematical model in which histological measures of AS were modelled using γ distribution(Reference Ibanez, Vazquez-Martinez and Leon-Contreras28). That approach showed that MO affects fat cell size distribution in the offspring’s retroperitoneal fat by decreasing the number of small adipocytes and increasing the proportion of large adipocytes. However, the effect of MO and postnatal consumption (second hit) of a HFD on offspring AS distribution has not been studied.
Adipocyte development is represented by a continuum of changes in AS distribution in which the proportions of small and large adipocytes have a physiological meaning(Reference Stenkula and Erlanson-Albertsson29). Small adipocytes are associated with proliferation(Reference Kajita, Mori and Kitada30). Impaired production of new small adipocytes limits fat storage capacity(Reference Stenkula and Erlanson-Albertsson29). In distinction, large adipocytes are linked with greater lipid storage(Reference Jo, Shreif and Periwal31) and are associated with pathophysiological conditions(Reference Stenkula and Erlanson-Albertsson29). Therefore, we sought to determine how programming by MO and its interaction with an offspring obesogenic diet affect hyperplasia and/or hypertrophy of retroperitoneal adipose cells.
We hypothesize that, in male offspring, postnatal HFD consumption following programming by MO acts as a second hit that exacerbates metabolic damage, fat accumulation and a decrease in the small and increase in the large adipocyte proportions programmed by MO.
Materials and methods
All procedures were approved by the Animal Experimentation Ethics Committee of the Instituto Nacional de Ciencias Médicas y Nutrición Salvador Zubirán (INCMNSZ), Mexico City, Mexico (ethical approval codes, UIO-1892, BRE-1868) and are consistent with the ARRIVE guidelines for reporting studies involving animals(Reference Grundy32,Reference Kilkenny, Browne and Cuthill33) . Female albino Wistar rats were born and maintained in the INCMNSZ animal facility, which is accredited by and adheres to the standards of the Association for Assessment and Accreditation of Laboratory Animal Care International (AAALAC). Rats were maintained under a 12-h light–dark cycle (lights on 07.00 to 19.00 h) at constant temperature (22–23°C) with food and water available ad libitum.
Offspring (F1) generation and maintenance
21-day-old female Wistar rats (F0) were randomly assigned to one of the two experimental groups: control (C) or MO group to be fed either a standard laboratory chow diet used in previous studies(Reference Rodriguez-Gonzalez, Reyes-Castro and Bautista10) (Zeigler Rodent RQ22–5) containing 22·0 % protein, 5·0 % fat, 31·0 % polysaccharide, 31·0 % simple sugars, 4·0 % fibre, 6·0 % minerals and 1·0 % vitamins (w/w), (physiological fuel 14·2 kJ g−1) or a HFD containing 23·5 % protein, 20·0 % lard, 5·0 % corn oil fat, 20·2 % polysaccharide, 20·2 % simple sugars, 5·0 % fibre, 5·0 % mineral mix, 1·0 % vitamin mix (w/w), (physiological fuel 20·1 kJ g−1). The HFD was produced in the specialised dietary facility of the INCMNSZ. This HFD has been used to induce weight gain in the mother and their offspring(Reference Rodriguez-Gonzalez, Reyes-Castro and Bautista10,Reference Vega, Reyes-Castro and Bautista12) . At the beginning of the study (21 d), F0 in both C and MO groups had similar body weights.
To produce F1, 120-day-old F0 females were bred with males from experimentally naive litters and continued to be fed with C or HFD throughout pregnancy and lactation. F0 consumes the HFD for 21 weeks from weaning until the end of lactation.
To ensure F1 homogeneity, on postnatal day (PND) 2, all F0 litters studied were adjusted to ten pups with equal numbers of males and females wherever possible. Litters with less than nine or more than fourteen pups were excluded from the study. F1 were weaned at PND 21 and males from C and MO groups were randomly selected to be fed with either C or HFD; we refer to the four groups of F1 born to C or MO mothers as C/C; C/HF, MO/C and MO/HF, representing maternal diet/offspring diet (Fig. 1). A maximum of three rats from the same experimental group were housed per cage. F1 consumed the HFD for around 16 weeks.

Fig. 1. Experiment design to induce obesity by maternal obesity programming and/or postnatal high-fat diet consumption in male offspring at 110 PND, n 8 per group from different litters. PND, postnatal day.
F1 measurement of food intake
Offspring food intake was measured for fifteen consecutive days between 95 and 110. A maximum of three rats from the same experimental group (C/C, C/HF, MO/C or MO/HF) were housed per cage. The amount of food provided each day was weighed, as was the amount remaining after 24 h. The amount of food consumed daily was averaged to provide a value per rat. Energy intake was obtained by multiplying food intake consumption by the energy density from C or HFD. Food intake and energy intake per rat are reported as the average of the 15 d.
F1 euthanasia
At PND 110, between 12.00 and 14.00 h and after 6 h of fasting, one F1 per litter (n 8) was killed by exsanguination via aortic puncture under general anaesthesia with isoflurane by the same individual under identical conditions. Blood was collected and fat depots located inside the thorax (mediastinal) and abdomen (omental, perirenal, retroperitoneal and epididymal) were excised and weighed to determine the adiposity index (AI). AI = total adipose tissue g × 100 × (body weight g)-¹. Retroperitoneal fat pad was fixed for histological analysis(Reference Ibanez, Vazquez-Martinez and Leon-Contreras28).
F1 blood measurements
Blood samples were centrifuged at 2880 RCF for 15 min at 4°C to remove red blood cells, and the serum was stored at –70°C until biochemical and hormonal analysis. Cholesterol, triglyceride and glucose were determined enzymatically using the auto analyzer Synchron CX (Beckman Coulter). Leptin, insulin, corticosterone and dehydroepiandrosterone (DHEA) serum concentrations were determined by ELISA using commercial rat kits from Invitrogen (cat #: KRC-2281), Millipore (cat #: E2RM1–13K), DRG International, Inc (cat #: EIA-4164) and DRG Instruments GmbH (cat #: EIA-3415) respectively(Reference Rodriguez-Gonzalez, Reyes-Castro and Bautista10), following the manufacturer’s instructions. Due to the size of sample obtained determinations were in singlicate in each F1. However, each group contained eight individual animals. Homeostatic model assessment for insulin resistance (HOMA-IR) was calculated from HOMA = (glucose (mmol/l) × insulin (μU/ml))/22·5(Reference Antunes, Elkfury and Jornada34). The DHEA/corticosterone ratio was calculated by dividing the DHEA and corticosterone concentrations. Intra- and inter-assay variabilities were < 5 and < 7 %, < 2 and < 8 %, < 3 and < 6 % and < 5 and < 12 % for leptin, insulin, corticosterone and DHEA, respectively.
F1 adipose tissue histology
The retroperitoneal fat pad samples were fixed in 10 % paraformaldehyde PBS 0·05M dehydrated and paraffin-embedded. Paraffin-embedded retroperitoneal fat 5 μm thickness sections were mounted on poly-l-lysine pre-coated slides after deparaffinization and rehydration slides were stained with haematoxylin and eosin(Reference Ibanez, Vazquez-Martinez and Leon-Contreras28,Reference Cardiff, Miller and Munn35) . Histology slides were analysed using a light microscope Olympus BX51 at 20 × magnification. AS was measured manually by delimiting the adipocyte cross-sectional area in digital images using AxioVisio LE software real 4·8 version (Zeiss® copyright 2006–2010) in at least 496 cells per group corresponding to an average of sixty-two cells per animal(Reference Ibanez, Vazquez-Martinez and Leon-Contreras28,Reference Lecoutre, Deracinois and Laborie36) . All histological measurements were performed by an observer-blind to the nature of the tissue source.
F1 adipocyte size distribution
Adipocyte size was measured as the cross-sectional area obtained in μm2. Histograms of relative frequency of 500 μm2-area intervals were overlaid with their corresponding representative γ distribution functions (GDF) and chi-square goodness-of-fit test was applied. AS distribution analysis based on GDF modelling was performed as previously reported(Reference Ibanez, Vazquez-Martinez and Leon-Contreras28). Briefly, GDF were modelled using parameter estimators of shape (α) and scale (β) calculated as α = (Mean AS/AS Standard Deviation)2 and β = (AS Standard Deviation)2/AS Mean; and plotted using the GAMMA.DIST function (Excel, Microsoft Office 365). Small and large adipocytes cut-off points were defined as the 10th and 90th percentile, respectively, from representative GDF of C/C groups as previously described(Reference Ibanez, Vazquez-Martinez and Leon-Contreras28), using GAMMA.INV function (Excel, Microsoft Office 365). Extreme AS proportions for each rat were calculated in individual GDF, as the cumulative probability below and above small and large AS cut-off points of C/C.
Statistical analysis
F1 physiological, biochemical and hormonal data are reported as mean ± sem, n 8 per group from different litters. Normality and equal variance were analysed by Shapiro–Wilk and Levine’s mean tests. To assess the statistical differences between maternal diet and postnatal offspring diet, normally distributed data were analysed using two-way multiple ANOVA, followed by Tukey test. Median AS was assessed by Kruskall–Wallis test and the cumulative AS between groups were compared by Kolmogorov–Smirnov test using GraphPad Prism 7·04 software. AS goodness-of-fit to γ distribution was assessed using EasyFit Professional 5·6 software. In the present study, the AS distribution (Kolmogorov–Smirnov test) and the proportions of small (MO/C: 4·26 v. C/C: 10 %, P < 0·001) and large (MO/C: 25·97 v. C/C: 10 %, P < 0·001) adipocytes were significantly different between C/C and MO/C (Mann–Whitney U test). Therefore, the effect of the postnatal HFD consumption on the proportions of small and large adipocytes between C/C and C/HF and MO/C and MO/HF were analysed using the same statistical test. These analyses were performed using Sigma Plot 11·0 software. Statistically significant differences were defined as P < 0·05.
Results
F0 body weight at the beginning of pregnancy
Maternal body weight was recorded before breeding and there was a significant difference between maternal groups (C: 294 ± 3·5 and MO: 363 ± 9 g, P < 0·001 by t test).
F1 food intake
Table 1 shows that both absolute food intake and energy intake per day were similar in C/C and MO/C. However, offspring weaned on a HFD consumed less food and less energy than their own control, albeit the reduction in food intake was significantly lower in C/HF than in MO/HF. Both food intake and energy intake showed an interaction between maternal diet and postnatal diet consumption.
Table 1. Food and energy intake in male offspring at 110 PND

PND, postnatal day; MO, maternal obesity.
Values are mean ± sem, n 8 rats per group from different litter. Within the same group (C/C v. C/HF and MO/C v. MO/HF), means labelled with different letters differ, P < 0·05.
* Different in comparison to the respective control (MO/C v. C/C and MO/HF v. C/HF), P < 0·05. Food intake and energy intake showed interaction between maternal diet and postnatal diet consumption, P < 0·0001.
F1 body weight and fat distribution
Body weight and total fat were similar between C/C and MO/C groups, whereas MO/C had a greater AI than C/C (Fig. 2(a)–(c)). Offspring weaned on a HFD had higher body weight, total fat and AI compared to their respective control (C/HF v. C/C and MO/HF v. MO/C); however, total fat and AI were higher in MO/HF than C/HF (Fig. 2(a)–(c)). Body weight, total fat and AI showed no interactions between maternal diet and postnatal diet consumption.
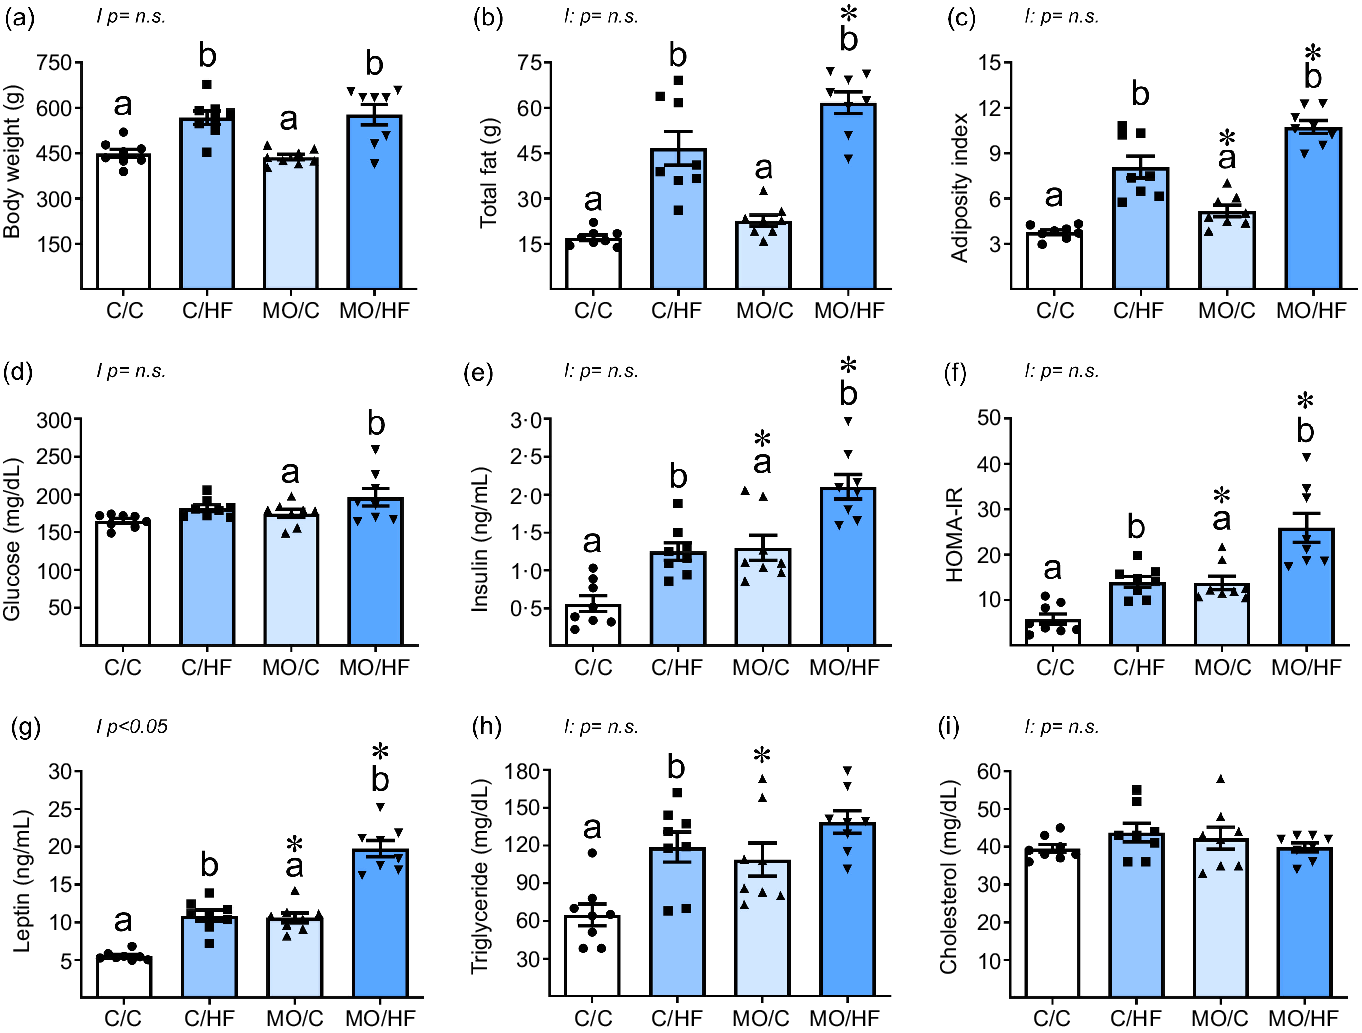
Fig. 2. Body weight, fat distribution and metabolic parameters in male offspring at 110 PND. (a) body weight, (b) total fat, (c) adiposity index, (d) glucose, (e) insulin, (f) HOMA-IR, (g) leptin, (h) triglyceride and (i) cholesterol. Values are mean ± sem, n 8 rats per group from different litter. Within the same group (C/C v. C/HF and MO/C v. MO/HF) means labelled with different letters differ, P < 0·05; *different in comparison to the respective control (MO/C v. C/C and MO/HF v. C/HF), P < 0·05. PND postnatal day, HOMA-IR, homeostatic model assessment for insulin resistance, MO maternal obesity.
All fat depots (mediastinal, retroperitoneal and perirenal, omental and epidydimal) were similar between C/C and MO/C groups, while postnatal consumption of HFD increased all fat depots in C/HF v. C/C and MO/HF v. MO/C (Table 2). Similar amounts of mediastinal and epidydimal fat were found in both MO/HF and C/HF groups. However, MO/HF exhibited much higher retroperitoneal and omental fat deposition than C/HF (Table 2). Fat depots showed no interactions.
Table 2. Fat distribution in male offspring at 110 PND

PND, postnatal day; MO, maternal obesity.
Values are mean ± sem, n 8 rats per group from different litter. Within the same group (C/C v. C/HF and MO/C v. MO/HF), means labelled with different letters differ, P < 0·05.
* Different in comparison to the respective control (MO/C v. C/C and MO/HF v. C/HF), P < 0·05. No interactions were observed between maternal diet and postnatal diet consumption.
F1 carbohydrate metabolism-related parameters
Serum glucose concentrations were similar among MO/C v. C/C and between C/HF v. C/C, but greater in MO/HF than MO/C (Fig. 2(d)). MO/C showed higher serum insulin concentrations and HOMA-IR than the C/C group. C/HF and MO/HF had greater insulin serum concentration and HOMA-IR than C/C and MO/C, respectively, although the rise in MO/HF was significantly greater than in C/HF (Fig. 2(e) and (f)). Serum glucose, insulin and HOMA–IR showed no interactions.
F1 lipid metabolism-related parameters
MO/C exhibited greater serum leptin concentrations than C/C; both C/HF and MO/HF had higher leptin concentrations when compared with C/C and MO/C, respectively (Fig. 2(g)). However, the rise in leptin in MO/HF was considerably greater than in C/HF. Serum leptin concentrations showed an interaction between maternal diet and postnatal diet consumption (Fig. 2(g)). The concentration of serum triglyceride was greater in MO/C than in C/C. HDF increased triglyceride concentrations only in C/HF v. C/C (Fig. 2(h)). There were no differences in serum cholesterol concentrations between groups (Fig. 2(i)). Serum triglyceride and cholesterol levels showed no interactions.
F1 steroid hormone concentrations
MO/C had greater serum corticosterone concentrations than C/C (Fig. 3(a)). HFD elevated serum corticosterone concentrations in C/HF and MO/HF compared to C/C and MO/C, respectively, although the rise in MO/HF was considerably higher than in C/HF; no interactions were observed (Fig. 3(a)). The concentration of DHEA was lower in MO/C compared to C/C, as well as in C/HF compared to C/C. Similar DHEA concentrations were observed in MO/C and MO/HF groups. DHEA concentration showed an interaction between maternal diet and postnatal diet intake (Fig. 3(b)). MO/C had a lower DHEA/corticosterone ratio than C/C. Postnatal consumption of a HFD decreased DHEA/corticosterone ratio in C/HF and MO/HF when compared with C/C and MO/C, respectively. However, the ratio decreased more in MO/HF than in C/HF; DHEA/corticosterone ratio showed an interaction between maternal diet and postnatal diet consumption (Fig. 3(c)).

Fig. 3. Steroid hormones in male offspring at 110 PND. (a) corticosterone, (b) DHEA and (c) DHEA: corticosterone ratio. Values are mean ± sem, n 8 rats per group from different litter. Within the same group (C/C v. C/HF and MO/C v. MO/HF) means labelled with different letters differ, P < 0·05; *different in comparison to the respective control (MO/C v. C/C and MO/HF v. C/HF), P < 0·05. PND, postnatal day; DHEA, dehydroepiandrosterone; MO, maternal obesity.
F1 adipocyte size distribution
The median AS was higher in MO/C than in C/C. Postnatal HFD consumption increased median AS in C/HF and MO/HF compared to C/C and MO/C, respectively; however, the rise in MO/HF was significantly higher than in C/HF (Fig. 4(a) and (b)). The cumulative AS distribution was wider in MO/C v. C/C (Fig. 4(c)), and the postnatal HFD spread the cumulative AS distribution in both C/HF and MO/HF in comparison to C/C and MO/C, although the data spreading was bigger in MO/HF than in C/HF (Fig. 4(d)–(f)). The relative frequency of small (MO/C: 4·26 v. C/C: 10 %, P < 0·001) and large (MO/C: 25·97 v. C/C: 10 %, P < 0·001) adipocytes differed significantly between the C/C and MO/C groups. HFD consumption decreased and increased the relative frequency of small and large adipocytes, respectively, in C/HF compared to C/C (Fig. 5(a) and (c)) and MO/HF v. MO/C (Fig. 5(b) and (d)), with the increase of large adipocytes being higher in MO/HF than in C/HF (Fig. 5(c) and (d)). In both C/HF and MO/HF, the proportion of small adipocytes was lower, whereas the proportion of large adipocytes was higher, compared to C/C (Table 3).

Fig. 4. Adipocyte size, data dispersion and cumulative relative frequency in retroperitoneal adipose tissue from male offspring at 110 PND. (a) mean adipocyte, (b) median adipocyte size with interquartile range, cumulative frequency in (c) MO/C v. C/C, (d) C/HF v. C/C, (e) MO/HF v. MO/C and (f) MO/HF v. C/HF. n 8 rats per group from different litter. Mean and median adipocyte size labelled with different letters differ (P < 0·05) by ANOVA and Kruskal–Wallis tests, respectively. Statistical differences between adipocyte size distributions (P < 0·001) by two sample Kolmogorov–Smirnov test. PND, postnatal day; MO, maternal obesity.

Fig. 5. Adipocyte size relative frequency in retroperitoneal adipose tissue from male offspring at 110 PND. (a) C/C, (b) MO/C, (c) C/HF, (d) MO/HF and (e) representative micrograph of retroperitoneal adipose tissue with H&E (20×). Significative differences *same group different postnatal diet (MO/HF v. MO/C; C/HF v. C/C, P < 0·001), #different group same postnatal diet (MO/C v. C/C; MO/HF v. C/HF, P < 0·001) by Mann–Whitney rank sum test, n 8/group. Small and large adipocytes cut-off points defined by the 10th and 90th percentile respectively, of C/C group modelled by γ distribution. PND, postnatal day; MO, maternal obesity.
Table 3. Small and large adipocyte proportions in retroperitoneal adipose tissue from male offspring at 110 PND

PND, postnatal day; MO, maternal obesity.
* Significative differences of same group with different postnatal diet (MO/HF v. MO/C; C/HF v. C/C, P < 0·001).
† Different group with same postnatal diet (MO/C v. C/C; MO/HF v. C/HF, P < 0·001) by Mann–Whitney rank sum test, n 8/group.
‡ Small and large adipocytes cut-off points defined by the 10th and 90th percentile, respectively, of C/C group modelled by γ distribution.
Discussion
Human and experimental animal models have shown that adverse intrauterine(Reference Barker16,Reference Armitage, Poston and Taylor37–Reference Hales and Barker42) and postnatal environment(Reference Bray and Popkin43–Reference Jequier46) have negative impact on the offspring’s health. MO predisposes offspring to metabolic dysfunction(Reference De Los Santos, Reyes-Castro and Coral-Vazquez8,Reference Rodriguez-Gonzalez, Reyes-Castro and Bautista10,Reference Vega, Reyes-Castro and Bautista12,Reference Nathanielsz18,Reference Williams, Seki and Vuguin20,Reference Gaillard, Felix and Duijts47–Reference Cervantes-Rodriguez, Martinez-Gomez and Cuevas51) ; however, postnatal lifestyle factors such as poor dietary patterns can interact with the programmed phenotype resulting from a specific developmental challenge constituting a second hit that exacerbates the programming outcomes on the offspring(Reference Parente, Aguila and Mandarim-de-Lacerda23,Reference Cervantes-Rodriguez, Martinez-Gomez and Cuevas51,Reference Souza-Mello, Mandarim-de-Lacerda and Aguila52) . We have reported that at 110 PND(Reference De Los Santos, Reyes-Castro and Coral-Vazquez8), male offspring of the C/HF and MO/HF had a significantly higher total fat mass and a significantly lower lean mass than male offspring of the C/C and MO/C groups(Reference De Los Santos, Reyes-Castro and Coral-Vazquez8). Additionally, there have been studies evaluating the effect of consuming a postnatal HFD on metabolic alterations in the offspring of obese mothers(Reference Bariani, Correa and Dominguez Rubio22,Reference Parente, Aguila and Mandarim-de-Lacerda23,Reference Sellayah, Thomas and Lanham25,Reference Elahi, Cagampang and Mukhtar53,Reference Hsu, Sheen and Lin54) . However, the effect of MO (first hit) and postnatal consumption of a HFD in the offspring (second hit) on AS distribution has not been studied.
The results from the present study show that offspring of obese mothers fed a postnatal HFD (MO/HF) had a greater AI, abdominal adipose tissue, insulin concentrations and insulin resistance index compared to C/HF and MO/C groups. Our findings are consistent with those of Bariani et al. (Reference Bariani, Correa and Dominguez Rubio22) who investigated whether MO combined with postnatal exposure to an obesogenic diet causes metabolic changes in offspring. They observed that if mice of obese mothers are fed a HFD, they had a higher body weight, increased abdominal adipose tissue and higher glucose and triglyceride concentrations than the control group. In addition, our findings are consistent with those of Hsu et al. (Reference Hsu, Sheen and Lin54) who observed that rats fed a postnatal HFD gained more weight in comparison to the control group. However, the offspring of obese mothers who were fed a postnatal HFD were the heaviest and presented peripheral insulin resistance in comparison to both the programming group and the group that only ate a HFD postnatally. Additionally, Parente et al. (Reference Parente, Aguila and Mandarim-de-Lacerda23) demonstrated that descendants of control rat dams fed a HFD postweaning, had high blood concentrations of glucose, insulin and leptin, as well as insulin/glucose and fat/body mass ratios and a greater AS in genital adipose tissue compared with their control group. However, the offspring that underwent programming by MO combined with a HFD had an even higher level of all these parameters (except for glucose and AS) than the programming group not exposed to the second hit. While Parente’s published metabolic findings and mean AS in genital adipose, our study focused on the distribution of AS in retroperitoneal fat.
Adipose tissue can expand by both hypertrophy and hyperplasia; the balance between these two mechanisms determines the lipid storage equilibrium. In rats, the expansion rate of fat depots varies depending on their location(Reference Ibanez, Vazquez-Martinez and Leon-Contreras28). For example, inguinal fat shows a high degree of hyperplasia, while mesenteric and epididymal fat depots show a high degree of hypertrophy(Reference DiGirolamo, Fine and Tagra55). In the present study, retroperitoneal fat tissue was chosen for analysis because this fat compartment is expanded by a balance of hyperplasia and hypertrophy, and its growth is associated with glucose and lipid metabolic imbalance(Reference Ibanez, Vazquez-Martinez and Leon-Contreras28,Reference Gabriely, Ma and Yang56,Reference Matsuzawa, Shimomura and Nakamura57) . Furthermore, it is well-known that excessive expansion of white adipose tissue such as retroperitoneal fat, is extremely dysfunctional. Ectopic fat deposition occurs when white adipose tissue fails to appropriately expand to store surplus energy(Reference Richard and White58). Additionally, retroperitoneal fat has a high inflammatory and immune capability which can lead to a pro-inflammatory state, the presence of more lipolysis and greater insulin resistance (Reference Hwang and Kim59,Reference Kusminski, Bickel and Scherer60) .
It is now recognised that the proportions of different ranges of AS, namely small, large and very large are indicators of the current metabolic state(Reference Jo, Shreif and Periwal31). Large adipocytes are associated with energy storage and small adipocytes with lower insulin resistance(Reference Stenkula and Erlanson-Albertsson29,Reference McLaughlin, Sherman and Tsao61) . In our model, the MO/C group exhibited a lower proportion of small adipocytes and an increase in large adipocytes suggesting a decreased adipose tissue expansion capacity. In MO/HF, the postnatal HFD diet consumption increased the proportion of large adipocytes resulting in impairment of adipogenesis indicated by the reduction of the proportion of small adipocytes (P = 0·065) in comparison with C/HF. These changes in AS distribution likely explain why the offspring of the MO/C group, despite having similar body weights and total fat as the C/C group, present higher HOMA-IR and develop hypertrophic obesity as evidenced by the presence of more large adipocytes. Therefore, the results from the present study will help to understand that metabolic heterogeneity among obese and non-obese individuals may be, at least in part, related to differential expansion of AS in the adipose tissue of different compartments and these variations may help explain why individuals with similar total adiposity exhibit dissimilarities in insulin sensitivity(Reference McLaughlin, Allison and Abbasi62,Reference McLaughlin, Lamendola and Coghlan63) .
The increased body weight, total fat and AS observed in the MO/HF group compared to the C/HF group could be due to the increased food and energy intake. These findings suggest that the MO/HF offspring developed a programmed addiction to food intake, which was triggered by the postnatal HFD consumption, since the MO/C group does not eat more than the C/C group. Other authors have referred to this preference for palatable food as addiction-like eating, implying that the hypothalamus and reward circuitry are dysregulated in terms of food intake(Reference Fukuhara, Nakajima and Sugimoto64).
Additionally, white adipose tissue secretes leptin, an adipokine that regulates body weight by reducing food intake and increasing energy expenditure(Reference Palhinha, Liechocki and Hottz65). We observed that despite high concentrations of leptin in offspring of the MO/C group, their food consumption (g/d) and energy intake (kcal/d) were similar than those of the C/C group. This outcome may be due to the fact that at the time of the study the rats were still young (110 PND) and had not yet developed leptin resistance. As a result, the offspring were still sensitive to this adipokine and could regulate their food intake(Reference Balland and Cowley66). Meanwhile, in C/HF and MO/HF, food and energy intake were lower in comparison to C/C and MO/C, respectively; but the consumption in MO/HF was significantly higher than C/HF. Therefore, the increases in leptin could be indicative of a more physiological role in C/HF since the higher serum leptin concentrations lead to lower food intake, while in the MO/HF group leptin has a predominantly pathogenic effect(Reference Kirk, Samuelsson and Argenton67,Reference Poher, Arsenijevic and Asrih68) .
It has also been observed that the hypothalamic–pituitary–adrenal axis is involved in obesity, as dysregulation of this axis can lead to an increase in fat mass, alterations in insulin sensitivity and glucose homeostasis, which are all obesity-related signs(Reference Bose, Olivan and Laferrere69,Reference Dallman, la Fleur and Pecoraro70) .
Supporting the above, we found that the male rats in the MO/HF group had the highest corticosterone concentrations compared to the other groups, which could exacerbate the harmful effects of the elevated insulin and leptin concentrations. Excess glucocorticoids have been related to carbohydrate dysregulation including obesity and diabetes(Reference Zambrano, Reyes-Castro and Rodriguez-Gonzalez71) whereas DHEA has been associated with a variety of metabolic benefits, including prevention of metabolic disorders such as obesity and diabetes, and also exhibits anti-aging properties(Reference Balazs, Schweizer and Frey72). DHEA declines with age in both men and women(Reference Zambrano, Reyes-Castro and Rodriguez-Gonzalez71). DHEA counteracts a variety of negative effects of excessive glucocorticoid action, for example, on visceral obesity and decreased insulin sensitivity in elderly individuals(Reference Balazs, Schweizer and Frey72). It has been shown that the high ratio of DHEA to corticosterone has anti-aging characteristics and can improve health outcomes(Reference Zambrano, Reyes-Castro and Rodriguez-Gonzalez71). Therefore, it is likely that the decrease in the ratio in the C/HF, MO/C and MO/HF groups is related to the occurrence of the metabolic syndrome.
In summary, our findings suggest that (1) MO/C offspring develop hypertrophic obesity as evidenced by an increased proportion of large adipocytes compared with C/C); (2) MO/C offspring exhibit a relatively hyperplastic obesity compared to the C/HF offspring, which are predominately hypertrophic; (3) in MO/HF, postnatal HFD consumption exacerbated the pre-existing fat accumulation and metabolic dysfunction found in MO/C group, including the decrease of small and the increase of large adipocytes, both of which are hypertrophic obesity characteristics (Fig. 6).

Fig. 6. Obesity phenotype in male offspring at 110 PND by maternal obesity programming and/or postnatal high-fat diet. PND, postnatal day.
In conclusion, MO before and during pregnancy and lactation, together with postnatal environmental factors, accentuates offspring body fat accumulation and increases the risk of greater metabolic dysfunction when compared to simple postnatally acquired obesity or programming by MO. These differences in AS help to explain why individuals with similar total adiposity exhibit dissimilarities in insulin sensitivity and fat metabolism.
Acknowledgements
We would like to thank Professor Peter W. Nathanielsz, MD, PhD, ScD, FRCOG, for his assistance in reviewing the manuscript and improving its presentation, structure and the English. DMS is a graduate student from Maestría en Ciencias Bioquímicas, Universidad Nacional Autónoma de México (UNAM) and is recipient of an extraordinary scholarship (52100461) from Coordinación General de Estudios de Posgrado, UNAM.
This work was supported by the Newton Fund RCUK-CONACyT (Research Councils UK – Consejo Nacional de Ciencia y Tecnología). I000/726/2016 FONCICYT/49/2016.
G. L. R.-G., S. D. L. S., D. M-S., L. A. R.-C. and C. A. I. researched data and data analysis. E. Z. study design. G. L. R.-G., P. C. and E. Z. preparation and review of manuscript. P. C. and E. Z. final approval of the manuscript. All authors have read and agreed to the published version of the manuscript.
The authors have declared that no competing interests exist.


