


Chronic inflammation is a central component of all the leading non-communicable causes of mortality globally, including CVD, diabetes, chronic obstructive pulmonary disease, cancer and dementia(Reference Stanaway, Afshin and Gakidou1,Reference Bennett, Reeves and Billman2) . Current evidence suggests that the alleviation of a chronic inflammatory response could delay the progression of non-communicable diseases (NCD)(Reference Koch3) and reduce all-cause mortality risk(Reference Proctor, McMillan and Horgan4). One intervention strategy towards reducing inflammation is to lower the inflammatory potential of diets.
The role of diet as a modulator of inflammation in the context of NCD has been thoroughly described. For example, anti-inflammatory diets characterised by high intakes of a variety of fruit and vegetables, plant-based protein sources and unsaturated fats have been associated with reduced risk of chronic inflammation and mortality(Reference Dinu, Pagliai and Casini5,Reference Ricker and Haas6) . On the other hand, pro-inflammatory diets characterised by low fibre, high sugar and high saturated fat have been associated with increased levels of pro-inflammatory cytokines and chronic inflammation(Reference Christ, Lauterbach and Latz7).
Indices such as the Dietary inflammatory index (DII®) were developed to quantify the inflammatory potential of whole diets in an attempt to move away from focusing on intakes of individual pro- or anti-inflammatory nutrients in isolation. The DII® has been updated twice since it was introduced in 2009(Reference Cavicchia, Steck and Hurley8), based on updated literature(Reference Shivappa, Steck and Hurley9) and then taking total energy intake into account in an energy-adjusted version of the DII® (E-DII(Reference Shivappa, Wirth and Hurley10)). Since its development, the DII® has been associated with numerous plasma inflammatory markers and several health outcomes(Reference Marx, Veronese and Kelly11).
Although these indices have been successfully used to determine the relationship between an individual’s diet and several health outcomes, less is known regarding the dietary inflammatory potential of African population groups whose dietary patterns and intakes differ from previous studies that have applied the DII®. Traditional African diets, which consist mainly of a monotonous dietary pattern of indigenous foods, are different from both Western and Mediterranean diets (for which most of the evidence exist) and need to be explored in relation to their inflammatory characteristics.
Within the context of South Africa, for example, the consumption of traditional African diets is varied, with more traditional intakes found in rural environments with a transition into Westernised dietary patterns observed in urban populations. Participants in the current investigation formed part of the Prospective Urban and Rural Epidemiology (PURE) study(Reference Teo, Chow and Vaz12), which specifically recruited and compared rural- and urban-living Black South Africans. Dietary intake in these groups was typically informed by their socio-economic status(Reference Dolman, Wentzel-Viljoen and Jerling13). Overall, rural participants followed a low energy, low fat diet whereas urban participants followed a more Westernised high energy, high-fat diet with marked increases in the variety of foods consumed(Reference Mchiza, Steyn and Hill14).
Understanding the functioning of widely used metrics, such as the DII®, is of particular importance in low- and middle-income countries where 85 % of the global NCD mortality burden is carried(15). The ‘nutritional transition’ that accompanies the urbanisation of low- and middle-income countries is often referred to as a key player in the increasing prevalence of NCD(Reference Wentzel-Viljoen, Lee and Laubscher16) in these regions. Understanding the applicability of the DII® in these populations is, therefore, crucial to investigating whether this increase in NCD can be explained by an increase in the inflammatory potential of the diet with urbanisation.
This article describes the application of an adapted E-DII to a South African context. We aim to describe the inflammatory potential of the diet of rural- and urban-living Black South Africans using an adapted version (AE-DII) of the E-DII(Reference Shivappa, Steck and Hurley9,Reference Shivappa, Wirth and Hurley10) . We hypothesised that the differences in the lifestyle and dietary patterns between these two groups would be reflected in their dietary inflammatory scores. In addition, we hypothesised that the AE-DII would be associated with several inflammatory and cardio-metabolic disease risk markers.
Methods
Study population
This is a cross-sectional investigation of 2010 Black South African adults residing in distinct rural or urban sites within the North-West Province (NWP) of South Africa (SA). These individuals took part in the baseline data collection of the PURE-NWP-SA study(Reference Teo, Chow and Vaz12,Reference Dolman, Wentzel-Viljoen and Jerling13) . Participants were eligible to participate if they were apparently healthy (not suffering from any acute or previously diagnosed chronic illness) and older than 30 years, at the time of study enrolment. With the exception of the availability of dietary recall data, no additional criteria were applied to inclusion in the current investigation. Participants with self-reported energy intake of more than 30 000 kJ (over-reporters) or fewer than 3000 kJ (under-reporters) were excluded from the analysis, resulting in a final cohort size of 1885(Reference Vorster, Kruger and Wentzel-Viljoen17).
Data collection
Data on socio-economic status, lifestyle (including smoking and alcohol consumption) and medication use were gathered using validated questionnaires filled out by participants under the guidance of qualified field workers. BMI was calculated from weight (measured to the nearest 0·01 kg) divided by height (as meters, measured to the nearest 0·1 cm) squared (kg/m2). The Omron HEM-757 (Omron Healthcare) was used to determine brachial systolic and diastolic blood pressure and heart rate. These measures were taken in the supine position after 5 min of rest, with the second of two measures recorded. Waist circumference (WC) was measured in cm using a Holtain unstretchable metal tape.
Dietary assessment
Trained field workers captured data regarding food consumption and dietary habits within the previous month using a validated quantitative FFQ specifically developed and tested for this population(Reference MacIntyre, Venter and Vorster18). Recall tools such as a culturally sensitive food-portion photograph book, utensils and plastic food replicates were also used(Reference Venter, MacIntyre and Vorster19). Food and nutrient intake data were coded according to the Medical Research Council’s Food Composition Tables (FCT)(Reference Wolmarans, Danster and Dalton20) and the amounts determined in grams, using the Medical Research Council Food Quantities Manual(Reference Langenhoven, Conradie and Wolmarans21). Household measures of food were converted to grams using standard tables(Reference Langenhoven, Conradie and Wolmarans21). Food intake and nutrient analyses were performed by the South African Medical Research Council at their Biostatistics Unit(Reference Wolmarans, Danster and Dalton20). The FCT are continuously updated to ensure accuracy and appropriate nutrient coverage(Reference Wolmarans, Danster and Dalton20).
AE-DII
The AE-DII, adapted for the PURE-NWP-SA participants, included thirty-seven of the forty-five suggested food parameters(Reference Shivappa, Steck and Hurley9). The following food components were excluded because they were not captured in the FCT or they were not consumed by the PURE-NWP-SA participants: eugenol, garlic, ginger, oregano, pepper, rosemary, saffron and turmeric. In accordance with prior investigations, two additional adaptions were made to the AE-DII calculation performed for this investigation(Reference van Woudenbergh, Theofylaktopoulou and Kuijsten22). Total fat was excluded, as the inclusion of individual fat components (PUFA and MUFA, trans- and saturated fat and cholesterol) collectively compensates for the contribution of total fat. Alcohol consumption data of participants who consumed more than 40 g of alcohol per day were excluded because of the prior evidence that consumption exceeding 40 g/d no longer exerts any anti-inflammatory effects(Reference van Woudenbergh, Theofylaktopoulou and Kuijsten22,Reference Imhof, Woodward and Doering23) .
The AE-DII was calculated in accordance with the published procedures(Reference Shivappa, Steck and Hurley9,Reference Shivappa, Wirth and Hurley10) . First, individual daily intake of each food/nutrient was standardised to represent a 1000 kcal (4180 kJ) total energy intake. Second, a z-score was computed by subtracting the cohort mean from each individual’s food/nutrient parameter and then dividing it by the cohort sd. To reduce the effect of right skewing, z-scores were expressed as cumulative proportions, and subsequently multiplied by two with one subtracted from the product. Resulting values for each food parameter were then multiplied by its parameter-specific inflammatory effect score, and summed to deliver an overall AE-DII measure for each participant. AE-DII scores are positively correlated to inflammatory potential; the higher an individual’s score, the higher their dietary inflammatory potential while negative scores indicate consumption of an anti-inflammatory diet(Reference Shivappa, Steck and Hurley9). The AE-DII adapted for the PURE-NWP-SA cohort spanned a theoretical range of –7·65 to +6·67.
Flavonoids
The following flavonoid subclasses were included in the calculation of the AE-DII: anthocyanidins, flavan-3-ol, flavanones, flavones, flavonols and isoflavones. Since the FCT does not include polyphenol content estimates, we determined the flavonoid content of the foods consumed by the PURE-NWP-SA participants, using the Phenol Explorer database(Reference Imhof, Woodward and Doering23). Phenol Explorer provides the content of flavonoid compounds for raw food, expressed as mg/100 g fresh weight. Therefore, for all raw and fresh foods, the flavonoid quantity for each food item was used as is. To calculate the flavonoid content for cooked or dried foods, the moisture content of the same fresh food, provided by the FCT, was subtracted from 100 to provide the remaining solid content for each food. The quantity of each flavonoid compound was summed for their respective subclasses (anthocyanidins, flavan-3-ol, flavanones, flavones, flavonols and isoflavones) to provide the total amount of each subclass specified in the AE-DII, for each food item.
Biochemical analysis
Fasting blood samples were collected from the antecubital vein between 07.00 and 11.00 and centrifuged at 2000 × g for 15 min within 30 min after collection and stored at –80°C until analysis. Plasma glucose (fluoride tubes) was quantified by a Vitros DT6011 Chemistry Analyser (Ortho-Clinical Diagnostics). Glycated Hb (HbA1c) was determined with the D-10 Hb testing system (Biorad, Hercules) from EDTA blood. Serum high-sensitivity C-reactive protein (hs-CRP), albumin, total cholesterol, HDL cholesterol (HDL-C), TAG, alanine transaminase (ALT), aspartate transaminase (AST), gamma-glutamyl transferase (GGT) and creatinine were quantified using the Konelab20i™ auto-analyser (Thermo Fischer Scientific). LDL cholesterol (LDL-C) was calculated using the Friedewald–Levy–Fredrickson formula(Reference Roberts24). Serum IL-6 was analysed through enzyme immunoassays (Elecsys 2010). Soluble urokinase-type plasminogen activator receptor was quantified using the suPARnostic® ELISA (ViroGates).
Statistical analyses
Statistical analyses were conducted using R 4.0.1(25). Data distribution was evaluated through visual inspection of histograms. Variables are expressed as mean ± sd or median (interquartile range) based on their distribution. As most of the data were skewed, non-parametric testing was used where appropriate. Log transformations were applied to skewed variables prior to linear modelling when residuals were not normally distributed. Regression coefficients for log-linear models were transformed [(e coefficient–1) × 100] and are reported as percentage change in outcome per unit change in predictor.
Mann–Whitney U tests were used to compare data between dichotomous sex, rural–urban status, smoking and alcohol consumption groups. Smoking and alcohol consumption status were dichotomised to ever and never users/consumers due to the small size of the former category represented in each. ANOVA and Tukey’s post hoc analysis were used when comparing differences in AE-DII predictors across AE-DII quartiles and aggregated sex rural–urban status groups. ANCOVA was used when comparing AE-DII quartiles and aggregated sex rural–urban status groups. Univariate linear regression models were performed to assess the associations of continuous AE-DII with various demographic and lifestyle predictors. Multivariable linear regression models were performed to determine the association between AE-DII and inflammatory and other cardio-metabolic risk markers. Primary models adjusted for conventional covariates including age, sex, rural–urban status, education, smoking status, as well as the use of aspirin or anti-inflammatory medication. Secondary models additionally adjusted for BMI (as a conventional covariate), alcohol consumption (g/d) (because it was capped at 40 g/d in the AE-DII calculation) and energy intake (which was normalised through the standardisation step) due to their associations with AE-DII scores in the PURE-NWP-SA cohort). Sensitivity analyses entailed removal of participants with potential acute inflammation, defined as CRP > 10 mg/l (n 525) and the use of an AE-DII score computed without a restriction on the contribution of alcohol consumption greater than 40 g/d. Reported results were robust to these sensitivity analyses, unless specified otherwise in the results text. A two-sided P < 0·05 denoted statistical significance in all analyses.
Results
The AE-DIIs in the PURE-NWP-SA cohort ranged from –3·71 to +5·08, spanning 61 % of the theoretical PURE-NWP-SA AE-DII range (–7·67 to +6·67). The mean cohort AE-DII was 0·37 ± 1·25, which indicates an overall mean pro-inflammatory diet. Demographic characteristics of the study cohort overall and stratified by AE-DII quartiles are reported in Table 1. A summary of the intake of specific pro- and anti-inflammatory dietary components in the full cohort and across AE-DII quartiles is reported in Supplemental Table 2.
Table 1 Demographic characteristics of the PURE-NWP-SA cohort overall and stratified by AE-DII quartiles

PURE, Prospective Urban and Rural Epidemiology; NWP, North-West Province; SA, South Africa; AE-DII, adjusted energy-adjusted dietary inflammatory index; IQR, inter quartile range.
Data are presented as median (interquartile range) or frequency.
* Percentage of individuals in each category.
† Only alcohol consumers included.
‡ Only alcohol consumers included, alcohol intakes > 40 g/d are excluded in accordance with the manner in which alcohol consumption was used in the AE-DII calculation.
Demographic and lifestyle predictors of the AE-DII
AE-DII scores were significantly higher in men (0·47 ± 1·19) than in women (0·32 ± 1·29, P = 0·01), and in rural (0·55 ± 1·29) than urban participants (0·21 ± 1·19, P < 0·001). This pattern is also observed in the higher proportion of male participants and rural dwellers across AE-DII categories when using univariate linear regression (P < 0·001). Age decreased across the quartiles, suggesting that older participants consumed a more anti-inflammatory diet. Average AE-DII scores decreased by 0·01 units per age year (P < 0·001). The percentage of educated participants decreased across the AE-DII quartiles. Although not evident across quartiles, a positive association was observed between daily energy consumption and continuously evaluated AE-DII scores (0·03-unit AE-DII higher per 1000 kJ, P = 0·01). Participants who had ever smoked or consumed alcohol had higher AE-DIIs (0·46 ± 1·24 and 0·40 ± 1·19) compared with those who had never smoked (0·26 ± 1·27, P = 0·001) or consumed alcohol (0·20 ± 1·29, P = 0·001). This association was also observed in the increased frequency of ever v. never users/consumers across quartiles (P < 0·001). When all predictor variables were simultaneously included in a regression model with continuous AE-DII as the outcome; age, rural–urban status, education, energy intake and alcohol consumption remained statistically significant predictors of AE-DII, while the contribution of sex and smoking status were attenuated. In this model, alcohol consumption was statistically the strongest single predictor of AE-DII, resulting in a 0·015 higher AE-DII per gram alcohol consumed. When alcohol consumption greater than 40 g/d was excluded (as done in the AE-DII score calculations), no across-quartile or linear associations between alcohol consumption and the AE-DII were observed.
Many of the non-nutrient predictors of the AE-DII were strongly influenced by rural–urban status and sex. A much higher proportion of rural (50 %) compared with urban (21 %) participants were uneducated, with both groups having more uneducated men than women. Conversely, urban dwellers, particularly men, were more likely to have smoked (58 %) or consumed alcohol (55 %) compared with their rural living (53 and 33 %) or female counterparts (see online supplementary material, Supplemental Table 2).
Urbanicity as a predictor of the AE-DII
When considered as an aggregated sex/rural–urban demographic status (Table 2), rural men consumed the most pro-inflammatory diet, followed by rural women (0·75 ± 1·25 and 0·44 ± 1·30). Although urban women consumed the most anti-inflammatory diet, their mean AE-DII (0·19 ± 1·26) was still reflective of a pro-inflammatory diet. Urban men consumed the highest energy (considered pro-inflammatory in the original DII®), followed by urban women. Increased energy intake was also reflected in urban participants reporting higher consumption of almost all food components compared with their rural counterparts. Rural women consumed the lowest daily energy, also reflected in having the lowest consumption of nineteen of the thirty-seven food components investigated.
Table 2 Comparison of daily AE-DII food parameter consumption in men and women of rural or urban status

PURE, Prospective Urban and Rural Epidemiology; NWP, North-West Province; SA, South Africa; AE-DII, adjusted energy-adjusted dietary inflammatory index; IQR, inter quartile range; RE, retinol.
Normally distributed variables are expressed as mean and sd. Not normally distributed variables are expressed as median and (25–75th percentiles).
* kJ (energy) is considered a pro-inflammatory component in the DII® although AE-DII calculations (as performed in the current investigation) standardise food parameter intakes according to energy and do not include energy as a separate pro-inflammatory component.
† Alcohol intake > 40 g/d was treated as a missing value.
‡ Compiled by adding intake of both rooibos and black tea.
§ Caffeine 68 mg/100 ml coffee; caffeine 20 mg/100 ml tea, brewed.
|| n-3 fatty acids compiled by summing C18_3, C18_4, C20_5, C22_5 and C22_6.
¶ n-6 fatty acids compiled by summing C18_2 and C20_4.
** Compiled by adding individual intake of onion (boiled), onion (raw), onion (sautéed in sunflower oil), spinach (Swiss Chard, cooked with potato, onion and sunflower oil), Green beans (cooked with potato, onion and sunflower oil), carrot (cooked with potato, onion and sunflower oil), cabbage (cooked with potato, onion and sunflower oil), chicken (with skin, stew, tomato and onion), fish (casserole low-fat fish, tomato and onion sauce), tomato and onion (stewed no sugar), tomato and onion (stewed with sugar), tomato and onion (canned), beef (mince lean, savoury tomato and onion), beef (corned, savoury, potato and onion) and weighted according to the onion concentration in the recipe.
All of the seven pro-inflammatory food components differed across the four sex/rural–urban status groups (P < 0·001). Sex and rural–urban differences were observed in relation to carbohydrate, protein, cholesterol and Fe consumption (Mann–Whitney U P-values < 0·01 for all) while rural–urban status, rather than sex drove the aggregated demographic associations with saturated fat, trans fat and vitamin B12 (P < 0·001 for rural–urban comparison, P > 0·05 for sex comparisons).
With the exception of flavones and tea, all anti-inflammatory food and nutrient parameters also differed across sex/rural–urban status groups (P < 0·001). Rural–urban status drove these associations for SFA, MUFA and PUFA, selenium, vitamins A, B12, C and E, n-3 fatty acids, anthocyanidin, flavon-3-ol, flavonols and onion (rural–urban comparisons, P < 0·001 v. P > 0·05 for sex comparisons). Inversely, differences among isoflavones in the sex/rural–urban status demographic were driven by sex as opposed to rural–urban differences (P < 0·001 v. 0·14 in rural-urban v. sex comparisons, respectively). Out of the twenty-eight anti-inflammatory food components, only caffeine was consumed in higher quantity in rural v. urban participants, while twenty-five of the anti-inflammatory food components were consumed in higher quantities by urban participants and, in particular, the urban men (highest consumption of all four groups in 19/28 food parameters).
The AE-DII in relation to inflammatory and cardio-metabolic risk markers
Table 3 summarises clinical markers of inflammation, cardio-metabolic risk and liver function across quartiles of the AE-DII scores in the PURE-NWP-SA cohort. Less than 1 % (n 12) and 27 % (n 507) of participants made intermittent use of anti-inflammatory medication and aspirin, respectively, at the time of data collection. The majority of the cohort was within the recommended healthy ranges for all risk markers, except for blood pressure (median systolic blood pressure/diastolic blood pressure: 130/87 mmHg).
Table 3 Clinical characteristics of the PURE-NWP-SA cohort overall and stratified by AE-DII quartiles
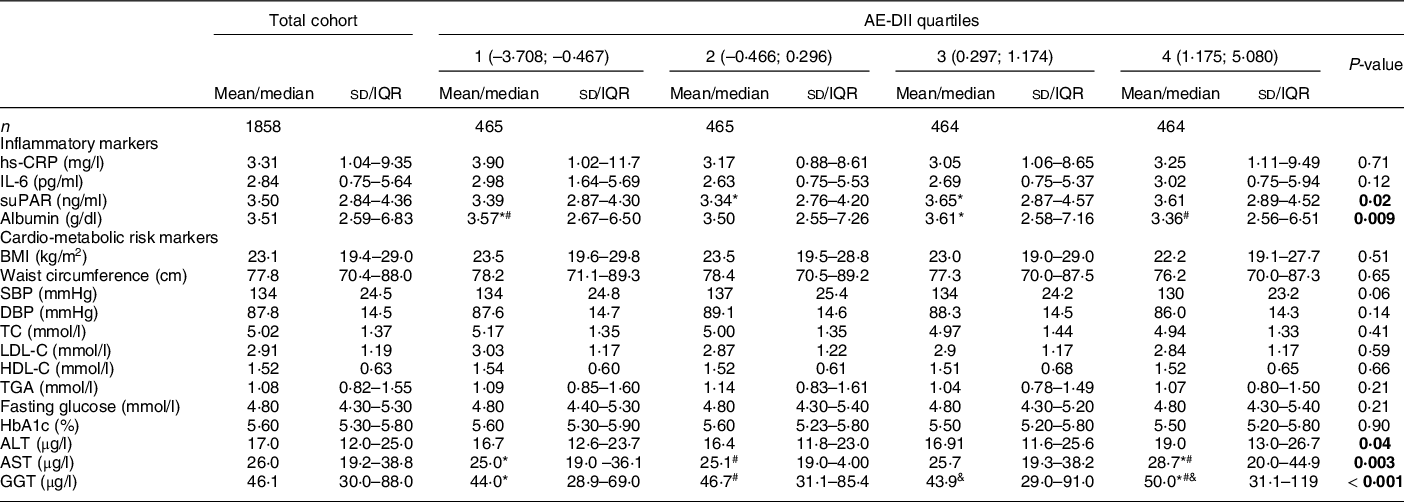
PURE, Prospective Urban and Rural Epidemiology; NWP, North-West Province; SA, South Africa; AE-DII, adjusted energy-adjusted dietary inflammatory index; IQR, inter quartile range; hs-CRP, high sensitivity C-reactive protein; suPAR, soluble urokinase-type plasminogen activator receptor; SBP, systolic blood pressure; DBP, diastolic blood pressure; TC, total cholesterol; LDL-C, LDL cholesterol; HDL-C, HDL cholesterol; HbA1c, glycated Hb; ALT, alanine transaminase; AST, aspartate transaminase; GGT, gamma-glutamyl transferase.
P-values: ANCOVA adjusted for age, sex, dwelling status, education, smoking status, anti-inflammatory medication and aspirin use. Statistically significant associations are indicated in bold text.
Normally distributed variables are expressed as mean and sd. Not normally distributed variables are expressed as median (25–75th percentiles).
*#&Quartiles with the same symbol differ significantly from each other upon covariate adjustment as indicated by Tukey post hoc tests.
Albumin and soluble urokinase-type plasminogen activator receptor, but not CRP or IL-6 concentrations differed across AE-DII quartiles upon covariate adjustment. In the regression models, only serum albumin was associated with continuous AE-DII scores (0·94 g/l lower albumin per one-unit higher AE-DII; P < 0·001). This association remained robust upon additional adjustment for BMI, energy intake and alcohol consumption (–0·77 g/l per one-unit higher AE-DII, P = 0·004).
With the exception of the indicators of liver function (ALT, AST and GGT), no cardio-metabolic risk markers differed across AE-DII quartiles. When investigated on a continuous scale, inverse associations between the AE-DII and several cardio-metabolic risk markers (BMI, systolic blood pressure, diastolic blood pressure, total cholesterol and LDL-C) were observed only prior to covariate adjustment. In contrast, HDL-C is associated with the AE-DII only upon covariate adjustment in the secondary model. A one-unit higher AE-DII was associated with a 0·05 mmol/l lower HDL-C (P < 0·001). This association remained significant when serum albumin (the only inflammatory biomarker associated with the AE-DII upon full adjustment) was additionally adjusted for (regression coefficient: –0·03, P = 0·005). Similarly, associations between the AE-DII and fasting glucose and WC were only observed upon full covariate adjustment, including additional adjustment for serum albumin. Each one-unit higher AE-DII was associated with a 0·54 cm higher WC and a 0·07 mmol/L higher fasting glucose, (P = 0·036 and 0·034).
Increases of 2·4, 3·7 and 5·8 % were observed in ALT, AST and GGT concentrations, respectively, for a one-unit higher AE-DII (P < 0·01 for all, upon primary covariate adjustment). Associations were also robust to additional adjustment for BMI, although adjustment for daily alcohol consumption resulted in a complete loss of statistical significance (P > 0·05 for all). No associations between the AE-DII and TG or HbA1c were observed.
Discussion
This is the first study to describe and compare the dietary inflammatory potential of rural and urban Black South Africans following a typical African diet, including its demographic and lifestyle predictors and its association with various inflammatory and other cardio-metabolic risk markers.
AE-DII in the PURE-NWP-SA cohort: the role of urbanicity
The dietary intakes reported by the PURE-NWP-SA cohort delivered AE-DIIs that spanned only 61 % of the theoretical range, emphasising the overall lack of diversity in dietary consumption. Dietary intakes differed between rural–urban status and sex. Urban participants consumed higher amounts of all nutrients with urban women consuming the most anti-inflammatory diet, followed by urban men. Rural participants had the most pro-inflammatory dietary pattern. Rural participants were furthermore less educated than urban participants, with lack of education itself being associated with a more pro-inflammatory diet. This is in agreement with Wirth et al. who report an inverse association between education and DII® in African Americans(Reference Wirth, Shivappa and Davis26).
Although energy intake was relatively low overall, both the rural and urban participant groups reached dietary reference ranges for their respective carbohydrate and protein intakes, through a high consumption of maize, bread and sugar, which are the most affordable staple food products in these communities(Reference Ronquest-Ross, Vink and Sigge27). These macronutrients also contribute to the AE-DII as pro-inflammatory parameters together with saturated and trans fat. Rural participants consumed the highest proportion of carbohydrates while urban participants consumed the highest proportion of proteins. Although urban men consumed the highest amounts of four of the seven pro-inflammatory components, they also consumed the highest amounts of the majority of the anti-inflammatory components, resulting in the average AE-DII still being more anti-inflammatory than those of the rural participants. Conversely, rural men, who had on average the most pro-inflammatory diet, did not have the highest intakes of any of the pro-inflammatory components, suggesting that their intake of the anti-inflammatory components was proportionally even lower than the intakes in the other three groups.
The observation that the most anti-inflammatory AE-DII score observed reached only about 50 % of the theoretical maximum anti-inflammatory potential, highlights the low consumption of anti-inflammatory AE-DII food parameters in particular. It has previously been reported that the PURE-NWP-SA cohort consumed, on average, less than half the daily recommended fruit and vegetable intake(Reference Dolman, Wentzel-Viljoen and Jerling13) which can, at least partly, account for the limited anti-inflammatory micronutrient representation. On average, participants in both the rural and urban groups reported consuming less than the recommended dietary reference intake for folate, magnesium, niacin, riboflavin, selenium, vitamin A, vitamin B6, vitamin C, vitamin D, vitamin E and zinc(Reference Wentzel-Viljoen, Lee and Laubscher16). These nutrients constitute eleven of the twenty-eight anti-inflammatory AE-DII components and are abundant in fruit and vegetables. The lack of fruit and vegetable consumption is largely attributed to their high cost and limited availability, particularly in rural areas(Reference Wentzel-Viljoen, Laubscher and Vorster28).
AE-DII in the PURE-NWP-SA cohort: the role of alcohol consumption
While alcohol intake is considered an anti-inflammatory component in the E-DII, this anti-inflammatory effect has been questioned for intakes in excess of 40 g/d(Reference Imhof, Woodward and Doering23), supporting the exclusion of excessive alcohol consumers from previous DII® investigations(Reference van Woudenbergh, Theofylaktopoulou and Kuijsten22). In agreement with this notion, in the PURE-NWP-SA population, the proportion of alcohol consumers as well as the amount of alcohol consumed increased across the AE-DII quartiles. Notably, the AE-DII scores investigated here were calculated without taking the alcohol consumption data of excessive drinkers into account (i.e. we omitted intake values > 40 g/d when calculating the AE-DII). The observation that the association between the AE-DII and alcohol intake was nullified when the 177 participants consuming more than 40 g of alcohol per day were removed from analysis, could suggest that the lifestyle associated with excessive drinking, e.g. smoking and level of education, rather than the ethanol content itself, predicts AE-DII scores. For example, the proportion of ever smokers dramatically increased across categories of alcohol consumption: non-drinkers (43 %), moderate drinkers (1–40 g/d, 71 %) and excessive drinkers (> 40 g/d, 79 %). A less dramatic, though similar pattern is also observed in terms of proportion of uneducated individuals (33 % v. 37 % v. 39 %). Lack of education and ever smoking status were both associated with adverse AE-DII scores in the PURE-NWP-SA. Similar observations of lower dietary quality in participants who smoke have previously been reported(Reference Alkerwi, Baydarlioglu and Sauvageot29,Reference Maisonneuve, Shivappa and Hébert30) .
While moderate alcohol consumption is often associated with a healthy lifestyle, such as observed in the Mediterranean diet, in this population it is clear that a number of participants consume excessive, rather than moderate, amounts of alcohol and that these individuals were also often smokers. These are more indicative of an unhealthy lifestyle which can contribute to a more pro-inflammatory diet and finally increase the likelihood of developing CVD.
It remains unclear to which degree the alcohol consumption data included in the DII® development process relied upon the preferential consumption of flavonoid-rich sources such as wines and spirits typically associated with the Mediterranean diet(Reference Hodge, Bassett and Shivappa31). Africans have, on the other hand, been reported to preferentially consume beer, including homebrewed rather than wine(Reference Trangenstein, Morojele and Lombard32). For this reason, the increased representation of African cohorts remains crucial as the seemingly contradictory observations presented here might emanate from the variable sources of ethanol preferred among and available to various communities. In addition, because of alcohol’s inclusion in the DII® itself, limited data where alcohol consumption was explored beyond its incorporation in the calculated score exist. In the PURE-NWP-SA cohort, alcohol consumption was significantly associated with most AE-DII components upon adjustment for energy. Although alcohol consumption is negatively associated with pro-inflammatory AE-DII parameters and positively with numerous anti-inflammatory markers, it is also associated negatively with a number of anti-inflammatory AE-DII parameters including MUFA and PUFA, n-6 fatty acid, fibre and β-carotene (data not shown, adjusted r < –0·23, P < 0·001). Further research is warranted to determine whether different parameter-specific inflammatory effect scores should be allocated to moderate (anti-inflammatory) and excessive (pro-inflammatory) alcohol consumption.
The AE-DII as a predictor of inflammation
Contrary to our hypothesis, apart from its association with albumin, AE-DII scores did not significantly predict inflammatory status in the PURE-NWP-SA cohort. The lack of association between the AE-DII and inflammatory markers in the PURE-NWP-SA cohort may be attributed to the limited variation in inflammatory potential represented by the AE-DII scores. Although the mean cohort AE-DII was indicative of a pro-inflammatory diet, it remains close to a null effect AE-DII (AE-DII≈0). Dietary consumption was therefore likely not sufficiently pro- or anti-inflammatory to modify serum inflammatory marker levels. While construct validation(Reference Wirth, Shivappa and Davis26,Reference Tabung, Steck and Zhang33) and other studies(Reference Shivappa, Wirth and Hurley10,Reference Wirth, Sevoyan and Hofseth34–Reference Shivappa, Wirth and Murphy37) demonstrated an association between the DII® and inflammatory markers, a number of studies also reported no association or found associations with only some but not all inflammatory markers(Reference Wirth, Shivappa and Davis26,Reference Tabung, Steck and Zhang33,Reference Shivappa, Hebert and Marcos38–Reference Wirth, Burch and Shivappa40) . Furthermore, several studies found no association between the DII® and CRP or IL-6 as a continuous variable and only report associations for dichotomised outcomes (CRP > 3 mg/l or IL-6 > 1·6 pg/ml)(Reference Cavicchia, Steck and Hurley8,Reference Tabung, Steck and Zhang33,Reference Wirth, Burch and Shivappa40) .
Low albumin concentrations have previously been used as indicators of low-grade systemic inflammation(Reference Soeters, Wolfe and Shenkin41). In the PURE-NWP-SA cohort, the negative AE-DII-albumin association could therefore be indicative of an association with low-grade chronic rather than acute inflammation. C-reactive protein, soluble urokinase-type plasminogen activator receptor and IL-6 concentrations are often used to characterise an acute inflammatory state(Reference Koch, Voigt and Kruschinski42,Reference Gabay and Kushner43) , explaining why, in the case of the PURE-NWP-SA cohort, these markers as opposed to albumin, did not significantly associate with the AE-DII. We have previously demonstrated that the PURE-NWP-SA cohort has high levels of acute inflammatory markers (e.g. a median CRP of 3·31 mg/l and IL-6 of 2·84 pg/ml, Table 3). Myburgh et al. identified a number of factors, other than diet, that were significantly associated with CRP specifically, such as age, socio-economic status, genetics and infectious diseases, thus potentially diluting the contribution of the inflammatory potential of the diet(Reference Myburgh44).
The AE-DII in relation to cardio-metabolic risk markers
The AE-DII was significantly associated with three of the cardio-metabolic risk markers investigated in this study: HDL-C, fasting glucose and WC. These associations were in line with prior findings(Reference Phillips, Shivappa and Hébert35,Reference Wirth, Burch and Shivappa40) and seemed to be mediated by inflammation (represented by albumin) as the associations were strengthened (HDL-C) or became significant (fasting glucose and WC) upon adjustment for albumin.
Insulin resistance has been suggested as the main mechanism behind the association of E-DII with glucose as low-grade chronic inflammation associates with the intracellular signalling pathways that are involved in the regulation of insulin(Reference White45). Inhibition of these signalling pathways through inflammation results in insulin resistance(Reference Hotamisligil, Peraldi and Budavari46), which could be the cause of increased fasting glucose concentrations. Furthermore, increased fasting blood glucose concentrations may be attributed to low dietary fibre intake. The mean fibre intake for this cohort was 21·7 g which is below the Dietary Reference Intake for both men (38 g) and women (25 g)(Reference Escott-Stump and Mahan47). Dietary fibre delays the absorption of glucose which consequently reduces fasting blood glucose and insulin levels(Reference McRae48).
In terms of markers of liver function, positive associations between the AE-DII, GGT, ALT and AST were observed. As opposed to prior observations(Reference Darbandi, Hamzeh and Ayenepour49,Reference Vahid, Shivappa and Hekmatdoost50) , the AE-DII was not associated with increased GGT, AST and ALT levels in the PURE-NWP-SA population through the pathway of obesity/fatty liver disease, as the associations remained after adjustment. Instead the associations appear, at least in part, to be related to alcohol consumption, as adjustment therefore nullified the association between the AE-DII and the liver enzymes. Alcohol consumption is known to affect liver enzyme concentrations, with GGT being the most susceptible to its effects(Reference Salaspuro51). GGT increases with alcohol intake(Reference Teschke and Koch52) and can be used to verify reported alcohol intake(Reference Anttila, Järvi and Latvala53–Reference Keating, Cheung and Peters55). These findings suggest that, while the final calculated inflammatory index of the diet is positively associated with liver enzymes, the factors contributing to the final AE-DII score of a participant in this population probably differ from those in more affluent Western populations. These differences are likely anchored in the overall low intakes of food components and total energy as reflected by intakes of a number of components being lower than the recommended ranges, as well as the monotonous nature of the diet consumed and the observed high use of alcohol and tobacco.
Limitations
Although this study did not set out to investigate disease incidence or causality, the cross-sectional nature of the data limited any option to do so. The limited variety in the PURE-NWP-SA participants’ diet as well as the monotonous dietary pattern observed in this study population can contribute to poor associations between the AE-DII and inflammation. This is not a limitation of this study per se, but rather highlights the lack of availability of population-specific dietary indicators. In the same vein, the available computational tools for flavonoid quantification do not allow for the inclusion of rooibos tea rich in flavonols and flavan-3-ol, which is the most frequently consumed tea in this cohort and in South Africa. We were however, able to partially account for rooibos tea’s beneficial properties by including it in the tea AE-DII component. In addition, we used our own population’s mean and sd dietary intake rather than the energy-adjusted global comparative database to standardise intakes. This prohibits direct comparison with published E-DII data. Finally, we were unable to investigate alcohol consumption patterns in this study due to the nature of a recall dietary questionnaire that reports alcohol consumption as average intake per day. Taking patterns such as binge drinking into account could have further elucidated the role of alcohol consumption in the AE-DII.
Conclusion
This study described, for the first time, the inflammatory potential of a typical South African diet consumed by continental Africans residing in distinct rural and urban sites. Overall, more pro-inflammatory food components and nutrients were consumed in proportionally higher quantities than anti-inflammatory components, resulting in a pro-inflammatory average AE-DII in the PURE-NWP-SA cohort. Urban women followed the most anti-inflammatory diet and rural men the most pro-inflammatory diet. The diet of the participants was not overtly pro- or anti-inflammatory and therefore had little effect on the inflammatory markers. Our data also demonstrate that the inflammatory potential of alcohol at different levels of intake requires further research. The results of this study highlight the need to better understand the role of the inflammatory potential of the diet in the context of food insecurity, unhealthy lifestyle practices and increased risk for NCD, all of which are highly prevalent in developing countries such as South Africa.
Acknowledgement
Acknowledgements: The authors would like to thank all members who participated in the PURE-NWP-SA study and staff members who made the PURE-NWP-SA study possible, including the fieldworkers (particularly fieldworkers who captured and handled all dietary data), researchers and staff of both the PURE-NWP-SA (Africa Unit for Transdisciplinary Health Research, Faculty of Health Sciences, NWU, Potchefstroom, South Africa). They also want to thank PURE International (S Yusuf and the PURE project office staff at the Population Health Research Institute, Hamilton Health Sciences and McMaster University, Ontario, Canada) teams. Financial support: The PURE-SA-NW study was funded by the North-West University, South African National Research Foundation (SANRF), Population Health Research Institute, South African Medical Research Council (SAMRC), the North West Province Health Department and the South African Netherlands Partnerships in Development. HTC is supported by the Novo Nordisk Fonden Challenge Programme: Harnessing the Power of Big Data to Address the Societal Challenge of Aging [NNF17OC0027812]. Funding bodies were not involved in the design of the study, collection, analysis or interpretation of the data or in writing of this manuscript. Opinions expressed and conclusions arrived at are those of the authors and are not to be attributed to the funding sources. Authorship: M.F. performed the data analysis with H.T.C. M.F. wrote the manuscript with H.T.C. M.P. conceptualised the study. M.P., T.V.Z. and N.P.B. supervised the data analysis and interpreted the results with M.F. and H.T.C. All authors contributed to the critical review and editing of the final manuscript. Ethics of human subject participation: This study was conducted according to the guidelines laid down in the Declaration of Helsinki and all procedures involving research study participants were approved by the Health Research Ethics Committee of the North-West University (NWU-00016-10-A1, NWU-00034-17-A1-02). Written informed consent was obtained from all subjects/patients.
Conflict of interest:
None of the authors have any conflict of interest to declare.
Supplementary material
For supplementary material/s referred to in this article, please visit https://doi.org/10.1017/S136898002100505X


 Open access