


Access to improved water sources, such as hand-pumps or other technology designed to protect against fecal contamination, continues to be a critical public health problem among rural indigenous populations in low-income countries( 1 ). To complement this need, the present study examines how individuals use local environmental resources to acquire water and the resulting health consequences( Reference Vargas 2 ). Dietary flexibility serves as an adaptation to environmental constraints and relates to variation in nutrition, health and disease patterns( Reference Pelto, Goodman and Dufour 3 , Reference Stinson 4 ). Human populations have long used behaviours and food processing techniques as culturally integrated buffers that reduce toxicity and increase the digestibility and nutrients of food, such as the 10 d processing of bitter manioc( Reference Dufour 5 ), corn alkali processing to reduce niacin deficiency( Reference Katz 6 ) and fire and cooking( Reference Ungar, Grine and Teaford 7 ). Likewise, researchers hypothesize that people have historically used dietary strategies to flexibly meet their water needs, such as eating fruits when water is unavailable or using beer, gruel or cider fermentation to render dirty water drinkable and potentially medicinal( Reference McClatchey and Reedy 8 , Reference Nelson, Dinardo and Hochberg 9 ). In the present paper we describe hydration strategies, or a person’s daily water intake derived through a spectrum of foods and liquids, among a sample of adult Tsimane’ forager-horticulturalists living in the Bolivian Amazon. We then examine the relationship between different hydration strategies and reported symptoms of gastrointestinal (GI) illness. The paper focuses on Tsimane’ because they lack access to clean water, yet are highly active and live in a hot, humid environment, creating high water needs. Additionally, previous research has documented high prevalences of water-related diarrhoeal diseases and parasitic infection( Reference Blackwell, Martin and Kaplan 10 , Reference Tanner, Rosinger and Leonard 11 ).
Water recommendations and cross-cultural strategies
Water is an essential nutrient comprising 40 to 65 % of total body weight. Because human water needs exceed the body’s ability to produce it( Reference Jequier and Constant 12 ), obtaining enough water on a daily basis is critical to physiological and cognitive health( Reference Murray 13 ). Therefore, in addition to the metabolic process of oxidation (~250 ml/d)( Reference Vivanti 14 ), people consume water from various sources including liquids (plain and raw water and other beverages) and foods. In the present paper ‘raw water’ refers to natural, untreated water; ‘plain water’ refers to treated, drinking water; and ‘water’ refers to physiologically available water within foods or liquids.
Daily water intake recommendations are based on several sources. The US Institute of Medicine (IOM) has set Adequate Intake (AI) levels, or experimentally derived values expected to meet nutritional adequacy for moderately active individuals in a healthy population, of 3·7 litres for men and 2·7 litres for women daily( 15 ). The European Safety Food Authority (ESFA) recommends lower daily water intake at 2·5 litres and 2·0 litres for men and women( 16 ). Both of these recommendations rely on average intakes from national nutritional studies as well as water turnover studies and note that recommended intake levels vary with body size, activity levels, metabolism, clothing, temperature, illness, and pregnant and lactating status( Reference Sawka, Cheuvront and Carter 17 ). For a detailed commentary of the evidence behind the IOM’s AI, see Sawka et al.( Reference Sawka, Cheuvront and Carter 17 ). These recommendations have been critiqued for not distinguishing between sources of hydration (e.g. between water from sugar-sweetened beverages and plain water, tea and coffee) and not emphasizing the water potential of foods( Reference Popkin, Armstrong and Bray 18 , Reference Tsindos 19 ). Recently, research has called for studies to document water intake in cross-cultural settings to substantiate AI recommendations( Reference Armstrong 20 ).
Comparative research demonstrates slight differences in total water intake across countries as well as worldwide differences in hydration strategies depending on local ecology and food culture( Reference de Garine and de Garine 21 – Reference Paque 23 ). Using the US National Health and Nutrition Examination Surveys (NHANES), Kant et al.( Reference Kant, Graubard and Atchison 24 ) found that adult men consumed an average of 3·5 litres and women 2·9 litres of water daily. Interestingly, the majority of water was consumed in liquid form (33 % plain water and 48 % purchased beverages) and only 18 % from foods. A 1995 Australian national nutritional survey found similar total daily water intake values (men 3·4 litres, women 2·8 litres), but slightly more water (~25 %) was derived from food sources( Reference McLennan and Podger 25 ). In Germany, a recent nutritional survey demonstrated lower average total water intake values (men 2·5 litres daily, women 2·1 litres daily) but that food sources were a more important source of water (~29 % of water intake)( Reference Manz, Johner and Wentz 26 ). Finally, in highland Ecuador, Berti and Leonard( Reference Berti and Leonard 27 ) found comparable daily water intake levels (men 2·6 litres, women 2·4 litres), but a still greater proportion of water coming from food sources (~35 % from tubers, grains and fruits/vegetables, ~65 % from water and milk). Overall, existing nutrition surveys demonstrate that water intake levels are within ranges recommended by the IOM and ESFA but that variation exists in hydration strategies, with a range of ~81 % of water coming from liquids in the USA to ~65 % in highland Ecuador.
Across Amazonia, fruits, tubers and traditional fermented beverages are important components of hydration strategies likely because of limited access to clean water( Reference Nelson, Dinardo and Hochberg 9 , Reference Clement 28 ). For example, the açaí palm’s drupes (Euterpe oleracea) and coconuts are important sources of energy and hydration for Kayapo and Ribeirinhos of Brazil( Reference Piperata, Spence and Da-Gloria 29 , Reference Salm, Feder and Jardim 30 ). Chicha (a home-made fermented beer) is a beverage staple for many Amazonian populations, including Tsimane’. While chicha is important for social reasons, functionally it quenches thirst and hunger( Reference Zycherman 31 ). Chicha can be made with sweet or bitter varietals of manioc, maize and plantains, is masticated, combined with water and set aside to ferment before consumed( Reference Huanca 32 ). In an ethnography about the hunter-gatherer Shuar-Jivaro, Harner( Reference Harner 33 ) stated that on average, men consumed ~3–4 gallons (11·4–15·1 litres) of chicha daily, women 1–2 gallons (3·8–7·6 litres) and children (9–10 years old) half a gallon (1·9 litres). According to Harner( Reference Harner 33 ), raw water was consumed only when chicha was unavailable.
Differences in hydration strategies, e.g. consuming water from raw sources instead of foods or market beverages, have direct implications for nutrition and pathogen exposure( Reference Nichter 34 , Reference Popkin, D’Anci and Rosenberg 35 ). Currently 1·1 billion people worldwide, including Tsimane’, lack access to clean water, which increases the risk of water-borne GI illness( 1 ). GI illness is the most common health outcome of a scarcity of clean water and results from exposure to a pathogenic organism through direct or indirect contact with feces( Reference Black and Lanata 36 ). GI illness morbidity, while more dangerous among children, is associated with weight loss, malabsorption, dehydration, loss of economic productivity and potentially death among adults( Reference Hunter, Zmirou-Navier and Hartemann 37 – Reference Pelto and Pelto 39 ).
The present paper has two goals: (i) to describe water intake and compare differences in hydration strategies among a population without regular access to clean water with international recommendations; and (ii) to examine how variation in hydration strategies is associated with GI illness.
Background and methods
Study population and field site
The present research was conducted among Tsimane’, a forager-horticulturalist indigenous population living in the department of Beni, in north-eastern Bolivia( Reference Zycherman 31 ). Traditionally semi-nomadic, Tsimane’ now live in permanent villages that resulted from renewed missionary efforts in the 1950s( Reference Reyes-García 40 ). These permanent villages have been an impetus for increased engagement with the Bolivian government, the regional market economy and outside organizations. Recent estimates show that their population has almost doubled in the last 25 years to ~15 000 in ~100 villages. While Tsimane’ maintain many aspects of their traditional lifestyles, market participation has increased rapidly leading to increased access to market foods and beverages, thus precipitating dietary changes( Reference Ringhofer 41 , Reference Rosinger, Tanner and Leonard 42 ). The typical Tsimane’ diet consists of self-produced and gathered/hunted foods, such as manioc, plantains, maize, rice, fruits, chicha, fish, chickens, game meat and some market foods, such as dried and salted meats, sugar, pasta, lard, vegetable oil and white flour/bread( Reference Byron 43 ). Food sharing within households and common pot cooking and eating are normal. Various fruits are eaten seasonally, but Ringhofer( Reference Ringhofer 41 ) contends they add diversity to the diet rather than serving as a primary energy source.
The lowlands of Bolivia, like most of Amazonia, are characterized by a scarcity of clean water( Reference Rufener, Mausezahl and Mosler 44 ). Across Tsimane’ villages, six raw water sources exist: river, streams, ponds, open wells, covered wells and collecting rainwater. In October 2013, the first author (A.R.) conducted water quality analysis in the study community from the river (two samples), an open well (one sample) and a covered pump well (one sample) in collaboration with the environmental health laboratory of SEDES Beni, in Trinidad, Bolivia. The analysis revealed the presence of Escherichia coli and fecal coliforms in the water samples from the river, the presence of fecal and total coliforms in the sampled open well, while non-pathogenic total coliforms were found in the sampled closed pump well (A Rosinger, unpublished results).
Much of the health-related research among Tsimane’ reveals that the majority of diseases are infectious. Tsimane’ children and adults have a 56–80 % prevalence of parasitic helminthic infections( Reference Blackwell, Martin and Kaplan 10 , Reference Tanner, Rosinger and Leonard 11 ). Infectious diseases, including GI infection, historically have accounted for more than 50 % of all deaths( Reference Gurven, Kaplan and Zelada 45 ). Additionally, many Tsimane’ consume water from untreated surface sources and water quality is likely worse than in the past due to increased population density, runoff from agricultural activities and livestock, use of toxic detergents and use of motorcycles and cars( Reference Gurven, Kaplan and Zelada 45 ). Nevertheless, it is unclear how much water Tsimane’ consume and how hydration strategies are associated with GI illness among this population.
Study design
During July–August 2012, the first author conducted a cross-sectional observational study using 24 h multiple-pass dietary recall interviews, a demographic survey and anthropometric measurements with forty-five adults in one Tsimane’ community. Our sampling strategy used sex, age and geographic stratification from a community census listing all households. Once stratified, participants in five geographic zones were asked to participate. The goal was to obtain a roughly representative sample of the 105 (fifty-one males) household heads in the community (see Table 1 for sample characteristics). Geographic zones were important to assess because extended families cluster in a zone and share similar water sources. Twenty-five of the fifty-five households in the community are represented in this sample with one or both household heads interviewed. The research was conducted during the dry season when rainfall was infrequent. In the study community, people had access to the Maniqui River, a stream, seven open wells (hereafter, ‘wells’) and eight covered cement wells with hand-pumps (hereafter, ‘hand-pumps’). During September–October 2013, the first author returned to the study community and conducted follow-up semi-structured interviews with twenty-two household heads (twelve male, ten female). Here, four to five households in each geographic community section were selected based on age, sex and relationship to neighbours. Twelve household heads were interviewed during both segments of the study. Interviews were conducted in the participants’ homes, lasted an hour, on average, and were audio-recorded. Topics included diet, thirst, dehydration, water sources, water quality and diarrhoea treatments.
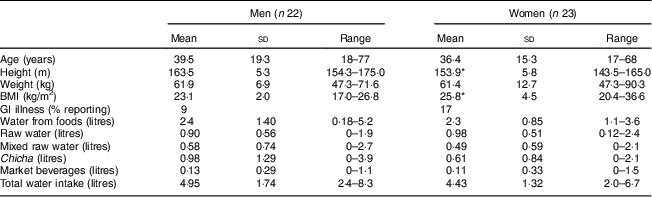
Table 1 Sample characteristics and descriptive statistics of water intake among Tsimane’ adults (n 45) from one village in the Bolivian Amazon with limited access to clean water, July–August 2012
GI, gastrointestinal.
* P<0·05, using two-tailed t test.
The Institutional Review Board at the University of Georgia approved the study protocol (IRB #2012-10290-0). Permission to work in the community was received from the Grand Tsimane’ Council and community members. Verbal consent was obtained from each individual prior to data collection and witnessed by family members. A native Tsimane’ speaker worked as a translator and assistant for this research.
Multiple-pass diet recall
To collect information on individual food and liquid intakes, we used a 24 h multiple-pass diet recall following procedures by Lee and Nieman( Reference Lee and Nieman 46 ). This method has been validated for dietary intake( Reference Conway, Ingwersen and Moshfegh 47 ), is less invasive and time consuming than the weighed food record method and does not alter the usual diet( Reference Lee and Nieman 46 ). A 24 h activity recall was also conducted prior to the dietary intake survey and activities from the previous day were used to prompt recall about foods and drinks consumed before, during and after meals.
The estimation of quantity and volume of foods and liquids consumed was aided by the use of locally used plates, mugs and tutumas (a local bowl made from the shell of Crescentia cujete). For fruits that varied in size, such as papayas and plantains, individuals indicated if the fruit was small, medium or large to best estimate the weight. The majority of meals are prepared in a common pot (e.g. soups, rice, fish or other mixtures). For these foods, homogeneity of items in the pot was assumed per individual following Berti et al.( Reference Berti, Jones and Cruz 48 ). Multiple passes were made on each food interval (breakfast, between breakfast and lunch, lunch, etc.), meaning that when the respondent stated he/she did not eat or drink any other item, the interviewer reviewed the items and amounts consumed with the respondent and others present, which allowed the respondent to revise estimates or make additions or subtractions before moving on to the next interval( Reference Lee and Nieman 46 ). This sequence was repeated until the end of the 24 h period. The interviewer also used discarded food items around the house to prompt recall.
Independent variable: water intake
Water intake was calculated manually from the weight or volume of each item listed in the diet recall into millilitres of water using the Bolivian Food Composition Tables( 49 ) and the US Department of Agriculture National Nutrient Database for Standard Reference( 50 ). While the Bolivian food tables contained the majority of foods reported, the US Department of Agriculture database contains water contents for cooked foods and has been used for other nutritional studies in rural Bolivia( Reference Lazarte, Encinas and Alegre 51 ). We consulted the FAO( 52 ) to estimate water content of sugarcane because it was not listed in either database. We divided water sources into five main categories (see Table 2): (i) water from foods; (ii) raw water, or water from the river, stream, wells or pumps; (iii) raw water mixed with other items, like powdered flavouring, sugar or squeezed fruits; (iv) water from chicha; and (v) water from market beverages (i.e. store bought drinks, such as sodas). Next, to assess each individual’s hydration strategy, we divided the amount of each of the five categories by his/her total daily water intake. This conversion calculated percentage of water intake from each category, standardizing for total water intake. This was necessary because total water intake is proportional to body size, activity patterns and temperature.
Table 2 Description of dietary sources with high water contents reported in this sample during 24 h diet recall; percentage reporting and average number of times each item was listed per participant in parentheses. Tsimane’ adults (n 45) from one village in the Bolivian Amazon with limited access to clean water, July–August 2012

Dependent variable: gastrointestinal illness
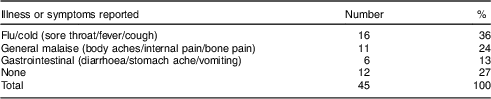
After the diet recall, individuals were asked a series of questions regarding current health status, including illnesses and symptoms (diarrhoeal, respiratory or other sickness) they were experiencing at the time of the interview (see Table 3). Individuals were considered to be suffering from GI illness if they reported one or more of the following symptoms: stomach ache, diarrhoea (three instances of watery stool in the past 24 h) or vomiting. Recall of illness is commonly used to assess health conditions( Reference Schelling, Daoud and Daugla 53 ), yet recall periods that extend beyond 3 d begin to underestimate true disease prevalence( Reference Feikin, Audi and Olack 54 ). We focus our analysis on GI illness because this is the most salient health outcome of water intake.
Table 3 Reported illnesses and symptoms of Tsimane’ adults (n 45) from one village in the Bolivian Amazon with limited access to clean water, July–August 2012
Covariates
We controlled for a number of factors, including age, sex and body composition, which contribute to water needs and are reflected in water recommendations. Age was measured by asking individuals their birth date, how old they were, and verified with a birth certificate when possible. Body composition was assessed through anthropometrics. Weight was measured using a Tanita bioimpedance scale (accuracy 0·1 kg) and height using a standing stadiometer rounded to the nearest 0·1 cm( Reference Lee and Nieman 55 ). BMI was calculated from weight and height as kg/m2 ( Reference Shaw and Braverman 56 ). All measurements were taken three times with the average used in the analysis.
Water quality analysis
Water samples were collected and transported following methods laid out by the US Geological Survey( 57 ) from four sites in the community: the river (two samples), an open well (one sample) and a covered pump well (one sample). Three indicators of water quality were measured: turbidity, fecal coliforms and E. coli. Turbidity was measured using a calibrated nephelometer. One hundred millilitres of the water samples were added to Hach presence/absence broth containers (Hach Company, 2013) to measure fecal coliforms and E. coli. At the laboratory, the Hach containers were placed in an incubator at 35 °C. Following 24 h of incubation, the water samples were checked for conversion of colour and fluorescence, which indicates presence of fecal coliforms and E. coli, respectively.
Statistical analysis
Data were entered into Microsoft® Excel, and each dietary item was converted to water content using the food composition tables and databases described above. Data were then transferred to the Stata statistical software package version 13 for analysis. The value of α was set to 0·05 using two-tailed tests, robust standard errors and 95 % confidence intervals. The outcome variable (reported GI illness) is dichotomous, so we used the Student’s t test to examine differences in hydration strategies between individuals who did and did not report GI illness. Next, logistic regression analysis was used with robust standard errors clustered by household to address potential confounding of household membership, dietary intake and transmission of GI illness within the household. Finally, using the ‘margins’ command in Stata, we assessed the predicted probability of GI illness using coefficients and sample means from the logistic regression analysis. Predicted probabilities calculated from logistic regression are often preferable to odds ratios, because they do not overstate associations with rare outcomes and lend themselves to visual representations of results( Reference Graubard and Korn 58 ).
Results
Hydration strategies
Men and women in the sample reported an average of 4·95 litres and 4·43 litres of water daily, respectively (see Table 1). Hydration strategies between men and women were similar, with men and women acquiring approximately 48 % and 50 % of water from food sources, 18 % and 22 % from raw water, 20 % and 13 % from chicha, 12 % and 11 % from mixed raw water; and 3 % from market bought beverages, respectively. Four per cent of individuals obtained water from all five categories of water, 40 % used four of the five categories and 38 % used three of the five categories. Food was consumed by all participants and contributed between 0·18 and 5·15 litres of water (see Table 2).
Nearly the entire sample (96 %) drank some raw water (range of 0 to 2·42 litres), with the majority using the river or hand-pumps as their primary raw water source. The predominant cultural construct of clean raw water in this sample related to clarity. During the follow-up interviews, all twenty-two of the participants mentioned clarity and turbidity as the primary indicators of how they judge cleanliness when asked ‘what makes water clean/dirty?’ Moreover, the majority of interviewees stated that they let the water settle before consuming it, but used no other treatment methods with the exception of one individual who reported boiling water in the past few months. While most participants indicated they believed the hand-pumps and wells were a cleaner source of water than the river because the water was clearer, distance to the water source was also a major factor in their decision-making process. These perceptions of water cleanliness were consistent with water quality analyses conducted in 2013 by the first author as the hand-pumps were negative for fecal coliforms and E. coli and had a turbidity of 10 Nephelometric Turbidity Units (NTU). The well water was slightly clearer with a lower turbidity reading (5 NTU) but was positive for fecal coliforms. Groundwater sources generally have turbidity of about 5 NTU but can range up to 19 NTU( 57 ). The river’s average turbidity reading was much higher at 57 NTU and was positive for E. coli and pathogenic fecal coliforms. Overall, participants rated the river as the dirtiest raw source and the hand-pumps as the cleanest.
Water came from many sources and 62 % of individuals reported mixing raw water (0–2·7 litres) with sugar, a purchased vitamin C-fortified powdered flavouring or juice extracted from fruits, sugarcane and chive (ground manioc). During follow-up interviews, interviewees stated they preferred these refrescos because they were easier to drink and encouraged hydration. During participant observation, the consumption of sugar mixed with raw water was commonly observed and parents frequently gave this mixed beverage to young children. While mixing these items with raw water may make beverages more palatable, it does not clean the water. Slightly over half of the sample (56 %) reported drinking chicha (0 to 3·9 litres), with men consuming more than women. Finally, 18 % of the sample reported drinking market beverages, such as sodas, beer and chocolate milk (0 to 1·47 litres).
Hydration strategies and gastrointestinal illness
Cases of GI illness were strongly related to primary water source. Of the 13 % of adults reporting GI-related symptoms, all of the cases came from people who used the river (two of twenty-two) and stream (four of six) as their primary water sources. No cases of GI illness were reported among those who used wells or hand-pumps. These results are consistent with the water quality analysis described above indicating the river had more contamination than other sources.
Individuals with GI illness did not have statistically different total water intake to those without GI illness (5·0 litres v. 4·6 litres, P=0·42). However, when we examined the hydration strategies of individuals who reported GI illness v. those who did not, we found differences in the percentage of water coming from foods v. liquids. First, those with GI illness consumed 35 % (1·8 litres) of their water from food and those without GI illness acquired 52 % (2·4 litres) of their water from food (t=2·55; P=0·015). Additionally, market beverages (soda, specifically) accounted for 8 % (0·4 litres) of water intake for those with GI illness and only 2 % (0·1 litres) for those not experiencing symptoms (t=−2·08; P=0·044). Individuals who reported GI illness did not obtain significantly different percentages of their hydration strategy from raw water sources and chicha compared with individuals without symptoms (P=0·44; P=0·36, respectively). Finally, mixed raw water intake was similar among those with and those without GI illness (9 % v. 11 %, P=0·71).
Regression analysis
Using logistic regression, we estimated the odds of reported GI illness by percentage of water acquired from food sources. Each percentage increase in water obtained from foods was associated with 6 % lower odds (P=0·032) of GI illness (see Table 4, model 1). Restricting the logistic regression to individuals who obtained their water from the river or stream (n 28) did not change the strength of the association but did reduce the statistical significance slightly due to reduced power (OR=0·94; 95 % CI 0·88, 1·00; full results not shown). After controlling for gender, age and BMI, the relationship between water intake from food and GI illness remained significant (model 2, OR=0·91; P=0·050), the strength of the association increased and the fit of the model to the outcome data improved (pseudo R 2 increases from 0·15 to 0·25). Further, we assessed the association of the absolute volume of raw water consumed (per 100 ml) on the probability of GI illness. Model 3 indicated that the association between raw water consumption and GI illness was significantly related after controlling for covariates. Each 100 ml of raw water consumed was associated with 12 % higher odds (P=0·05) of GI illness. When controlling for raw water consumed, as well as sex, BMI and age, percentage of water from foods remained significantly negatively associated with GI illness (model 4, OR=0·92; P=0·019).
Table 4 Logistic regression of water intake from foods and raw water on odds of reporting gastrointestinal (GI) illness among Tsimane’ adults (n 45) from one village in the Bolivian Amazon with limited access to clean water, July–August 2012

* P<0·05. Robust standard errors are adjusted for twenty-three clusters in household. All models include a constant term.
Using the coefficients from model 4, Fig. 1 illustrates how the predicted probability of GI illness changed depending on how much water an individual consumed from food sources. According to the statistical model, the probability of GI illness decreased in a non-linear fashion as water intake from food sources increased. In fact, the predicted probability of GI illness was significantly higher than the sample average (13 %) among individuals who obtained less than 43 % of their water intake from food sources. At the high end of the range of water acquired from food sources reported in the sample (73 %), the probability of GI illness was less than 1 %.
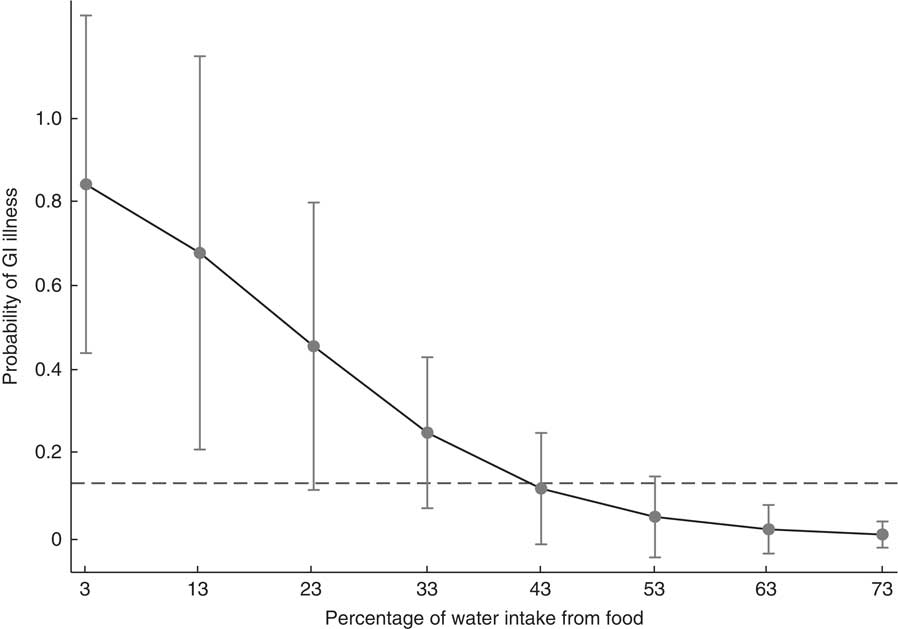
Fig. 1 Margins plot using coefficients and means from model 4 in Table 4 within the range of data reported in the sample indicating the probability of gastrointestinal (GI) illness by percentage of water intake from food, with 95 % CI at each margin represented by a vertical bar. Dashed line shows the prevalence of GI illness in the sample (13 %). Tsimane’ adults (n 45) from one village in the Bolivian Amazon with limited access to clean water, July–August 2012
Discussion
Very few water intake data exist for non-industrialized populations, especially forager-horticulturalist populations, so it is difficult to know how water recommendations match actual population consumption. Tsimane’ men and women in the present sample consumed an average of 1·2 litres and 1·7 litres more water daily than the IOM’s AI water recommendations (3·7 litres and 2·7 litres). The difference is greater when compared with the ESFA’s recommendations (2·5 litres and 2·0 litres). This difference in water intake is most likely due to high ambient environmental temperatures, coupled with moderately high physical activity levels( Reference Gurven, Jaeggi and Kaplan 59 ). However, despite the higher absolute reports of water intake, it is difficult to judge whether these levels are sufficient to meet water needs, particularly during the dry season when Tsimane’ engage in physically demanding labour clearing fields for planting. During follow-up interviews, all informants reported experiencing thirst (jari’rij) and dehydration (chanij) daily and that these symptoms were most severe when working in their fields.
Nevertheless, individuals in this sample reported a high diversity of dietary items in their hydration strategies. The majority of participants used water from foods and raw water in addition to chicha, mixed raw water or market drinks. Most strikingly, Tsimane’ in this sample obtained ~2·3 litres of their water from foods or almost 50 % of their total water intake, much higher than the 0·7–1·0 litres (or 19–32 %) reported among industrialized populations( Reference Jequier and Constant 12 , Reference Kant, Graubard and Atchison 24 ). Many of the fruits in the Amazon, such as papayas, grapefruits and oranges, are water-rich and contain 80 to 90 % water( Reference Clement 28 ). Additionally, dietary staples like plantains and manioc, which are consumed with almost every meal, provide significant amounts of water although the content varies by method of food preparation. For example, a plantain is 65 % water yet cooking it in water increases water content to 67 % and frying it reduces water content to 49 %( 50 ). These differences in food preparation can have multidimensional consequences, for not only does frying plantains increase the fat and energy contents, but it may encourage people to get more water from less clean sources.
In relation to GI illness, river and stream raw water sources, but not wells or hand-pumps, were associated with risk of reporting symptoms in this sample. The hand-pumps had a closed cement cover that prevented contamination from entering the water source as well as soil filtration of the water and were the only source that was not contaminated with pathogenic fecal coliforms or E. coli. In this community, none of the water sources have individual ownership and are free for all to use. The hand-pumps were built near several groups of homes and communal locations during public health interventions in the early 2000 s( Reference Ringhofer 41 ) and again in early 2012.
Water clarity, which was the main attribute listed when asked to judge water cleanliness, can serve as a proxy for relative cleanliness, i.e. between the river which was highly turbid and the wells or hand-pumps. Clarity cannot be used to discern between the water quality of the well and hand-pump because the hand-pump had higher turbidity than the well, but was negative for contamination. These results are similar to reports from Puerto Rico and Brazil, where turbidity levels were associated with sensory, or organoleptic, perceptions of water quality and affected the likelihood of treating water by filtration or boiling, and searching for alternative water sources or buying bottled water( Reference Jain, Lim and Arce-Nazario 60 , Reference Queiroz, Doria and Rosenberg 61 ). Other studies have found that odour and taste also affect perception of water quality but are often uncorrelated to objective water quality( Reference Orgill, Shaheed and Brown 62 ). Individuals experiencing GI illness who relied on the river or stream as their primary water source stated that the only times they switch to a well or a hand-pump were when the water was highly turbid or had a bad odour. These sentiments are interesting to consider for future water-related public health interventions as turbidity levels, placement and travel time of improved water sources relative to alternative sources may affect behaviours and effectiveness of interventions.
It is clear that while the primary raw water source is important to consider, it does not fully explain GI illness risk as many individuals who used the river water did not report GI illness. Hydration strategies must be studied holistically as we found that increased water from foods, but not other sources, was associated with decreased risk of GI illness. This finding echoes McClatchey and Reedy’s( Reference McClatchey and Reedy 8 ) assertion that apples are a container of clean water. In this sentiment, the Amazon is a fruit-rich environment with the ground acting as a water purifier( Reference Clement 28 ). For example, papayas grow year-round in Tsimane’ horticultural fields( Reference Huanca 32 ). These fruit are a good source of energy when working, but one large papaya with pink flesh (88 % water) also contains ~687 ml of clean water( 50 ). Recent research suggests that increasing water from whole foods may improve health and hydration, especially after physical activity( Reference Potter 63 , Reference Sharp 64 ). Consuming a large amount of water from foods may serve as a nutritional adaptation by reducing exposures to pathogens in an environment without access to clean water.
Similar to other Amazonian populations, chicha is an important part of Tsimane’ hydration strategies, yet we did not find any association between it and risk of illness. In a review of chicha use in Ecuador, Cox and colleagues( Reference Cox, Caicedo and Vanos 65 ) found that fermented chicha showed no signs of fecal coliforms and indicated that the fermentation process can potentially make contaminated water potable. Likewise, the fermentation process of cider and beer has been cited as a mechanism to purify water( Reference McClatchey and Reedy 8 , Reference Nelson, Dinardo and Hochberg 9 ). A possible explanation for the lack of an association in the present study could be due to grouping chicha into one category when different individuals consumed batches of chicha with different levels of fermentation.
Limitations
The present study is subject to several limitations. First, the relationships reported herein should be viewed as associations because this is a cross-sectional study. Previous research among Tsimane’ has found that the average community has about twenty households and water is commonly drawn from the Maniqui River and streams( Reference Godoy, Nyberg and Eisenberg 66 ). In comparison, the present study community is large (fifty-five households) and has access to several water sources. While a small sample size drawn from one community reduces the generalizability of the results to the larger Tsimane’ population, we do not believe that selection bias is present within the sample due to the sampling strategy. Each geographic zone was equally represented to avoid over-representing closely related household clusters and to accurately capture the use of each available water source. When comparing the nutritional characteristics of the adults in this sample to recent research( Reference Rosinger, Tanner and Leonard 42 ) on an exhaustive sample of Tsimane’ adults in forty randomly chosen communities, women in this sample had higher weights and BMI (61·3 v. 53·8 kg and 25·8 v. 23·7 kg/m2), but there were no differences in other demographic factors. This difference may affect the absolute amount of water intake of women as larger body sizes require more water and may partially account for why women’s reported water intake in this sample is 1·7 litres higher than the IOM’s recommendations for women, whereas men’s intake is 1·2 litres higher. Higher BMI, which is controlled for in the logistic regression models, should not bias the probability of infection with GI illness.
Additionally, with only one 24 h dietary recall for each individual in the dry season, we cannot measure intra-individual variation, nor can we comment on changes in hydration strategies throughout the year as environmental resources change. However, fifty days of participant observation during both periods of data collection indicated that dietary intakes are relatively consistent as individuals relied on the same dietary staples (plantain, manioc, rice, pasta) daily with changes in the main protein source (fish, dried-salted pork or hunted game). Additionally, these foods are among twenty-one dietary items that comprise >90 % of energy intake among this population( Reference Zeng, Eisenberg and Jovel 67 ). This suggests that the dietary intakes reported here are good indicators of the general diet in the community during the dry season. The weights/volumes of foods and liquids consumed were an estimation made by participants and any estimation errors were transferred to the conversion of water intake( Reference Grandjean 68 ), yet we do not believe that any potential errors would be systematically biased.
The association between water intake from food and GI illness may be subject to reverse causality bias. Individuals may shift their hydration strategies when sick with GI illness, leading to the pattern observed in the current paper. Many populations are known to restrict intakes of foods or change hydration strategies when treating GI illness( Reference Nichter 34 ). During follow-up interviews, we asked individuals how being sick with diarrhoea affected their hydration strategies. The majority of interviewees stated they reduce intakes of every dietary item, including food, fruits, raw water, chicha, sodas and mixed raw water, because consuming more worsens the condition. However, several participants indicated that consuming fermented manioc chicha and sodas helps treat diarrhoea, and two participants indicated they increase raw water intake when sick with diarrhoea. While sodas present significant sources of sugar and energy that are associated with weight, fat gain and risk of diabetes when consumed excessively( Reference Popkin, Armstrong and Bray 18 ), in this context they are also a source of clean water, regulated by factory standards. Therefore, individual hydration strategies may be part of a cycle, where they are both related to but also affected by GI illness.
Finally, the study does not account for oxidative water processes, so the total water intake estimates herein could be up-revised by ~200–350 ml per individual( Reference Vivanti 14 ). The current paper presents water intake levels rather than hydration status and thus cannot address with certainty whether the water intake levels found here are sufficiently meeting needs. Future research should assess hydration status in conjunction with food and fluid intakes to fill this gap.
Conclusions
The present paper reports that a sample of Tsimane’ adults use diverse environmental water sources and that hydration strategies rely heavily on foods. As water recommendations become exported to developing countries, recommendations should be region specific as access to clean water varies and estimates from industrialized countries can under- or overestimate water needs. High levels of water-borne pathogens create a context where complex strategies must be developed to acquire clean water. While water intake from untreated surface sources is likely leading to infection with GI illness in this sample, increased intake of water from foods may decrease the risk of GI illness. Most notably, individuals consuming high levels of water from foods (43–73 %) had markedly lower probability of GI illness. These findings suggest that people living in areas without clean water may use water-rich foods as a dietary adaptation to reduce exposures from dirty water.
Changes in hydration strategies are particularly important to understand because when individuals shift their intake from clean (i.e. food and fruits) to dirtier (i.e. river) water sources when sick, it may create a cycle of illness. Future studies should consider how current and past nutrition transitions affect hydration strategies and water needs since shifts in dietary intake and food preparation, i.e. fruits to grains, may yield net declines in water intake from foods( Reference Vivanti 14 ). Finally, research is needed to corroborate these findings and examine hydration strategies among children, the population most vulnerable to diarrhoeal diseases.
Acknowledgements
Acknowledgements: The authors extend special thanks to the Grand Tsimane’ Council, Johnny Maito, Dino Nate, the TAPS Bolivia Study Team and Kelly Ochs Rosinger for facilitation with the research. Thanks also go to Dr Ricardo Godoy, Dr Ted Gragson, Dr William Leonard, Dr Laurie Rietsema and Dr Bram Tucker for advice on the manuscript and research. Financial support: This research was supported by a Dissertation Fieldwork Grant from the Wenner-Gren Foundation (#47932), a National Science Foundation Doctoral Dissertation Research Improvement Grant (#1341161), a Dean’s Award and Summer Doctoral Research Fellowship from the Graduate School and a Summer Travel Award from the Latin American & Caribbean Studies Institute at the University of Georgia. The funders had no role in the design, analysis or writing of this article. Conflict of interest: None. Authorship: A.R. and S.T. conceptualized and designed the research. A.R. conducted the research, analysed the data and prepared the manuscript. S.T. helped with manuscript preparation. Ethics of human subject participation: The Institutional Review Board at the University of Georgia approved the study protocol (IRB #2012-10290-0).


