


Adult malnutrition is measured using BMI according to WHO guidelines(1,2) . In these guidelines, mild thinness is defined as BMI 17–18·49 kg/m2, moderate thinness 16–16·9 kg/m2 and severe thinness <16 kg/m2. Of note, in many programmatic contexts the term thinness has been replaced by acute malnutrition. However, in this article we follow the WHO terminology.
BMI measurement is time- and labour-intensive and requires a skilled health worker able to complete two measurements and make a calculation(Reference Collins3). Because of these difficulties, mid-upper arm circumference (MUAC) has been studied as a quicker and simpler way to identify thin individuals. The measurement of MUAC does not require expensive equipment, undressing or a calculation. When cut-offs to define poor nutritional status are preselected, they can be marked onto simple colour-coded armbands for initial screening(Reference Tang, Chung and Dong4,Reference Tang, Chung and Dong5) . This way, a skilled health worker is not required to perform initial screening using numbers and calculation(Reference Tang, Chung and Dong4,Reference Tang, Chung and Dong5) . A study from rural India among ninety-nine adolescent and young adult women found that measuring simple armband MUAC took on average 10 s v. 59 s for measuring height alone(Reference Sethi, Parhi and Dar6).
The objective of most previous studies has been to select a cut-off below which an individual can be classified as thin using MUAC as a proxy for BMI measurement(Reference Collins3,Reference Tang, Dong and Deitchler7–Reference Navarro-Colorado17) . However, there has been no consensus on an optimal cut-off, with values from 17·0 cm to 25·1 cm advocated in the literature for MUAC (Table 1). These different cut-offs partly result from the use of different BMI cut-offs to define thinness, where some literature focused on BMI < 16 kg/m2 while other work has emphasised BMI < 18·5 kg/m2 for example (Table 1). Recently, Tang et al. produced an individual-level meta-analysis and found MUAC cut-offs in range of ≤23·0 cm to ≤25·5 cm could serve as proxies for any thinness (BMI <18·5 kg/m2)(Reference Tang, Chung and Dong4,Reference Tang, Chung and Dong5) . Their analysis stratified by gender, disease status such as HIV, and geographies and proposed that a cut-off of ≤ 24·0 cm could adequately classify any thinness across these groups(Reference Tang, Chung and Dong4,Reference Tang, Chung and Dong5) .
Table 1 Selected example studies comparing MUAC and BMI

MUAC, mid-upper arm circumference.
As part of their routine work, the International Committee of the Red Cross (ICRC) implements nutritional monitoring surveys in places of detention to monitor thinness prevalence and identify detainees in need for treatment of thinness. Because some detention centres have thousands of inmates, a survey identifying those with low BMI can take several days to complete. Therefore, some larger detention centres are only monitored twice a year, potentially resulting in late identification and treatment of thinness.
Our study objective was to evaluate whether MUAC could facilitate increased frequency of screening of individuals for thinness in sub-Saharan African detention centres served by ICRC. We chose an approach loosely analogous to the use of MUAC in child malnutrition surveillance where a MUAC measurement tape has ‘green’, ‘yellow’ and ‘red’ segments, each corresponding to different management steps. In our schema, the ‘green’ group would be healthy (i.e. non-thin) detainees who do not require further BMI screening as their MUAC would not indicate any thinness, the ‘yellow’ group would require BMI screening and the ‘red’ group would likely be severely thin and require immediate treatment. We hypothesised that establishing a three group system using two MUAC cut-offs would result in a reduction in number of detainees requiring BMI measurement and allow more frequent identification of those most in immediate need of treatment for thinness.
Subjects and methods
Our study was undertaken in a collaboration between ICRC and the Centers for Disease Control and Prevention (CDC) during which CDC supported secondary analysis of data from ICRC routine monitoring surveys. We completed a secondary data analysis of anthropometric monitoring surveys of adult male detainees in Africa conducted by ICRC. We sought to develop a three-group triage system to reduce the number of detainees requiring BMI screening and identify detainees who urgently need treatment. This system requires two MUAC cut-offs: an upper cut-off above which detainees are considered healthy (‘green’ group) and undergo no further screening. Detainees below a second lower cut-off (‘red’ group) would be referred for immediate severe thinness treatment without measuring BMI. Eventually, their BMI would be measured during treatment to monitor efficacy of treatment. Finally, detainees with MUAC between these two cut-offs would have their BMI measured (‘yellow’ group). Thus, the primary outcomes of our study were these two cut-offs and our secondary outcome was the proportion of detainees who would not require additional screening. This schema is summarised in Fig. 1.

Fig. 1 Example MUAC tool
The anthropometric monitoring surveys conducted by ICRC included measurement of height, weight and MUAC. These measurements were obtained using stadiometers, scales and MUAC tapes from the ICRC Standard Products Catalogue(19–21). Measurements were completed by ICRC staff or local country health workers who received training on measurement technique immediately prior to completing the survey with similar procedures in each place of detention. One author participated in the collection of some of these data as part of a previous role at ICRC. All detainees were offered to be measured voluntarily and had the right to refuse via verbal consent. Each detainee was measured once during a survey. The proportion of detainees who declined measurement was not formally recorded. However, ICRC experience is that over 95 % of detainees typically participate. ICRC shared the data from the most recent survey of each detention centre.
Detainees with BMI < 18·5 kg/m2 were offered treatment. Specifically, detainees with BMI < 16 kg/m2 were offered ready-to-use therapeutic food on the top of the daily penitentiary food ration to increase total caloric intake to 4000 kcal/d. Detainees with BMI 16–18·49 kg/m2 received either ready-to-use supplementary food or additional meals and micronutrient supplements (varying by local circumstance) to increase their total caloric intake to 3000 kcal/d.
Exclusion criteria for our analysis included age <18 years, missing/invalid age data and the known presence of oedema. ICRC worked to exclude the possibility of duplicates in their programmatic data by inviting participation either using a list of detainees or by proceeding systematically cell by cell in a given detention centre. Additionally, ICRC included only one survey from each detention centre in the data shared with CDC to reduce the possibility of a detainee being duplicated in the data. After initial exclusions, we performed a check for duplicates during analysis by identifying detainees with identical month and year of data collection, country, MUAC, weight and height. These were not excluded in the primary analysis as we could not exclude the possibility of two detainees with identical parameters being present in the data, but were excluded in a sensitivity analysis.
The countries, places of detention and detainees’ names were deidentified by ICRC prior to sharing with CDC. Complete deidentification of the countries was necessary per ICRC policy to ensure that ICRC continues to have access to the detention centres(22). Specifically, disclosure of the prevalence of thinness in particular countries could threaten ICRC access to detainees and impede ICRC programmes(22). Because of the deidentification, CDC determined the activity was non-human research involving anonymous data collected for other purposes. ICRC presented the research to the Research Ethics Committee of the Canton of Geneva Switzerland that confirmed that analysis of the monitoring data did not require formal review.
Descriptive statistics
We calculated summary statistics for demographic characteristics, MUAC, weight, height and BMI and calculated the prevalence of mild, moderate, severe and any thinness based on BMI status in our population.
Measures of diagnostic accuracy
We calculated sensitivity and specificity of MUAC cut-off values in 0·5 cm increments from < 19·0 cm to < 26·5 cm to detect any thinness (BMI < 18·5 kg/m2), moderate or severe thinness (BMI < 17 kg/m2) and severe thinness (BMI < 16 kg/m2). We fit mixed-effects logistic regression models to give summary estimates of sensitivity and specificity across our entire population while accounting for differences between countries. A separate model was fit for each MUAC cut-off with the MUAC cut-off as a fixed effect, country as a random effect and the presence of each the above categories of thinness as outcome. These models were then used to calculate sensitivity and specificity and 95 % CI at each MUAC cut-off. Additionally, we constructed receiver operating characteristic curves to evaluate MUAC’s ability to classify each category of thinness and calculated the area under receiver operating characteristic curve. The area under receiver operating characteristic curve values closer to 1·0 indicate better classification ability of MUAC for BMI. Several post-hoc sensitivity analyses were performed to ensure the robustness of our estimates. These included stratification into high and low thinness prevalence countries, analysis of detainees with missing age data, exclusion of teenage detainees (18 and 19 years old) and detainees over age 50, excluding detainees who may have been duplicates and adjusting for variability of month and year of data collection in our model. Further details can be found in the online supplementary material, Supplemental Methods.
Selection of mid-upper arm circumference cut-off values
To select an upper cut-off, we set a minimum sensitivity of 80 % for any thinness (BMI < 18·5 kg/m2) with a second criterion of sensitivity 90 % for moderate or severe thinness (BMI < 17 kg/m2). A higher sensitivity means correctly identifying a larger proportion of the thin detainees, but potentially at the cost of misclassifying more healthy detainees as thin. Specifically, our criteria means that 80 % of individuals with any thinness (BMI < 18·5 kg/m2) and 90 % of those with moderate or severe thinness (BMI < 17 kg/m2) would be detected and potentially receive treatment because they are classified as either ‘yellow’ or ‘red.’ Setting an even higher sensitivity goal would result in more false positives and reduce the time savings produced using MUAC. Once we selected a cut-off, we evaluated the proportion of our population who no longer required BMI screening. Finally, we identified thin detainees who were incorrectly classified as ‘green’/healthy by our upper cut-off (false negatives) and examined what proportion of these had severe, moderate and mild thinness.
For the lower cut-off, we set a minimum specificity of 99 % for severe thinness (BMI < 16 kg/m2). Higher specificity in our population means making sure that few detainees with high BMI would receive unnecessary severe thinness treatment, that is, reducing the number of false positives. Thus, this cut-off would classify 99 % of detainees with BMI ≥ 16 into the ‘yellow’ or ‘green’ group while 1 % would be incorrectly classified into the ‘red’ group. After we selected a cut-off, we examined the false-positive detainees who had a ‘red’ MUAC but did not have severe thinness. We determined what proportion were, in fact, healthy (BMI ≥ 18·5 kg/m2) or only had mild thinness (BMI 17–18·5 kg/m2). We calculated this proportion because, while any cut-off we selected would have some false positives, we especially wanted to ensure that very few healthy or only mildly thin detainees would receive severe thinness treatment.
All analyses were performed in Stata IC version 16 (StataCorp.).
Results
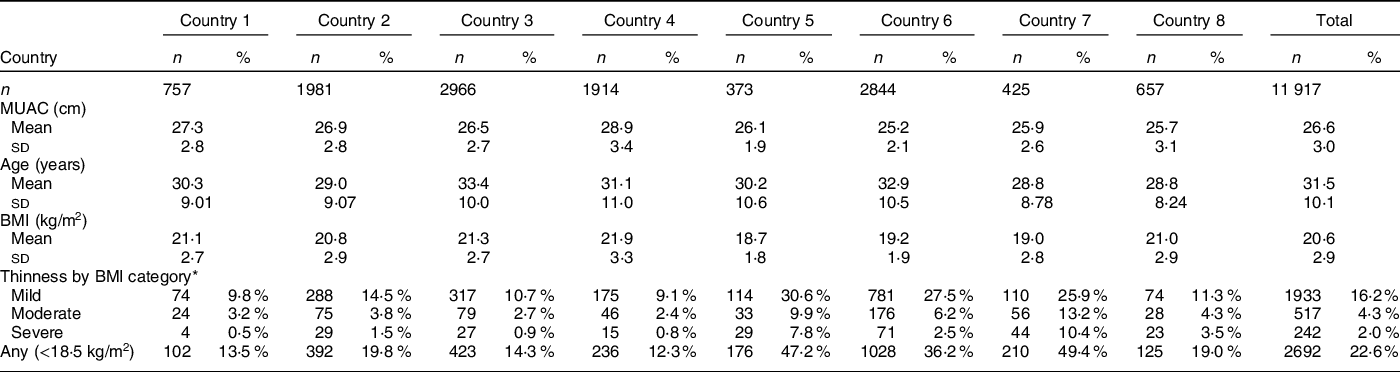
ICRC provided data on 16 358 detainees with complete data on height, weight, MUAC, and month and year of collection from thirty-eight places of detention. After exclusions (see Fig. 2), our final population had 11 917 detainees with a mean age of 31·5 years (sd 10·1). When we checked for duplicates in this population, we found eight records that were possibly duplicated based identical on height, weight, age, MUAC, country, and month and year of collection. These were retained in the primary analysis because we did not have clear evidence that two detainees did not simply share these characteristics, but did perform a sensitivity analysis where they were excluded. Descriptive statistics by country are shown in Table 2. The mean BMI in the full population was 20·6 kg/m2 (sd 2·9) and mean MUAC was 26·6 cm (sd 3·0). The prevalence of any thinness (BMI < 18·5 kg/m2) in our population varied between 12·3 % in country 4 to 49·4 % in country 7. Similarly, the prevalence of severe thinness (BMI < 16 kg/m2) varied between 0·5 % in country 1 to 10·4 % in country 7.

Fig. 2 Flow of participants through study
Table 2 Descriptive statistics and prevalence of thinness by country
MUAC, mid-upper arm circumference.
* Mild thinness – BMI 17–18.49 kg/m2, moderate thinness – BMI 16–16.9 kg/m2 and severe thinness – BMI < 16 kg/m2.
Measures of diagnostic accuracy
The sensitivity and specificity of cut-offs in 0·5 cm increments calculated using mixed-effects logistic regression are shown in Table 3. The area under receiver operating characteristic curve for any thinness was 0·87 for all countries (BMI < 18·5 kg/m2), 0·90 for moderate or severe thinness (BMI < 17 kg/m2) and 0·92 for severe thinness (BMI < 16 kg/m2). Our sensitivity analyses did not yield materially different results from what we report here and can be found in the online supplementary material, Supplemental Results and Supplemental Tables 1, 2 and 3.
Table 3 Summary estimates of sensitivity and specificity across all countries

MUAC, mid-upper arm circumference; 95 % CI: 95 % confidence interval calculated using mixed-effects logistic regression model.
* Unstable estimates in model due to cell counts < 10.
Selection of upper cut-off to exclude healthy (i.e. non-thin detainees)
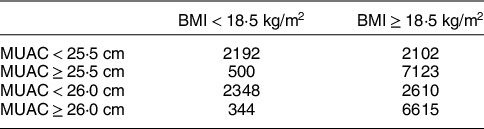
The upper cut-off that met our minimum sensitivity criterion of 80 % for BMI < 18·5 kg/m2 was 26·0 cm, with a sensitivity of 83·6 %. The cut-off that met our second criterion of minimum sensitivity of 90 % for BMI < 17 kg/m2 was MUAC < 25·5cm, with a sensitivity of 92·1 %. This 25·5 cm cut-off had a sensitivity of 77·0 % for BMI < 18·5 kg/m2. This means that 77·0 % of detainees with BMI < 18·5 kg/m2 would be included in the ‘yellow’ or ‘red’ group and have their BMI measured or receive immediate treatment, with the remainder incorrectly classified into the ‘green’ group with BMI ≥ 18·5. For reference, crude 2 × 2 tables for these cut-offs can be found in Table 4. Note that these tables are an oversimplification of our analysis that does not allow for adjustment for differences between countries.
Table 4 Crude contingency table for any thinness and upper cut-offs of MUAC < 25·5 cm and <26·0 cm
MUAC, mid-upper arm circumference.
When we evaluated the potential time savings of the anthropometric screening with these MUAC cut-offs, we found that for MUAC < 26·0 cm, 58 % (6959/11,917) of detainees in our population would not need to have their BMI measured because they would be in the ‘green’ group. For a 25·5 cm cut-off, 64 % (7623/11,917) of detainees would no longer require BMI measurement. Because the 25·5 cm cut-off was so near our prespecified 80 % sensitivity for any thinness criterion and suggested significant additional time and labour resource savings, we selected this cut-off.
Subsequently, we evaluated the ‘false negative’ detainees – those incorrectly classified in the ‘green’ group who were thin and would thus go untreated. Our sample had 500 of these individuals: 13/500 (2·6 %) had severe thinness (BMI < 16 kg/m2), 36/500 (7·2 %) had moderate thinness (BMI 16–16·9 kg/m2) and 451/500 (90·2 %) had mild thinness (BMI 17–18·4 kg/m2). Thus, most missed detainees would have mild thinness. The thirteen individuals with BMI < 16 were in six different countries, and there was no clear evidence of data entry error.
Selection of lower cut-off for immediate treatment
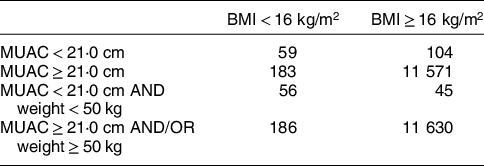
The lower cut-off that met our minimum specificity criterion of 99 % for BMI < 16 kg/m2 was MUAC < 21·0 cm with sensitivity 25·4 % (95 % CI 11·7, 39·1) and specificity 99·0 % (95 % CI 97·9, 100·0) for BMI < 16 kg/m2. The crude positive predictive value for this cut-off was 36·2 % (meaning that detainees with MUAC < 21·0 cm had a 36·2 % probability of having BMI < 16 kg/m2 (see Table 5, 59/(59 + 104)). When we analysed the 104 false-positive detainees identified by the ‘red’ cut-off, we found that 39/104 (37·5 %) had BMI ≥ 18·5 kg/m2, with the remainder having BMI between 16 and 18·5 kg/m2. Thus, a ‘red’ group based on MUAC alone would result in unnecessarily treating substantial numbers of individuals with a BMI > 18·5 kg/m2.
Table 5 Crude contingency table for severe thinness and lower cut-offs of MUAC < 21·0 cm and MUAC < 21·0 cm and weight <50 kg
MUAC, mid-upper arm circumference.
Because of this problem, we explored adding a second weight criterion. We recalculated the estimates of sensitivity and specificity using our model and found that a cut-off of MUAC < 21·0 cm and a weight <50 kg had a specificity of 99·6 % (95 % CI 99·0, 100·0) and sensitivity of 24·7 % (95 % CI 10·5, 39·0) for BMI < 16 kg/m2. When we evaluated weights below 50 kg, we reduced sensitivity while weights above 50 kg had less improvement in specificity. Crude 2 × 2 tables of this 21·0 cm cut-off alone and with the addition of the 50 kg requirement are shown in Table 5. Importantly, only 4/45 (8·9 %) false positives identified with this cut-off had BMI ≥ 18·5 kg/m2, indicating that nearly all detainees receiving treatment would have some degree of thinness. The crude positive predictive value for MUAC < 21·0 cm and weight <50 kg was 55·4 % for severe thinness (56/(45 + 56)). This means that over half of individuals with MUAC < 21·0 cm and a weight <50 kg would have BMI < 16 kg/m2 with 91·1 % (41/45) having BMI from 16–18·5 kg/m2. Specifically, of the forty-five individuals incorrectly classified into the ‘red’ group, twenty-six have BMI 16–16·9 kg/m2, fifteen have BMI 17–18·4 kg/m2 and four have BMI > 18·5 kg/m2.
Discussion
Our study found that MUAC can be effectively used to reduce the time and labour needed to screen detainees for thinness in sub-Saharan Africa. A MUAC cut-off of ≥25·5 cm for a ‘green’ group can identify detainees at low risk for thinness and allow those at higher risk to undergo further screening. The use of this cut-off would result in about a two-thirds reduction in the number of detainees requiring a BMI measurement. Additionally, we found that a cut-off of <21·0 cm and a weight <50 kg for a ‘red’ group could reliably identify those most immediately in need of treatment. The proposed schema is shown in Fig. 3. Detainees would first be screened into a ‘green’, ‘yellow’ and ‘red’ group. ‘green’ detainees would be those with MUAC ≥ 25·5 cm and would be excluded from further assessment. Patients whose MUAC was <21·0 cm and had weight below 50 kg (‘red’ group) could be sent directly to treatment, while all other detainees would need further screening for BMI.

Fig. 3 Proposed management schema
While our study found that our ‘green’ group ≥25·5 cm cut-off would misclassify 23 % of the thin detainees in our population as healthy (false negatives), this cut-off would only misclassify 5·4 % (13/242) of those with severe thinness (BMI < 16 kg/m2) in our population as healthy. We were unable to identify a MUAC cut-off that would alone reliably predict those with severe thinness (BMI < 16 kg/m2) such that they would not need to have their BMI measured before treatment. To improve the predictive value of the selected cut-off of <21·0 cm, we added a second weight criterion of <50 kg. This schema could be particularly useful in contexts where a larger number of severely thin detainees are expected, such as in a severe food crisis. A study by Collins during a famine found that MUAC < 18·5 cm was a good predictor of those with more severe thinness (BMI 13–16 kg/m2)(Reference Collins3). However, our study had insufficient numbers of individuals with MUAC < 18·5 cm to determine if this was true in our population. Additionally, Table 3 shows a cut-off of MUAC < 19·0 cm has a sensitivity of only 4 % in our population for those with BMI < 16 kg/m2, meaning it would identify very few severely thin individuals.
In some situations, especially in emergency scenarios, the red group may still be useful without weight measurement. In our dataset, 163 detainees were classified into the red group out of 11 917. Of those 163 detainees in the red group, fifty-nine will have BMI < 16 kg/m2, sixty-five have BMI 17–18·5 kg/m2 and thirty-nine over 18·5 kg/m2. Thus, out of a sample of 11 917 detainees, only thirty-nine would receive unnecessary treatment. Thus, this number of extra cases would not overload the programme while saving a lot of time while screening.
It should be noted that in the paediatric population, weight-for-height (similar to BMI in the under 5 years age group) and MUAC are known to identify different groups of children at risk for morbidity and mortality secondary to malnutrition. Currently, among adults, there are few studies associating MUAC directly to morbidity and mortality. One study by Navarro-Colorado in Burundi and Congo found that BMI was a superior predictor of mortality compared with MUAC(Reference Navarro-Colorado17). Given these limitations, our study focused on using MUAC as a proxy for BMI cut-offs known to be associated with morbidity and mortality. Our proposed schema uses MUAC to reduce the number of detainees requiring full BMI screening while allowing the highest risk detainees to proceed more quickly to treatment. In the future, it will be important to collect follow-up data to track the clinical course of individuals treated for thinness to assess the association between MUAC, BMI, and morbidity and mortality. This is particularly the case given the 5·4 % of detainees with BMI < 16 kg/m2 in our analysis who were incorrectly classified as being healthy. Future work will need to determine whether individuals with a low BMI but higher MUAC are at increased risk for morbidity and mortality.
Compared with previous literature presented in Table 1, our 25·5 cm MUAC cut-off for any thinness (BMI < 18·5 kg/m2) is higher than all proposed except the 25·1 cm cut-off proposed by Sultana et al. (Reference Sultana, Karim and Ahmed11). The reason for this is likely two-fold. First, because our approach does not seek to eliminate the use of BMI, we placed more emphasis on ruling out low-risk patients with the knowledge that we would still measure BMI among those identified by our upper cut-off. Second, our data show a different relationship between BMI and MUAC compared with that in other studies. Specifically, our results differ significantly from the recently published individual-level meta-analysis by Tang et al. that proposed a possible cut-off of 24·0 cm for identifying individuals with any thinness(Reference Tang, Chung and Dong4,Reference Tang, Chung and Dong5) . In their initial analysis, among males, a cut-off of 24·0 cm had sensitivity 72·8 % for any thinness(Reference Tang, Chung and Dong4). When we applied this to our data, this cut-off would only have a sensitivity of 45·2 %. Even allowing for minor differences in methods, this is a large discrepancy. Because we were unable to replicate their results, we feel further justified in our conservative approach of focusing on using MUAC to reduce the number of detainees who require full BMI screening. This discrepancy also further amplifies the need to examine a direct association between MUAC and morbidity and mortality.
Our study’s strengths include that it uses the largest known dataset examining the association between MUAC and BMI among adults in low- and middle-income countries. Additionally, our proposed schema allows for immediate practical use of MUAC in the field, while more data are collected on MUAC’s relationship to morbidity and mortality.
Our study has several limitations. First, our data were collected for programmatic use and monitoring rather than research and may be of lower quality than elsewhere in the literature. Second, there is limited generalisability: Our study population is large but is only among adult male detainees in sub-Saharan Africa; therefore, we are unable to assess whether our proposed cut-offs would be reliable in other populations, either by gender or by geographic location. For example, males are known to have higher average MUAC than females, and thus our proposed cut-offs likely would perform differently among females(Reference Tang, Chung and Dong4,Reference Tang, Chung and Dong5,Reference Sultana, Karim and Ahmed11) . In their recent meta-analysis, Tang et al. found that MUAC had higher sensitivity in females compared with males(Reference Tang, Chung and Dong5).
Third, we have no data assessing co-morbidities among our patient population or their previous nutritional history and body mass. There may be considerable heterogeneity between countries and detention locations in the prevalence of other diseases that may influence nutritional status. Fourth, an additional limitation is that relatively few detainees in our sample had MUAC < 19·0 cm limiting our ability to accurately evaluate lower cut-offs. Fifth, our data are cross-sectional, meaning, for example, that we are unable to assess if detainees with low MUAC but normal BMI would eventually become thin. There is the possibility of selection bias in our sample. Each detainee can refuse to be screened, and thus healthy detainees or those that have additional resources might choose not to participate. Finally, our data may underrepresent the number of detainees with very severe thinness if they were not healthy enough to have their BMI measured.
In conclusion, we propose a 25·5 cm cut-off to identify adult male detainees in sub-Saharan Africa at risk for thinness and exclude those most likely to be healthy from further assessment. We also propose a cut-off of 21·0 cm, which may be useful in conjunction with a weight of 50 kg to identify those who may immediately proceed to treatment.
Acknowledgements
Acknowledgements: None. Financial support: This research received no specific grant from any funding agency, commercial or not-for-profit sectors. Conflict of interest: There are no conflicts of interest. Authorship: D.C.E.P. developed the research plan, analysed data and prepared the initial draft of the manuscript and was responsible for its final content. M.V. conceived of the original study, prepared the data for analysis, and contributed to the manuscript and was responsible for its final content. V.B.-B. provided the data and contributed to the manuscript. Ethics of human subject participation: This study was conducted according to the guidelines laid down in the Declaration of Helsinki and all procedures involving research study participants were approved by the Centers for Disease Control and Prevention as well as the Research Ethics Committee of the Canton of Geneva Switzerland. Because the data were completely deidentified, CDC determined the activity was non-human research involving anonymous data collected for other purposes. ICRC presented the research to the Research Ethics Committee of the Canton of Geneva Switzerland that confirmed that analysis of the monitoring data did not require formal review.
Supplementary material
For supplementary material accompanying this paper visit https://doi.org/10.1017/S1368980021002913


