


Linear growth, an important indicator of a child’s present and future health, is influenced by a complex interaction of environmental factors including intra-uterine growth restriction, household socio-economic status, parental education levels, inadequate maternal and child nutrition and frequent infections(Reference Roth, Leung and Mesfin1,Reference Victora, Adair and Fall2) . Global estimates (most recently from 2019) suggest that over 149 million children under the age of 5 are stunted(Reference Keats, Das and Salam3). According to the 2017–2018 Bangladesh Demographic and Health Survey, indicators of malnutrition among children under 5 years of age declined between 2007 and 2018, with the most recent prevalence estimates for stunting in children at 31 %, 22 % for underweight and 8 % for wasting(Reference Khan, Oldroyd and Chowdhury4).
Se is an essential trace element that is known for its role in redox biology(Reference Combs5). Due to adaptive changes in Se metabolism that occur during pregnancy, requirements are higher given its role in fetal growth, which manifests as lower maternal concentrations of blood Se(Reference Atazadegan, Heidari-Beni and Riahi6). Concentrations of this trace element are known to fall during pregnancy, with lowest levels observed at delivery(Reference Mistry, Kurlak and Young7,8) . Levels are lower because of increased fetal demands and alterations in intestinal absorption or renal handling(Reference Mistry, Kurlak and Young7,8) . Reduced Se concentrations can have an adverse impact on antioxidant selenoproteins, which compromise protection against placental oxidative stress during pregnancy, negatively impacting fetal growth(Reference Mistry, Kurlak and Young7).
Se is known to play a protective role in many birth outcomes(Reference Mariath, Bergamaschi and Rondó9). A recent meta-analysis found that umbilical cord blood Se concentrations (r 0·08, 95 % CI 0·01, 0·16) are correlated with birth weight, although similar results were not observed for associations between maternal blood Se and birth weight(Reference Atazadegan, Heidari-Beni and Riahi6). Other studies have demonstrated significant relationships between low birth weight (LBW) and lower Se concentrations(Reference Atazadegan, Heidari-Beni and Riahi6). Mechanisms for the associations between birth weight and Se remain unclear; however, its antioxidant properties play an important role in placental development and oxidative balance(Reference Atazadegan, Heidari-Beni and Riahi6). Lower Se levels are likely associated with reduced function of glutathione peroxidase, an antioxidant enzyme involved in protecting the placenta and fetus from oxidative stress(Reference Combs5,Reference Burk and Hill10) . In a similar manner, SEPP1 (selenoprotein P) is a selenoenzyme glycoprotein that protects against adverse pregnancy outcomes which can have an impact on fetal growth(Reference Combs5,Reference Burk and Hill10) . Se levels may also be correlated with small-for-gestational age (SGA) status; mechanistically, these associations may function via reductions in glucose levels which subsequently impact fetal weight(Reference Bizerea, Dezsi and Marginean11). Lower placental glutathione peroxidase activity has been observed in women with SGA compared with controls(Reference Lewandowska, Sajdak and Lubiński12). Due to the effects of lowered Se levels and decreased glutathione peroxidase activity during pregnancy, placental antioxidant defence may be reduced which in turn may impact fetal growth, resulting in adverse birth outcomes including growth restriction and SGA(Reference Lewandowska, Sajdak and Lubiński12). A comprehensive schematic of placental to fetal transfer of various selenometabolites and Se metabolism in the human body is presented in online Supplementary Fig. 1.
In addition to the effects of Se on birth weight and birth outcomes, this micronutrient also plays an essential role in bone growth and development. Se inadequacy has been implicated in growth faltering and changes in bone metabolism which can impact bone and cartilage development(Reference Cao, Gregoire and Zeng13–Reference Zeng, Cao and Combs15). Expression of selenoproteins by bone cells can contribute to protection against oxidative stress in the microenvironment of the bone(Reference Zeng, Cao and Combs15). Se deficiency impacts bone formation and resorption, whereby the effects of Se on bone are mediated through reduced antioxidative capacity, accumulation of reactive oxygen species, reduced osteoclast activation and osteoblast differentiation(Reference Gaffney-Stomberg16). Furthermore, Se deficiency is known to impact cartilage and can reduce bone mineral content, as described in human and animal studies(Reference Cao, Gregoire and Zeng13,Reference Moreno-Reyes, Egrise and Nève14,Reference Gaffney-Stomberg16) .
Se metabolism and use in the bone are exclusively associated with selenoproteins. A total of nine selenoproteins have been identified in human fetal osteoblasts where they play a role in bone metabolism(Reference Zeng, Cao and Combs15). SEPP1 is the primary transporter and storage selenoprotein from the liver to bones, where the Lrp8 receptor facilitates SEPP1-mediated Se uptake, particularly under conditions of Se deficiency(Reference Pietschmann, Rijntjes and Hoeg17,Reference Zhang, Zhang and Xiao18) . Se therefore plays an important role in bone physiology and is tightly regulated by SEPP1 receptor, apolipoprotein receptor 2. Expression of this receptor is significantly influenced by SEPP1 levels in a negative feedback loop(Reference Zhang, Zhang and Xiao18). Genetic ablation of SEPP1 has been shown to reduce serum Se concentrations by 25-fold but only reduces bone Se levels by 2·5-fold, suggesting a protective effect(Reference Zhang, Zhang and Xiao18).
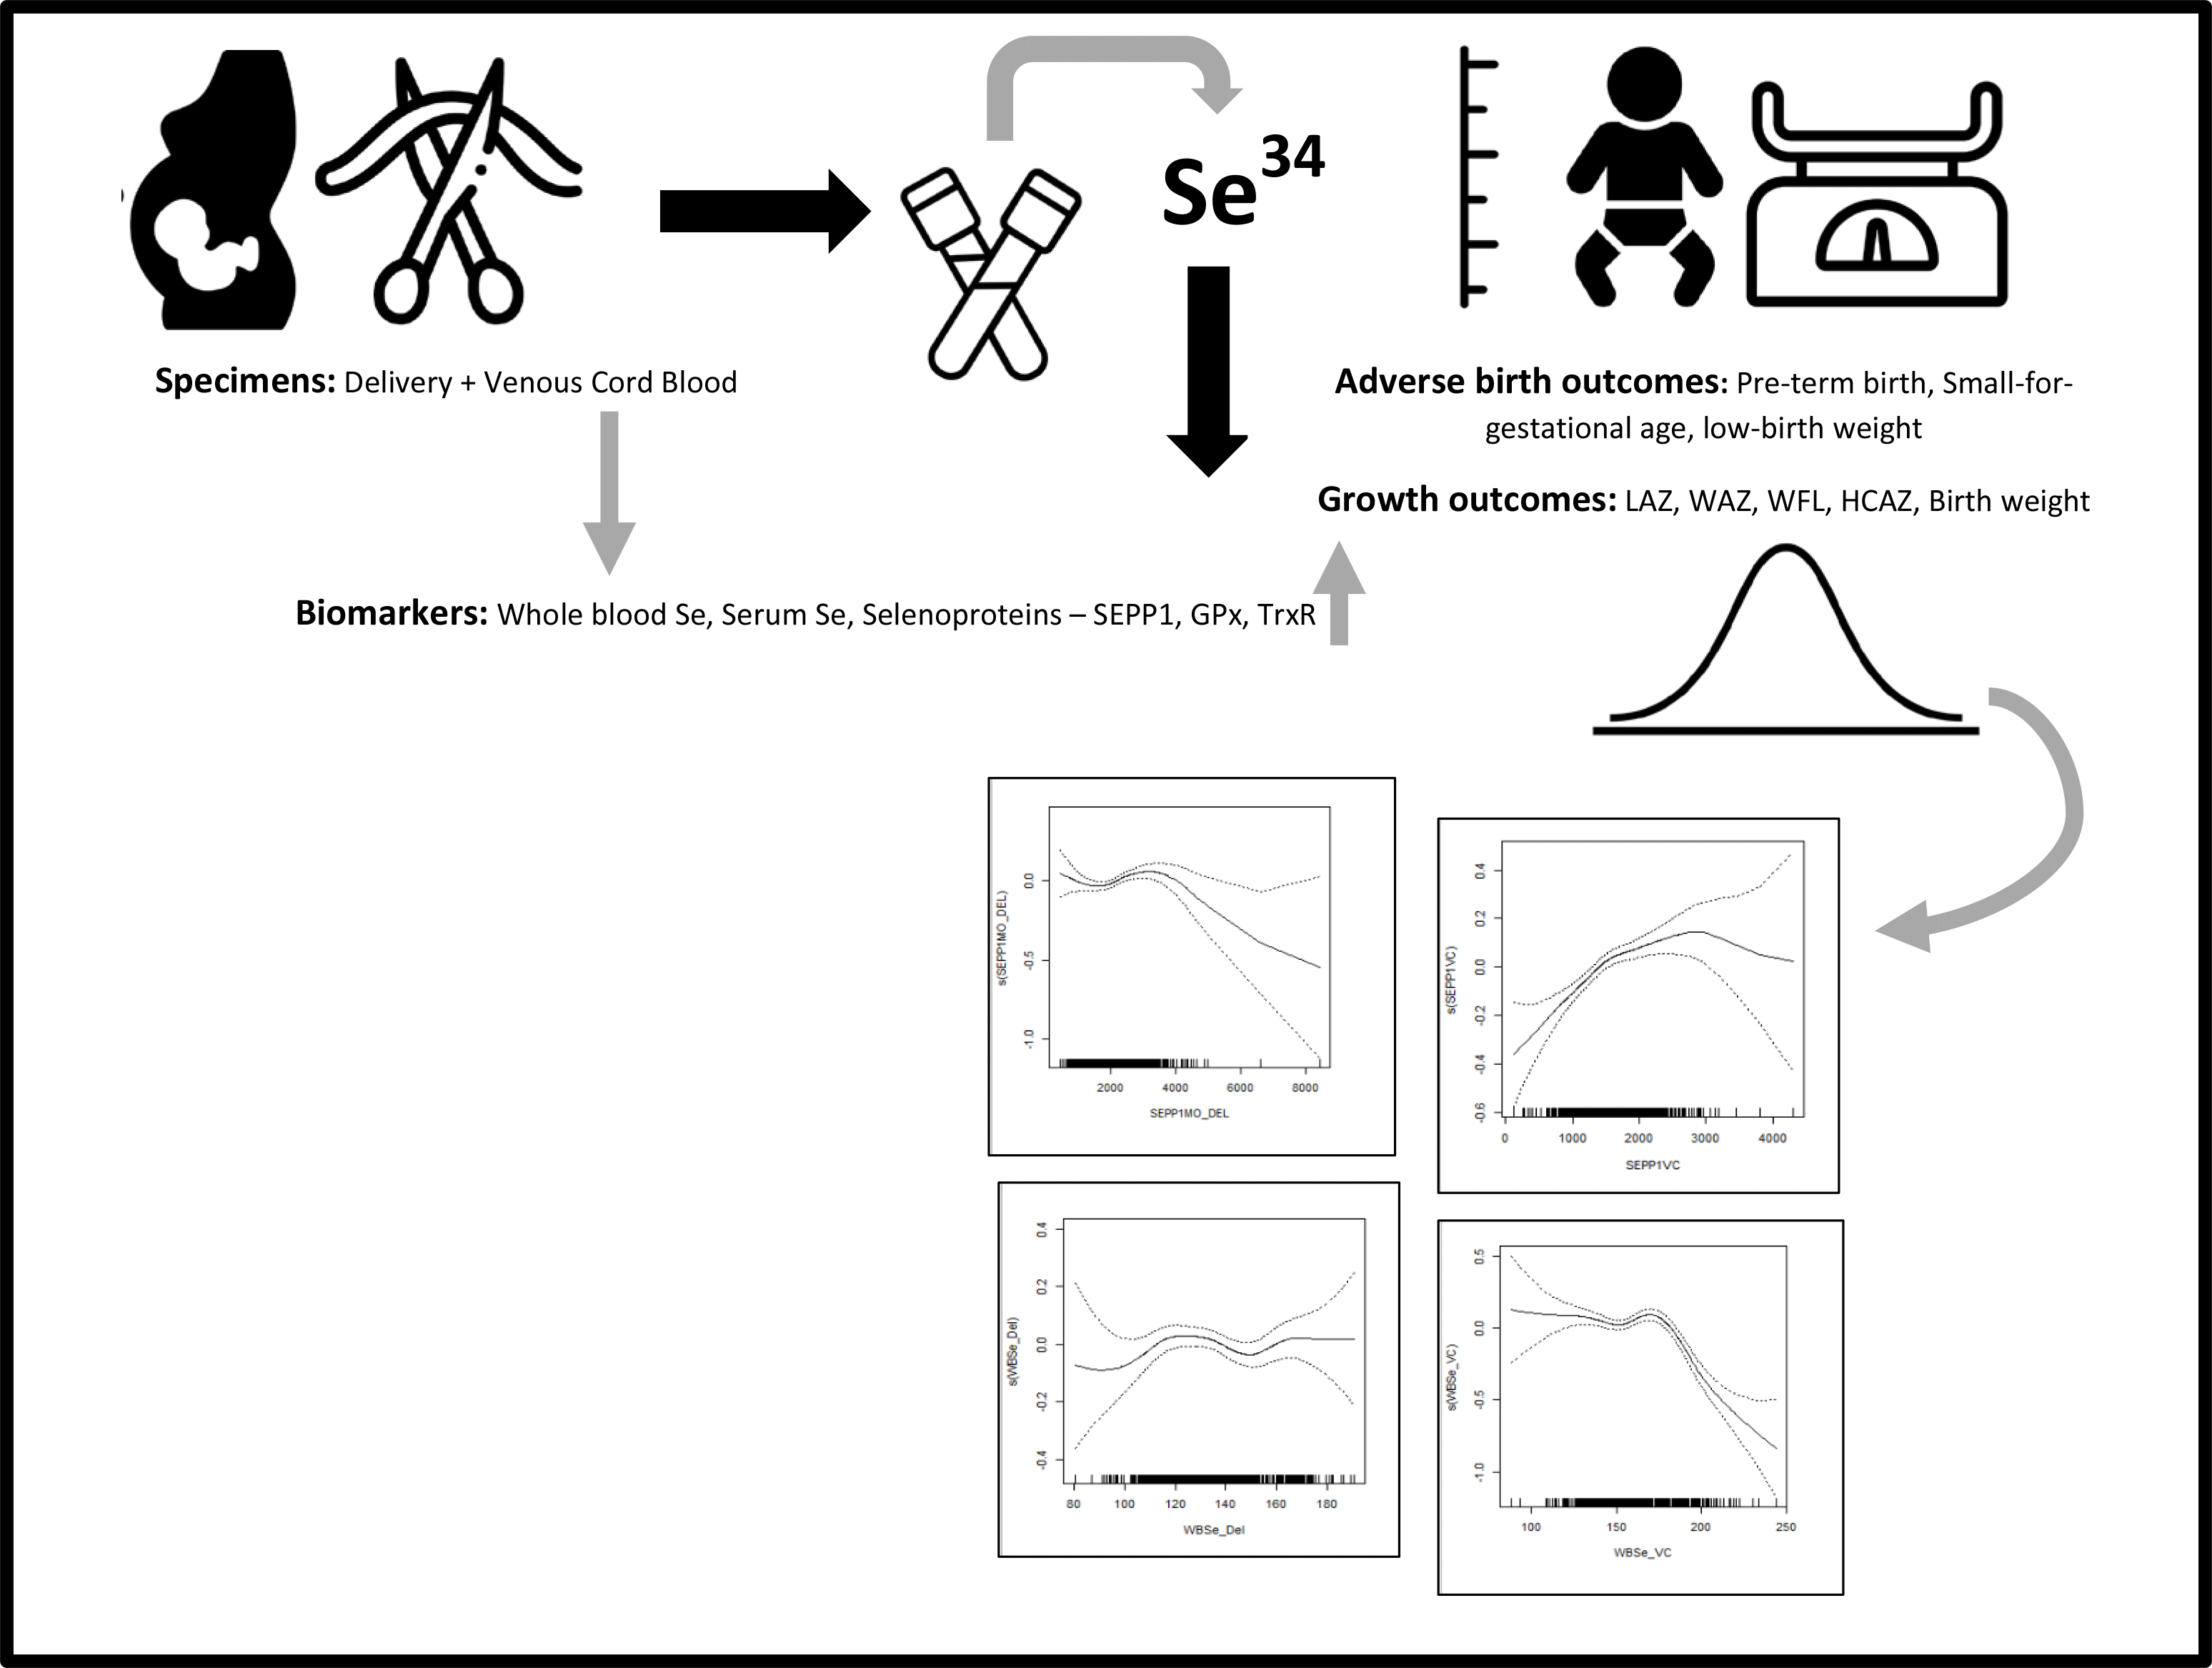
Studies have examined associations between Se levels in mother–infant dyads and growth outcomes at birth and in the postnatal period(Reference Atazadegan, Heidari-Beni and Riahi6,Reference Mariath, Bergamaschi and Rondó9,Reference Guo, Zhou and Xu19) . Given the mixed body of evidence on the association of Se with birth weight and infant growth outcomes, we sought to understand whether Se status measured in maternal and infant whole blood (WBSe), serum (serum Se) and a biomarker of functional status, SEPP1, at delivery and in venous cord (VC) blood is correlated with infant birth weight, growth outcomes (length-for-age z-score (LAZ), weight-for-age z-score, weight-for-length z-score and head circumference-for-age z-score) at birth, in infancy and up to 2 years of age. Our study will add to a growing body of evidence on the role Se may play in in utero and postnatal infant growth and development.
Methods
Study area and subjects
We used observational Se biomarker data collected as part of double-blinded, dose-varying, placebo-controlled, randomised trial of the effect of maternal vitamin D3 supplementation during pregnancy and lactation conducted in Dhaka, Bangladesh for this secondary analysis. Details of the parent study (NCT01924013) are described elsewhere(Reference Roth, Morris and Zlotkin20). Briefly, a total of 1300 women, 18 years of age and older, with uncomplicated singleton pregnancies were enrolled between 17 and 24 weeks of gestation and randomised into one of five treatment groups (treatment group A = 0 μg/week during pregnancy and postpartum, treatment group B = 4200 μg/week during pregnancy and placebo postpartum, treatment group C = 16 800 μg/week during pregnancy and placebo postpartum, treatment group D = 28 000 μg/week during pregnancy and placebo postpartum and treatment group E = 28 000 μg/week during pregnancy and postpartum).
Exclusion criteria included high risk pregnancies, women who had pre-existing medical conditions or those who were taking medications that could put them at risk of vitamin D sensitivity, altered vitamin D metabolism and hypercalcaemia. Additional details are provided elsewhere(Reference Roth, Morris and Zlotkin20).
Inclusion of participant samples for this secondary analysis was based on availability of at least one measurement of Se and/or selenoproteins at delivery in mothers or in VC blood of neonates. Infants for whom length and weight were not measured at birth or 12 months were excluded.
Se was measured as part of a panel of metals and minerals for which the primary study intent was to examine effects of vitamin D supplementation on heavy metal concentrations(Reference Jukic, Zuchniak and Qamar21). Samples selected for Se quantification were not related to vitamin D treatment group, and seasonal imbalances in specimen collection were observed for those selected to be a part of the sub-study(Reference Jukic, Zuchniak and Qamar21). Additional socio-demographic characteristics of study participants were recorded using standardised data collection forms.
Blood collection
Maternal and VC blood samples were collected at delivery by trained phlebotomists. Trace metal-free EDTA-coated tubes were used to draw maternal samples, and whole-blood aliquots were drawn prior to centrifugation. Cord blood was collected within 30 min of delivery from a site on the umbilical cord attached to the placenta after wiping maternal blood away with dry gauze. The umbilical vein was cannulated to collect blood into a lavender top EDTA tube. Whole blood was stored at −70°C or colder.
Measurement of selenium biomarkers
Whole blood and serum Se were measured at the US Centers for Disease Control and Prevention (CDC). WBSe was measured at delivery and in VC blood using inductively coupled plasma MS(Reference Parsons22). The lower limit of detection for this assay was 24·5 µg/l. Serum Se was measured at delivery using inductively coupled plasma-dynamic reaction cell-MS as described by Caldwell(Reference Caldwell23). The lower limit of detection was 4·5 µg/l. No dilution factors were applied for these assays. Plasma SEPP1 was measured at delivery and in VC blood using a Selenotest ELISA colorimetric assay (STE, InVivo BioTech Services) performed at the Hospital for Sick Children. The lower limit of detection for the assay was 267·3 µg/l, with a 33-fold dilution factor applied and intra and inter-assay CV measured at 4·5 and 10·1 %, respectively. At least one Se biomarker was measured in a sub-sample of 1021 specimens collected from mothers or infants for inclusion in this study(Reference Jukic, Zuchniak and Qamar21).
Outcome assessment
Details of outcome assessment have been elaborated on elsewhere(Reference Roth, Morris and Zlotkin20). In brief, head circumference, length and weight were measured by trained professionals using standardised procedures adapted from the INTERGROWTH-21st (International Fetal and Newborn Growth Consortium for the 21st Century) Project(Reference Villar, Altman and Purwar24). Infant length was measured using a ShorrBoard. Infant weight was measured using a digital scale. Length and weight were measured at birth, during visits at 1–2 months, 3, 6, 9, 12, 15, 21 and 24 months of age. For the purposes of our study, growth outcomes were assessed at birth, 12 and 24 months of age.
Two independent personnel measured each child, and repeated measurements were taken. Measurements that differed between the two personnel by 7 mm for length or 50 g for weight were taken again. Means of the final pairs were used in further analysis. Inter-rater reliability was high. Length, weight and weight-for-length, BMI and head circumference were converted to age standardised z-scores using INTERGROWTH-21st standards for newborn size, postnatal growth standards for preterm infants to 64 weeks of postmenstrual age (weight, length and head circumference only) or WHO child growth standards, as appropriate(Reference Villar, Altman and Purwar24). All outcome variables were modelled continuously. We also examined three birth outcomes, namely LBW, classified as birth weight < 2500 g, and SGA, defined as birth weight below the 10th percentile of gestational age- and sex-matched healthy reference population, as dichotomous outcomes(Reference De Onis and Habicht25). Preterm birth (PTB) was defined as gestational age at birth less than 37 weeks(Reference Goldenberg, Culhane and Iams26).
Covariates
Covariates adjusted for in models included infant characteristics, such as sex, gestational age at birth and season of birth, and maternal characteristics including age, education, height, BMI, gravidity, vitamin D treatment group, daily protein intake (kg), urinary cotinine levels, maternal smoking and tobacco use during pregnancy, C-reactive protein concentrations at delivery and household asset index.
Gestational age was estimated at the time of enrolment using a combination of the last menstrual period and ultrasound. Smoking status was described using urinary cotinine levels, where women with cotinine ≤ 50 ng/ml were classified as non-smokers and women with levels > 50 ng/ml were classified as smokers(Reference Kim, Seo and Kim27). An asset index was derived using principal component analysis on baseline household characteristic data collected on ownership of various assets, where each participant was assigned an asset score (lower scores reflect less wealth)(Reference Roth, Morris and Zlotkin20). The asset index was categorised into quintiles.
Statistical analysis
All analyses were conducted using SAS 9.4 (SAS Institute). A P-value < 0·05 was considered statistically significant. Descriptive statistics were generated for all outcome variables (growth indices) and Se biomarkers as means and standard deviations, median (inter-quartile range) depending on the shape of variable distributions. Bivariate correlations between all Se biomarkers were evaluated using Spearman correlation coefficients.
We assessed normality of all variables in this analysis using histograms and kernel density plots in order to determine their distribution. Outliers were flagged and examined to determine their biological plausibility, using box plots. Data for this secondary analysis were restricted to those participants with any one of the Se biomarkers in maternal delivery or VC specimens for which a growth measure was also available, as presented in Fig. 1.

Fig. 1. Sample size chart for maternal and cord Se biomarkers included in the analysis of associations with growth outcomes. LAZ, length-for-age z-score; WAZ, weight-for-age z-score; WFL, weight-for-length; HCAZ, head circumference for age z-score; LBW, low birth weight; SGA, small for gestational age.
We used linear regression and generated bivariate and multivariable models adjusting for covariates after generating directed acyclic graphs to account for hypothesised confounding and biological plausibility of associations. Biomarkers were scaled by a unit of 10 for whole blood and serum Se and unit of 1000 for SEPP1. Sensitivity analyses were conducted after including urinary cotinine as a covariate in adjusted models.
We also examined associations between selenoproteins glutathione peroxidase and thioredoxin reductase measured in maternal plasma at mid-gestation (17–24 weeks) and delivery and growth outcomes using linear regression, associations with birth weight, specifically (presented in online Supplementary Tables 1 and 2). Multicollinearity between predictors and covariates in models was assessed using variance inflation factors, and tolerance and collinearity using ‘proc reg’.
Selenium biomarkers and birth outcomes
Descriptive statistics for n (%) of children who were SGA, LBW and PTB in this sample were also examined. We conducted additional analyses to examine associations between SGA, LBW and PTB as dichotomous outcomes using modified Poisson regression with robust standard errors to estimate risk ratios for associations between birth outcomes and Se biomarker concentrations in unadjusted and adjusted models.
Mediation analysis
In addition to linear models for growth outcomes, we conducted mediation analyses using observed variables to explore potential causal pathways for associations between cord WBSe and SEPP1 and weight at birth (birth weight and weight-for-age z-scores (WAZ)) and 1 year of age. We hypothesised that SEPP1 may mediate the association between WBSe in VC blood and WAZ/birth weight. We modelled both endogenous (outcome) and exogenous (predictor) variables continuously in structural equation modelling path analysis(Reference Kline28). Mediation path analyses were conducted using ‘proc calis’ in SAS 9.4 and verified in RStudio using the ‘sem’ function. We examined direct, indirect and total effects. Model fit was assessed using fit statistics including standardized root mean square residual (SRMR) (< 0·08), root mean square error of approximation (RMSEA) (< 0·08), χ 2 (P-value > 0·05), comparative fit index (CFI) (≥ 0·90), goodness of fit index (GFI) (≥ 0·95) and Tucker-Lewis index (TLI) (≥ 0·95) and benchmarked based on established criterion(Reference Parry29). We did not adjust for covariates in path analyses, and results are presented as standardised estimates.
Longitudinal models and generalised additive models
We applied a gate-keeper approach to assess longitudinal associations between growth outcomes and Se biomarkers based on significant associations observed in cross-sectional linear analyses at ages 0, 1 and 2 years. We used unadjusted multilevel models of change (‘proc mixed’) to assess whether relevant Se biomarkers in VC blood predicted a change in growth-z-scores between 0 and 3 years based on the availability of anthropometric data. We also used generalised additive models (‘proc gam’) to examine smoothing splines for predicted associations between Se biomarkers and relevant measures of growth.
Results
Participant characteristics
A detailed description of analytical sample sizes across growth outcomes in our study of mother–infant dyads is presented in Fig. 1, for three timepoints, namely birth, 12 months and 24 months of age. Given the distribution of observations with available Se biomarkers, our sample sizes ranged between 435 and 780 for these analyses across growth outcomes. On average, mothers were 23 years of age (sd 4), a majority were educated at a secondary school level or higher, median gestational age at birth was 39 weeks (inter-quartile range 2) and mean birth weight across our sample was 2724 (sd 354) g, with close to 46 % of children categorised as SGA, approximately 25 % were LBW (< 2500 g) and 8 % were born before 37 weeks of gestation (Table 1). A small proportion of our sample was below the threshold (< 100 µg/l) for WBSe in maternal delivery and VC specimens (2·6 % and 0·2 %, respectively), and 83·4 % of specimens were below threshold for serum Se at delivery (< 80 µg/l) and 0·2 % of the sample was classified as deficient (< 30 µg/l). Se biomarker concentrations are presented in Table 2.
Table 1. Socio-demographic characteristics and Se status of women and children in the study sample
(Mean values and standard deviations; medians and inter-quartile ranges; numbers and percentages)

SEPP1, selenoprotein P.
* Whole blood Se < threshold (< 100 µg/l), serum Se < threshold (< 80 µg/l), serum Se deficiency (< 30 µg/l), no thresholds exist for SEPP.
† Biomarker concentrations are un-scaled, sample sizes represent age at birth (up to 1-d postpartum) and maximum observations with Se biomarkers available.
‡ Sample sizes do not correspond to totals for biomarker concentrations, observations without corresponding Se biomarkers are excluded.
§ All values are presented as mean (sd) unless indicated otherwise.
Table 2. Se biomarker concentrations at delivery and in infant venous cord blood
(numbers and percentages; mean values and standard deviations)

SEPP1, selenoprotein P; IQR, inter-quartile range.
* WBSe above threshold defined as concentrations ≥ 100 µg/land serum Se ≥ 80 µg/l.
† Deficiency defined as serum Se < 30 µg/l.
Spearman correlation coefficients for associations between delivery and VC Se biomarkers in our analyses are described in Table 3. We found small to moderate correlations between Se biomarkers at delivery and in VC blood, with the exception of SEPP1 and WBSe where associations were non-significant (WBSe Del and WBSe VC: ρ = −0·00001, P = 0·9; SEPP1 Del and WBSe VC: ρ = 0·03, P = 0·6) in both specimen types.
Table 3. Spearman correlation coefficients (ρ) for maternal delivery and venous cord Se biomarkers

WBSe, whole blood selenium; SEPP1, selenoprotein P; VC, venous cord.
Modelling analyses
Linear regression analyses are presented for unadjusted and adjusted associations between Se biomarkers and growth outcomes in Table 4.
Table 4. Linear and longitudinal regression analyses for associations between Se biomarkers and growth outcomes
(95 % confidence intervals)

WBSe, whole blood selenium; SEPP1, selenoprotein P; LAZ, length-for-age z-score; WAZ, weight-for-age z-score; WFL, weight-for-length; HCAZ, head circumference for age z-score; CRP, C-reactive protein.
* WBSe scaled to represent the change in anthropometric outcome for every 10 µg/l increase in WBSe. Serum Se scaled to represent the change in anthropometric outcome for every 10 µg/l increase in serum Se. SEPP1 scaled to represent the change in anthropometric outcome for every 1000 µg/l increase in SEPP1.
† Models adjusted for infant sex, gestational age at birth, season of birth, maternal age, maternal education, maternal height, maternal BMI, gravidity, vitamin D treatment group, delivery CRP, asset index quintiles, daily protein intake (kg), smoking and tobacco use during pregnancy.
‡ No multi-collinearity problem was detected in models – assessment was conducted after generating directed acyclic graphs based on conceptual frameworks developed a priori.
§ Longitudinal analysis only conducted where unadjusted linear regression associations were significant for at least two of three age points.
Whole blood selenium and growth outcomes
We examined associations between WBSe and birth weight among infants in our sample. We found negative associations between delivery WBSe and birth weight in unadjusted models, where per scaled unit increased in WBSe, birth weight decreased by 10 g, although results were not statistically significant.
Likewise, we found null associations (risk ratio: 1·03, 95 % CI: 0·96, 1·1) for LBW per unit (g) increase in maternal delivery WBSe in unadjusted models, with increased risk (12–15 %) after accounting for confounders.
In line with our findings for maternal delivery WBSe, we found estimates for associations between VC WBSe and birth weight to be significant with effect estimates suggesting a decrease in birth weight of between 24 and 27 g per unit increase in Se, between unadjusted and adjusted models. Results for risk of LBW were in concordance with our findings for birth weight, with a 6–11 % increased risk of the outcome per unit increase in WBSe in cord blood as presented in Table 5. We found a non-significant yet increased risk of SGA status per unit increase in WBSe in maternal blood at delivery and in VC blood. Similarly, we found higher risk for SGA with adjusted models showing significant risk ratios (7–10 % increase per unit increase in VC WBSe).
Table 5. Modified Poisson regression analyses (risk ratios) for associations between maternal delivery and venous cord Se biomarkers and adverse birth outcomes
(95 % confidence intervals)

WBSe, whole blood selenium; SEPP1, selenoprotein P.
* WBSe scaled to represent the change in anthropometric outcome for every 10 µg/l increase in WBSe. Serum Se scaled to represent the change in anthropometric outcome for every 10 µg/l increase in serum Se. SEPP1 scaled to represent the change in anthropometric outcome for every 1000 µg/l increase in SEPP1.
† Models adjusted for infant sex, season of birth, maternal age, maternal education, maternal height, maternal BMI, gravidity, vitamin D treatment group, delivery CRP, asset index quintiles, daily protein intake (kg), smoking and tobacco use during pregnancy.
Associations between LAZ and WBSe in maternal delivery samples were not significant, although we found small negative associations between WBSe in VC blood and LAZ at birth, 12 and 24 months of age. Although effect estimates for associations between WBSe in maternal delivery samples and LAZ were small and in the negative direction, we did not find statistical significance across analyses for WBSe and growth outcomes across age time points. For associations between WBSe in VC blood and LAZ, we found small negative effect estimates across unadjusted models at birth, 1 year and 2 years of age. Although mildly attenuated after adjustment, associations between WBSe in VC blood and LAZ were no longer significant, or in sensitivity analyses, after adjusting for cotinine (online Supplementary Tables 3 and 4). In longitudinal analyses, we found mean LAZ at birth to be −0·12 (SE 0·27), P = 0·27, not significantly different from 0. Average change in LAZ as children age, per unit increase in VC WBSe was −0·004 (SE 0·0017), P = 0·019 (Akaike Information Criterion (AIC): 7392·3, Bayesian Information Criterion (BIC): 7416·2), which suggests that this form of Se has a marginal and non-significant association with linear growth.
Associations between WAZ and delivery WBSe, although similar in magnitude to those observed for LAZ, were not significant in unadjusted models; however, effect estimates increased marginally, and significance was achieved after adjustment and in sensitivity analyses with cotinine. We found small negative associations between WAZ and WBSe in VC at birth in unadjusted and adjusted models. Overall trends ran in the same direction across unadjusted and adjusted models for other growth outcomes including weight-for-length and head circumference for age z-scores.
Serum selenium and growth outcomes
In line with our observations for WBSe, we found similar trends for associations between serum Se at delivery and growth measures, although associations were small and non-significant. Risk ratios were also higher for SGA and LBW per unit increase in serum Se concentrations. Similar to results for WBSe, associations between serum Se and birth weight were also negative and large in magnitude (3–28 g decrease in birth weight per unit increase in serum Se), although these findings were not significant and confidence intervals for effect estimates were wide.
Selenoprotein P and growth outcomes
SEPP1, unlike serum and WBSe, showed positive associations with infant birth weight in unadjusted and adjusted models, although results for statistical significance were not consistent across models. Based on our findings, a per unit increase in VC blood SEPP1 was associated with a large increase in birth weight, with estimates ranging between 43 and 82 g between unadjusted and adjusted models. Risk for LBW in our analyses was marginal, with WBSe in VC blood suggesting a protective effect per unit increase in concentrations, although results were non-significant.
We did not see significant or consistent associations between LAZ at any age time point and SEPP1 in maternal delivery plasma samples in unadjusted models. We did observe small positive increases in LAZ scores in adjusted models at birth when examining SEPP1 concentrations in VC blood, and associations were significant after accounting for covariates in adjusted models. Effect estimates suggest a stronger association between VC SEPP1 and LAZ at birth up to 2 years of age. These associations, although similar in magnitude, were not significant at 12 and 24 months of age.
Non-significant positive associations were observed between WAZ and SEPP1 in maternal delivery samples at birth. Significant associations were observed between SEPP1 in VC blood and WAZ. We used uncontrolled longitudinal hierarchical models and found a mean WAZ at birth to be −1·1 (SE 0·1), P < 0·001. Average change in WAZ as children age, per unit increase in VC SEPP1 was 0·0001 (SE 0·0001), P < 0·05 (AIC: 11 047·9, BIC: 11 083·5). These findings suggest a marginal protective effect of this form of Se on WAZ.
Weight-for-length and head circumference for age z-score were not associated with SEPP1 in maternal delivery and/or VC blood. We did note that the overall risk for SGA and LBW was marginally lower per unit increase in SEPP1 in both maternal delivery and VC blood; however, these relationships were not significant. Across the different biomarkers, we did note shifts in the direction of trends across the different age points at which growth outcomes were measured.
Mediation analyses and generalised additive model analyses
Results from mediation path analysis are presented in Fig. 2–4. Across path models, the indirect mediation effects, which represent the association of WBSe and weight-related growth outcomes, mediated through SEPP1, were extremely small and non-significant. We found small but significant direct effects between WBSe and SEPP1 in VC blood and growth outcome measures. Overall fit indices for all path models suggest statistical convergence and good fit.

Fig. 2. Mediation path analysis exploring associations between WAZ at birth and venous cord Se biomarkers. a,bUnadjusted direct and indirect effects in mediation analysis (n 402); total effect: β: −0·11 (0·05)*; indirect effect: β: 0·004 (0·006). cFit indices for models: χ 2:11·3, df: 3, P-value: 0·01; CFI: 1·00; TLI: 1·00; SRMR: 0·00; GFI: 1·00; RMSEA: 0·000 (overall model fit is good). *P < 0·05, **P < 0·01.

Fig. 3. Mediation path analysis exploring associations between birth weight and venous cord Se biomarkers. a,bUnadjusted direct and indirect effects in mediation analysis (n 402); total effect: β: −0·18 (0·05)***; indirect effect: β: 0·003 (0·01). cFit indices for models: χ 2:19·5, df: 3, P-value: 0·0002; CFI: 1·00; TLI: 1·00; SRMR: 0·00; GFI: 1·00; RMSEA: 0·000 (overall model fit is good). dUnstandardised estimates for path models (to compare β-estimates to linear regression models): 1 β: 0·03 (0·01)*; 2 β: 13·1 (29·8); 3 β: −26·9 (7·3)**. *P < 0·05, **P < 0·01, ***P < 0·001, ****P < 0·0001.

Fig. 4. Mediation path analysis exploring associations between WAZ at 12 months of age and venous cord Se biomarkers. a,bUnadjusted direct and indirect effects in mediation analysis (n 394); total effect β: −0·15 (0·05)**; indirect effect: β: 0·004 (0·006). cFit indices for models: χ 2:13·7, df: 3, P-value: 0·003; CFI: 0·00; TLI: 1·00; SRMR: 0·00; GFI: 1·00; RMSEA: 0·000 (overall model fit is good). *P < 0·05, **P < 0·01.
To examine dose–response relationships between LAZ and weight-for-age, we performed GAM analysis with Se biomarkers in maternal delivery specimens and VC blood. Figures are presented in online Supplementary Figures 1 and 2. We found consistent inverse U-shaped associations between LAZ, WAZ and SEPP1 in VC blood and similarly between growth z-scores and serum Se in delivery specimens.
Discussion
In this study of mother–infant dyads, we found measures of Se status in maternal delivery and VC blood serum, whole blood and plasma SEPP1 to be modestly associated with infant growth outcomes at birth, 12 months and 24 months of age, with variability in the strength and magnitude of associations across biomarkers and age points. Effect sizes in path analyses were negligible and do not suggest any mediation of the association between WBSe and WAZ at birth or 12 months, by VC SEPP1, likely because WBSe and SEPP1 have differing functions and therefore different impacts on weight and act as part of different metabolic pools that do not interact or share common pathways, as described in online Supplementary Fig. 3 (Reference Guillin, Vindry and Ohlmann30).
Several studies have examined the effects of Se in a variety of biological specimen types and their associations with infant growth outcomes(Reference Lewandowska, Sajdak and Lubiński12,Reference Guo, Zhou and Xu19,Reference Tsuzuki, Morimoto and Hosokawa31–Reference Solé-Navais, Brantsæter and Caspersen40) . A comprehensive comparative list of epidemiological studies is presented in Table 6. Overall concentrations of Se across biomarker types in our study were comparable to those described in the literature.
Table 6. Epidemiological studies examining associations between Se status during pregnancy, postpartum and in cord blood and birth/growth outcomes

SGA, small-for-gestational age; LBW, low birth weight; IUGR, intra-uterine growth restriction; IQR; inter-quartile range; GPx, glutathione peroxidase.
During pregnancy, Se progressively accumulates in fetal organs(Reference Zachara, Dobrzyński and Trafikowska41). Se is stored primarily in the liver of the growing fetus and is likely redistributed after birth, where concentrations in utero remain constant during gestation and decrease in line with stable Se concentration in other organs, during the months following birth(8). Transfer of SEPP1 from maternal blood to fetus is facilitated by Apo-ER2 mediated endocytosis. Selenomethionine containing proteins and SeMet also supply Se to the fetus(Reference Anan, Ogra and Somekawa42,Reference Burk and Hill43) .
In a recent review of studies conducted across a variety of different geographies, results of the association between Se and birth and growth outcomes have been mixed, although overall associations suggested a positive and protective effect of this micronutrient (pooled correlation coefficient between VC blood Se and birth weight; r 0·08, 95 % CI 0·01, 0·16 and maternal blood Se and birth weight; r 0·02 (–0·01, 0·05) on birth weight)(Reference Atazadegan, Heidari-Beni and Riahi6). In our study, we found a strong negative association between WBSe in VC blood and birth weight (β: –2·3, 95 % CI –3·7, –0·98, P-value: 0·001); however, the association between SEPP1 in VC and birth weight ran in the opposite direction (β: 0·04, 95 % CI –0·01, 0·1, P-value: 0·1). Thus, findings negate our hypothesis that SEPP1 may mediate the association between VC WB Se and weight-related outcomes (birth weight, WAZ at birth and at 1 year of age).
The negative association between WBSe in VC blood and birth weight may be a result of high Se exposure in utero. This can lead to oxidative stress, which in turn causes hypoxia and can impact fetal growth by reducing the distribution of oxygen in the placenta(Reference Wang, Qian and Wang44,Reference Zadrożna, Gawlik and Nowak45) . It is important to note that Se concentrations at levels classified as toxic were not detected in any of our specimens (> 400 µg/l)(Reference Hays, Macey and Nong46). Non-selenoprotein bound Se concentrations are known to be higher in the placentas of women who experience intra-uterine growth restriction and in mothers of preterm infants(Reference Mariath, Bergamaschi and Rondó9). These findings add further credence to our observations around the negative associations between WBSe and birth weight(Reference Zadrożna, Gawlik and Nowak45).
The protective antioxidant effects of Se bound to selenoproteins including SEPP1 may work to increase birth weight during gestation. This may explain the positive associations with birth weight as observed in our study, given the known antioxidant properties of selenoproteins, which can protect the fetus from free radicals in utero, modulate inflammation and protect biological membranes and DNA during early stages of embryo development(Reference Atazadegan, Heidari-Beni and Riahi6). As expected, a plateauing effect was noted in our results, for the association between WBSe and functional selenoprotein, SEPP1 in VC blood at WBSe concentrations of approximately 160 µg/l; however, no distinct plateauing was observed for associations with delivery biomarkers.
Mixed findings about the effects of varied biomarkers of Se status on placental development and growth-related outcomes, postpartum, may be explained by differences in bioavailability of organic and inorganic forms of the micronutrient(Reference Hays, Macey and Nong46). This is important because absorption of these forms of Se, once in the bloodstream, can impact distribution, partitioning and potential toxicity at high concentrations(Reference Hays, Macey and Nong46).
The primary mechanisms whereby Se has been associated with adverse growth outcomes include its essential role in antioxidant defence and its role in mediating oxidative stress, which could impact peri-natal morbidity and mortality(Reference Mariath, Bergamaschi and Rondó9). This in turn may impact risk of outcomes such as miscarriage, pre-eclampsia, gestational diabetes and intra-uterine growth restriction(Reference Mariath, Bergamaschi and Rondó9).
Low Se status, particularly in women, can impact the risk of PTB(Reference Mariath, Bergamaschi and Rondó9). Our results are in contrast to these findings however, where we found higher odds of PTB per unit increase in maternal delivery whole blood and serum Se and WBSe in VC blood(Reference Mariath, Bergamaschi and Rondó9). These findings were not significant after accounting for confounding variables. Associations have been noted between lower serum Se and PTB (OR: 2·0, 95 % CI 1·19, 3·47)(Reference Rayman, Wijnen and Vader47). On the other hand, the risk of PTB was lower per unit increase in SEPP1 in maternal delivery and VC blood specimens, although our results did not approach statistical significance.
Mechanistically, Se and PTB are linked because of the role this micronutrient plays in the body’s inflammatory response which can in turn cause ruptures to the fetal membrane(Reference Rayman, Wijnen and Vader47). Serum Se concentrations that surpass 80·5–86·9 µg/L can cause an attenuation in the odds of PTB(Reference Rayman, Wijnen and Vader47). We noted similar findings in our study, where we saw an attenuation in OR for the highest quintile of serum Se concentrations in our sample (OR: 1·3, 95 % CI 0·7, 2·4) compared with the lowest, and a decreasing trend in OR by increasing quintiles of serum Se.
Women at increased risk of miscarriage may also have lower serum Se concentrations, particularly during the first trimester of pregnancy(Reference Barrington, Lindsay and James48). Furthermore, cord blood Se concentrations are known to be significantly lower in premature infants when compared with neonates born at term(Reference Galinier, Périquet and Lambert49).
Similar to other birth-related outcomes, an increased risk for SGA has also been observed in relation to Se, likely driven by mechanisms associated with oxidative stress(Reference Mistry, Kurlak and Young50). We found a per unit increase in concentrations of several Se biomarkers to result in a small and non-statistically significant increase in the risk of SGA. It is likely that inflammation plays a role in our findings, given that median concentrations of C-reactive protein at delivery were 9 mg/l, which are higher than clinically defined thresholds for this acute phase protein (< 5 mg/l)(Reference Thurnham and Northrop-Clewes51). We have therefore adjusted our models to account for potential confounding. We noted an attenuation in the odds of LBW across quintiles of maternal serum Se at delivery, which suggest that higher concentrations of Se are associated with lower odds of LBW (OR: 0·89, 95 % CI 0·6, 1·4), which is consistent with other studies(Reference Zhang, Feng and Li39).
In our study, we found very small negative associations between WBSe in VC blood and LAZ across age time points, in unadjusted and adjusted linear models, although other Se biomarkers were not associated with LAZ. We observed small effect sizes that were not significant for associations between serum Se at delivery and LAZ. This was in line with the literature for maternal serum Se(Reference Guo, Zhou and Xu19,Reference Zhang, Feng and Li39) .
Linear growth has been implicated as a potential outcome of interest in relation to the role of Se in bone growth. Kashin–Beck disease is a chronic osteochondropathy known to result from inherited genetic polymorphisms in Se-related genes which impair collagen synthesis(Reference Huang, Shi and Lu52,Reference Zou, Liu and Wu53) . The syndrome is endemic to regions with low soil Se concentrations(Reference Huang, Shi and Lu52). A key feature of the condition is necrosis of chondrocytes in the growth plate of the bone and within the articular surface, which results in growth retardation and osteoarthritis(Reference Yao, Pei and Kang54,Reference Yamamuro55) . In this condition, Se status may modulate disease susceptibility because of its essential antioxidant activities. Three major environmental hypotheses have been postulated as part of the aetiology of the condition and include soil Se deficiency, contamination of cereals by mycotoxigenic fungi and high humic acid concentrations in the drinking water supply in endemic areas including China and Tibet(Reference Ren, Guo and Zhang56). In a clinical study conducted in Lhasa, Tibet, where Kashin–Beck disease is endemic and Se deficiency is common, authors found serum Se concentrations to be below detectable levels (< 5 µg/l) in 38 % of the study sample (n 521 subjects). Geometric mean concentrations of serum Se in this study sample for subjects who had Kashin–Beck disease were as low as 10·3 (5·1–20·8) µg/l. These values are significantly below those observed in our study from Bangladesh, where we found mean concentrations of maternal serum Se to be 69 (sd 13) µg/l at delivery. These findings suggest that severe Se deficiency may not be a problem in this Bangladeshi population (83·4 % of our sample was < 80 µg/l for serum Se at delivery and only 0·2 % were Se deficient (< 30 µg/l)).
It is important to note that effect estimates for other growth outcomes in our study were negligible in magnitude and therefore do not suggest that Se biomarkers measured in our study play a major role in birth and growth outcomes in this cohort of mother–infant pairs. We did however find meaningful and substantial effect sizes for the associations between birth weight and biomarkers of Se status. These associations should be investigated further given that different Se biomarkers may act differently on mechanisms of weight gain at birth and in early infancy.
Biomonitoring equivalents for toxic concentrations of Se in a variety of body fluids have been calibrated using various regulatory limits set by the Institute of Medicine (upper limits), USEPA (reference dose) and ATSDR chronic (minimum risk level) and were established using Chinese cohort data to define guideline levels to protect against selenosis(Reference Hays, Macey and Nong46). These values range between 400 and 480 µg/l in whole blood and 180 and 230 µg/l in plasma(Reference Hays, Macey and Nong46). In our sample, we found maximum levels of WBSe to range between 190·6 and 233·4 µg/l (∼50 % less than WB ranges) in delivery and VC blood and 110·3 µg/l (∼ 60 % less than WB ranges) in serum specimens, which do not suggest risk for toxicity due to selenosis in this population.
Evidence exists to suggest that Se has a U-shaped dose–response toxicity curve, with negative health impacts experienced due to deficiency and excess as is evidenced in our dose–response analyses as well(Reference Rayman57,Reference Moody, Colicino and Wright58) . Se deficiency may contribute to inflammation and pregnancy-related complications, via pathways associated with oxidative stress and may also be associated with growth retardation(Reference Mojadadi, Au and Salah59). At high concentrations, Se can become a pro-oxidant and cause cellular damage due to oxidative stress(Reference Mojadadi, Au and Salah59). In conclusion, we have found that Se may play an important role in placental health and the growth and development of infants and young children in the peri-natal and postpartum period, up to 2 years of age. Future studies should examine, in more detail, the role of Se in linear growth over the infant and young child life course, particularly in relation to its important known functions in placental preservation and birth weight.
Acknowledgements
We wish to thank Dr. Daniel E. Roth, PI of the MDIG Trial for providing conceptual inputs to this study, review of methods and results and access to the MDIG data. We thank Huma Qamar, Ulaina Tariq and the SickKids team for their contributions to methods and review of findings and overall contributions to the MDIG study as well as Jithin Sam Varghese for consultation on analytical methods. We wish to acknowledge the teams at ICDDR, B, and other MDIG collaborators in Bangladesh and internationally for all their contributions to the parent study. We also acknowledge the CDC for Se biomarker analyses. Finally, we extend our gratitude to the Bangladeshi mothers and children who participated in this study.
The parent MDIG study and analysis of Se in biological specimens were funded by the Bill & Melinda Gates Foundation. This secondary analysis was supported by the Postdoctoral Research Fellowship in Microbiome, Infections and Childhood Growth and Development through the Centre for Global Child Health, Hospital for Sick Children to RVM under the supervision of Dr. Daniel E. Roth.
R. M. and C. K. designed the study. R. M. conducted analysis and wrote the manuscript. D. H. H. provided conceptual inputs to this study and critical review of the manuscript. T. M. and A. A. M. acquired funding for and oversaw the implementation of the MDIG trial in Dhaka, Bangladesh. All authors have read and approved of the final version of this manuscript.
The authors declare no conflicts of interest.
Supplementary material
For supplementary material referred to in this article, please visit https://doi.org/10.1017/S0007114523000739


 Open access