

Cambridge apologises for a publisher-introduced error during the production process of the above article (Verret, Reference Verret2020).
Figure 2 was mistakenly positioned at two locations, figure 2 and figure 6. This Erratum contains the correct versions of these figures along with their captions.
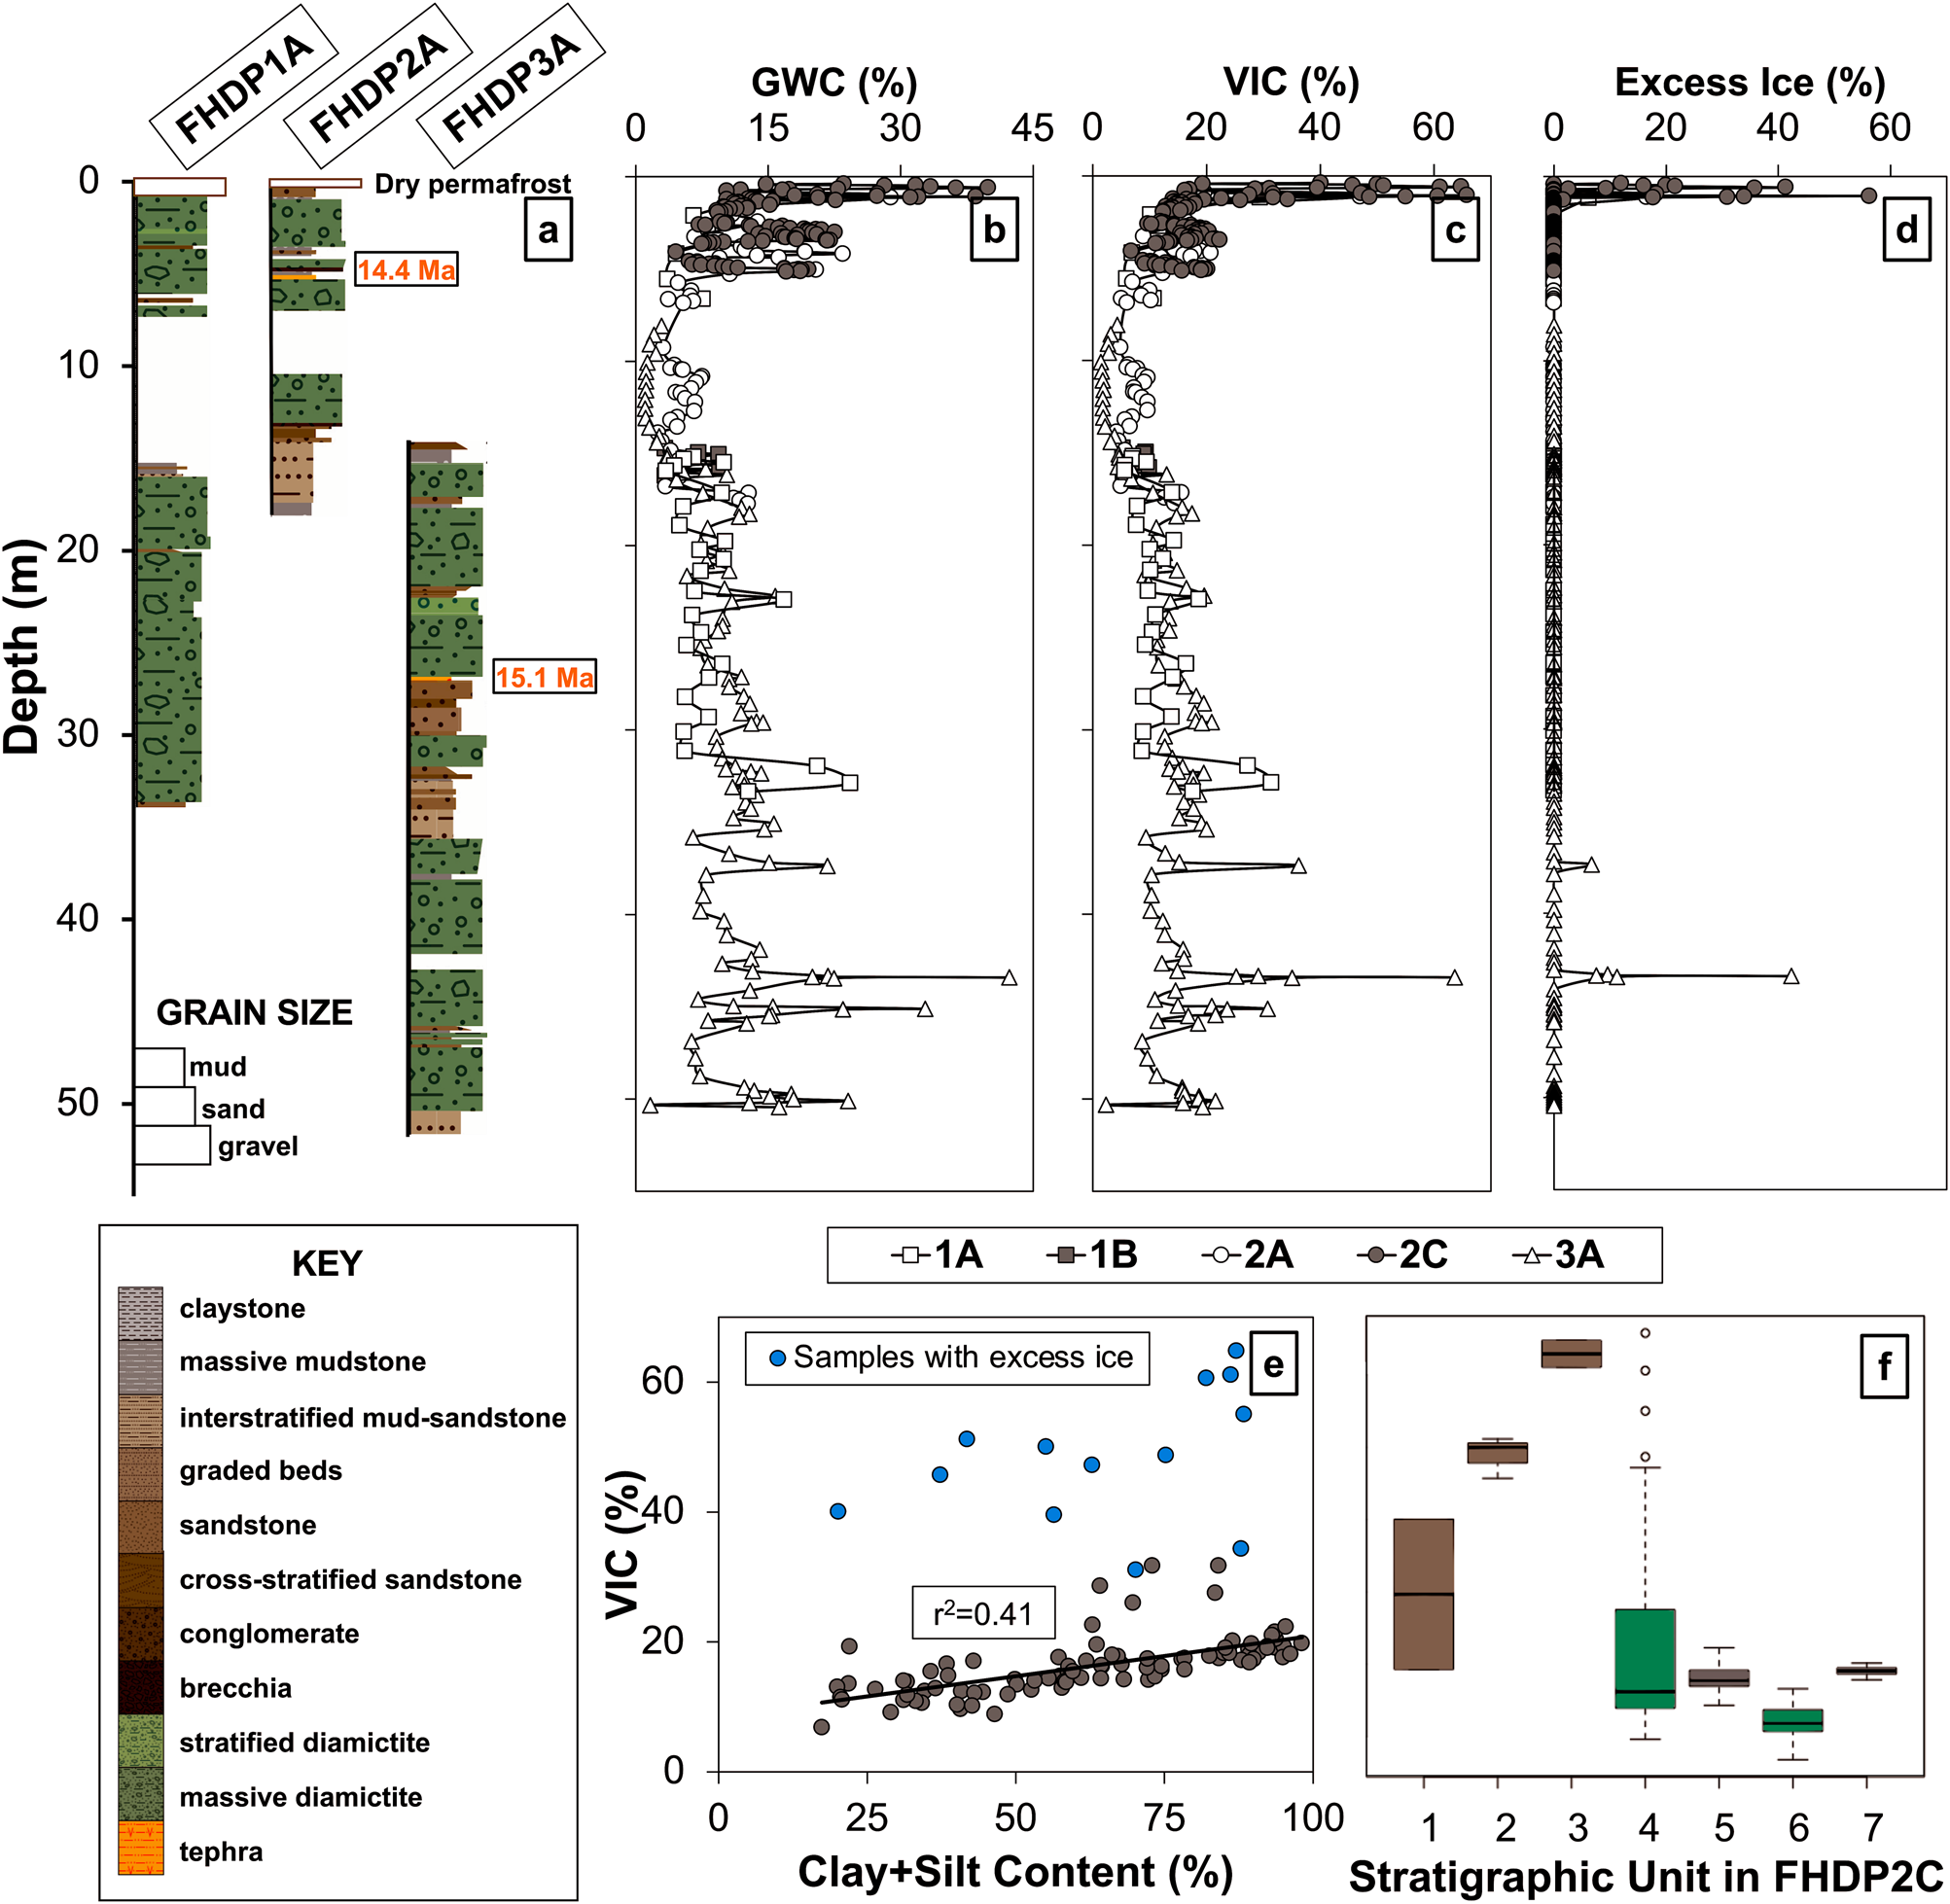
Fig. 2. a. General stratigraphy of Friis Hills Drilling Project (FHDP) cores FHDP1A, 2A and 3A with tephra ages provided by Hemming S. Cox (personal communication 2020). b.–d. Gravimetric water content (GWC), volumetric ice content (VIC) and excess ice content, respectively in the five FHDP cores. e. Relation between VIC and clay + silt content in FHDP2C. f. Boxplots of the VIC for the various stratigraphic units in FHDP2C.
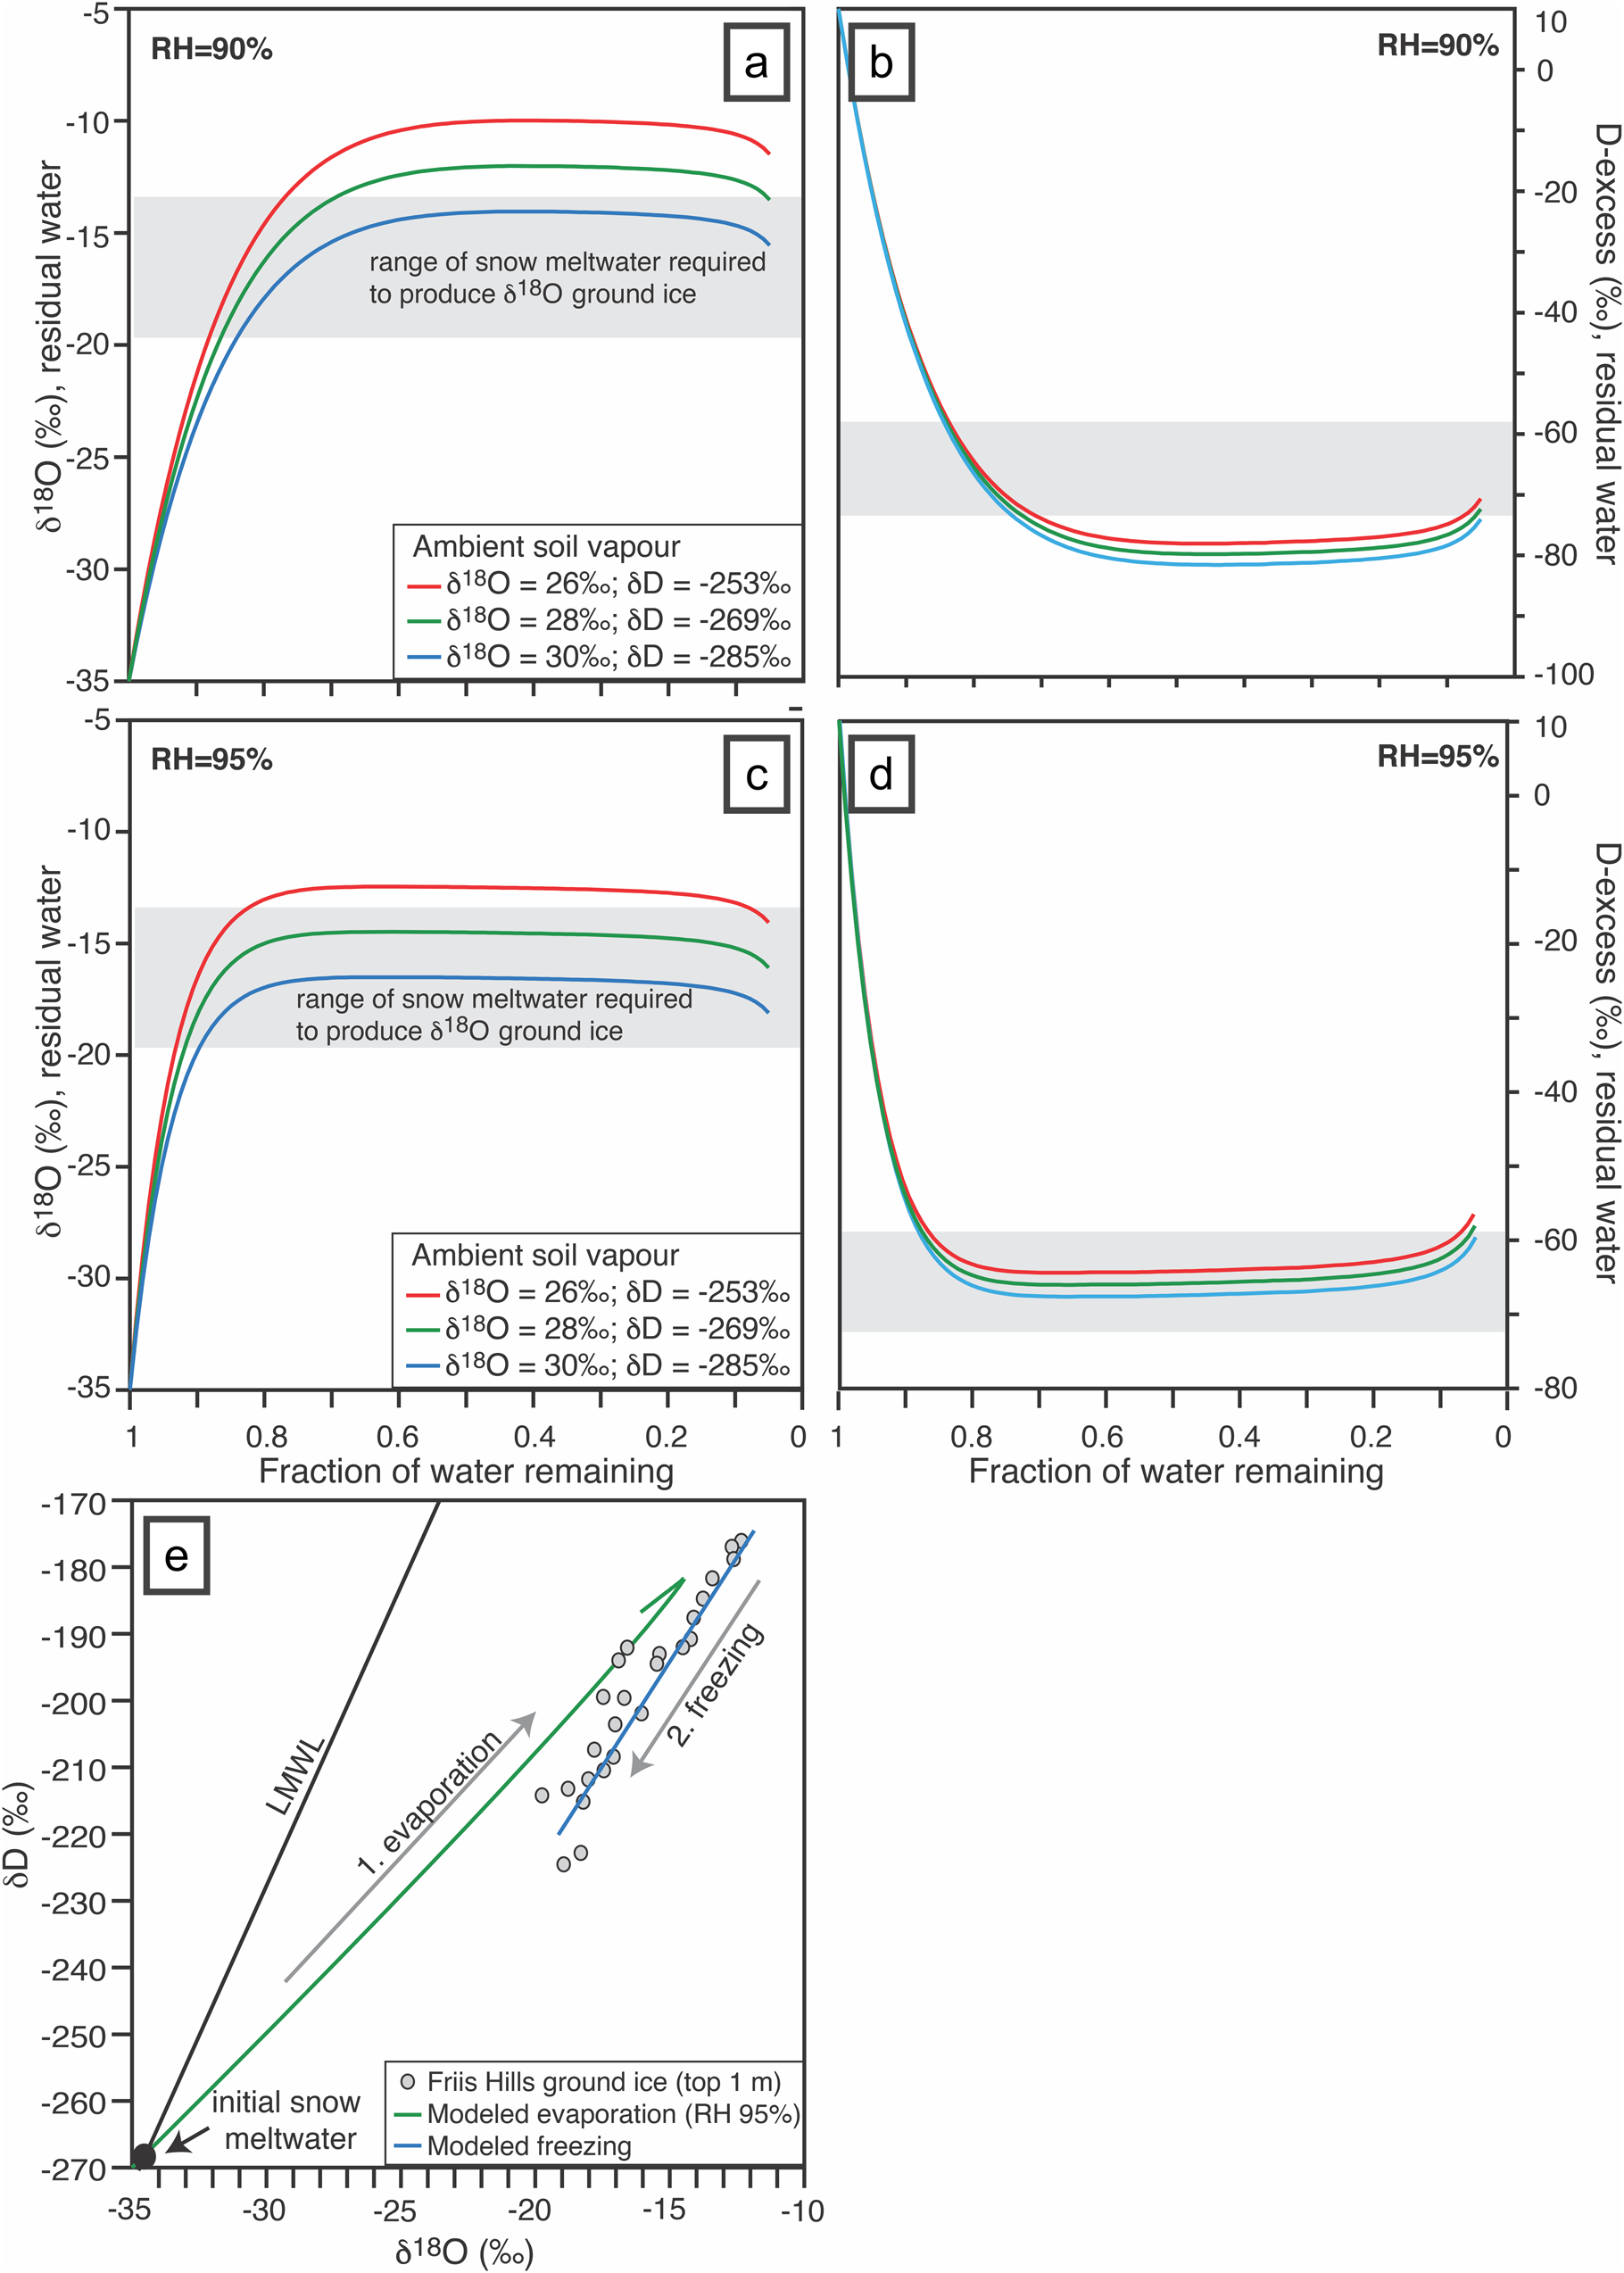
Fig. 6. Evolution of (a. & c.) δ18O and (b. & d.) D-excess for two scenarios of relative humidity (RH) (a. & b.) of 90% and (c. & d.) 95% for a range of soil water vapour values using a combination of the Craig et al. (1963) and Craig (1965) models for isotope exchange of evaporating water with ambient soil moisture and the isotope salt effect correction of Sofer & Gat (1975). e. At the end of the evaporative evolution, the liquid water δ18O and δD are used to determine the first formed ice isotopic composition at the ice table. Note, for example, the liquid water's δ18O at the ice table is ~−15‰, so the first ice formed at the ice table would be ~−12‰ and would progressively decrease with depth following the freezing of the residual water. LMWL = local meteoric water line.


