


Research has indicated that eating habits in early years may be predictive of those in adulthood( Reference Kelder, Perry and Klepp 1 ). Therefore, it is important that children adopt and maintain positive eating habits. Parental approach and promotion of the consumption of particular foods is integral to overcoming a child’s natural rejection of new (novel) foods( Reference Dovey, Staples and Gibson 2 ). Acceptance of novel foods involves a complex interaction between the innate response, which may act as a predisposed barrier to the acceptance of certain foods( Reference Dovey, Staples and Gibson 2 ), and numerous factors such as cultural norms( Reference Kannan, Carruth and Skinner 3 ) and parenting style/pressure( Reference Galloway, Fiorito and Lee 4 ). However, other factors that could also be considered psychological barriers to increasing food acceptance are food neophobia( Reference Birch, Gunder and Grimm-Thomas 5 ) and food fussiness( Reference Dovey, Staples and Gibson 2 , Reference Galloway, Lee and Birch 6 ). ‘Fussy/picky’ eating or food fussiness refers to the rejection of a large proportion of both familiar and novel foods( Reference Dovey, Staples and Gibson 2 ). In addition, food neophobia is defined as the rejection of novel or unfamiliar foods( Reference Dovey, Staples and Gibson 2 ). The novelty value of the food is what differentiates food fussiness from food neophobia( Reference Dovey, Staples and Gibson 2 ). Food fussiness may result in both inadequate consumption of a wide variety of foods and insufficient amounts of foods consumed( Reference Dovey, Staples and Gibson 2 ), with certain food textures also rejected by the child( Reference Smith, Roux and Naidoo 7 ). High levels of food fussiness can have an impact on a child’s overall health, leading to inadequate nutrient intakes and diet quality, higher risk of being underweight and the development of eating disorders, which can persist into adolescence or even adulthood( Reference Galloway, Lee and Birch 6 , Reference Marchi and Cohen 8 – Reference Kotler, Cohen and Davies 11 ).
Research has shown that genetic heritability can account for a large proportion of variance in food neophobia and food preferences( Reference Breen, Plomin and Wardle 12 – Reference Pliner, Pelchat and Grabski 15 ). However, as children are predisposed to learn through experience, alteration of some genetic traits may occur over time with increased exposure and familiarisation to a variety of foods( Reference Savage, Fisher and Birch 16 ). Breast-feeding, as a child’s first nutrient source, can provide infants with early, possibly repetitive exposure to a diverse flavour environment( Reference Breen, Plomin and Wardle 12 , Reference Birch 17 ). Parental neophobia( Reference Carruth and Skinner 18 – Reference Pliner 20 ), along with parental education level( Reference Vereecken, Keukelier and Maes 21 ) and socio-economic status( Reference Tharner, Jansen and Kiefte-de Jong 22 – Reference Flight, Leppard and Cox 25 ), can affect childhood food neophobia through parental feeding practices and attitudes towards foods. Studies have shown that children who are in the presence of others during mealtimes will be more willing to try novel foods. This concept is known as social facilitation( Reference Birch 26 – Reference Addessi, Galloway and Visalberghi 28 ). In addition, research has shown that through parental modelling, food acceptance is enhanced because the child is acquainted with the role model( Reference Salvy, Vartanian and Coelho 29 ).
Although environmental and social factors have an important influence on food neophobia and fussiness there may be other underlying psychological factors that can counteract the positive/negative effects. Eating food has a physiological impact that results in an array of psychological consequences on food preferences, depending on whether it was a positive or negative experience( Reference Birch 17 ). If positive feelings occur after ingestion, such as satiety, learned food preferences can develop( Reference Birch 17 ). On the other hand, if illness follows consumption of a food, especially new foods, a learned food aversion may arise and avoidance of the food may persist for many years( Reference Kalat 30 ). Repeat exposure can help overcome the psychological issues that are associated with food rejection, which may lead to older children having decreased levels of food fussiness( Reference Cooke and Wardle 31 ). As children become older they become more autonomous in relation to food choice, and in turn factors affecting food fussiness may evolve or differ from those in younger children( Reference Bassett, Chapman and Beagan 32 ).
Worldwide, a lot of research has been conducted on the determinants of food fussiness in children, especially in those less than 5 years old. As one child in five in Ireland is classified as overweight or obese( Reference Bel-Serrat, Heinen and Murrin 33 ), it is possible that levels of food fussiness are inhibiting children from obtaining desirable eating habits which could improve overall diet quality. Following on from this, to our knowledge no study to date in the Republic of Ireland has investigated the factors influencing levels of food fussiness in children. Therefore, factors that are associated with this eating behaviour need to be identified so the development of appropriate interventions can occur. The aim of the present study was to identify the sociodemographic and parental factors that are associated with food fussiness in younger and older Irish school-aged children. The objectives within the study were to explore if the determinants of food fussiness differ between younger and older children and to identify whether parental neophobia is an independent determinant of food fussiness in both younger and older Irish school-aged children.
Methodology
Study design and sample
The National Children’s Food Survey (NCFS) comprises 594 children (293 males, 301 females) aged 5–12 years. Recruitment was carried out in the Republic of Ireland between March 2003 and March 2004. The target sample size of 600 children was chosen to deliver sufficient numbers of (at least 100) individuals in the least populated age and gender subgroups. To ensure external validity, a quota sampling approach was adopted using data from the most recently published census (Census 2002) to recruit a nationally representative sample of 5- to 12-year-old Irish children( 34 ). The criteria used to achieve the quota sample was an equal proportion of boys and girls in each age group (5–8 years and 9–12 years), with an equal quota of children recruited within each age group. As no national identification system for children exists in the Republic of Ireland, participants were recruited from twenty-eight primary schools, with schools selected using the Department of Education and Science public school database. The database used to select schools was divided into the following categories: (i) small/medium/large schools; (ii) all boys/all girls/mixed; (iii) disadvantage/non-disadvantage; and (iv) urban/rural. A sampling plan was devised with schools being selected from a combination of categories to achieve a proportionally representative sample of school-aged children across the urban–rural continuum and social classes. As part of this sampling plan, quotas were assigned to each consenting school and a sample of children within the school was invited to participate in the survey. There were few or no exclusion criteria for this survey, other than being a sibling of another participant and inability to complete the survey due to disability. An information brochure containing a reply slip was administered to the family of each selected child. If the child’s caregiver agreed to participate in the survey, the designated fieldworker directly contacted them to organise a home visit. The overall response rate for NCFS was 66 %, which was calculated as follows: [responders (eligible−non-responders)−dropouts/eligible participants]×100. Analysis of the demographic characteristics of the final sample indicated that NCFS is a nationally representative sample of Irish children in respect to age, sex, social class, socio-economic status and geographical location compared with the Census 2002 data( 34 ).
Eating behaviour questionnaires
The Children’s Eating Behaviour Questionnaire (CEBQ)( Reference Wardle, Guthrie and Sanderson 35 ) was predominantly completed by mothers to assess children’s eating behaviours, specifically food fussiness, within the current study. In relation to the food fussiness subscale, Wardle et al. included some items which relate to food neophobia such as ‘My child refuses new foods at first’ as well as food fussiness items such as ‘My child enjoys a wide variety of foods’( Reference Wardle, Guthrie and Sanderson 35 ). Each item’s response was on a 5-point Likert scale (‘never’ to ‘always’) and five items within the CEBQ were reverse scored. Mean scores were calculated from the responses to each subscale and therefore scores range from 1 to 5, with higher scores indicating a greater prevalence of a specific eating behaviour. The CEBQ has been found to display good internal validity and reliability when completed by parents of young children( Reference Wardle, Guthrie and Sanderson 35 ). In the current sample, Cronbach’s α values for the entire tool were modest, ranging from 0·63 to 0·69.
Parental neophobia was measured using the Food Neophobia Scale (FNS)( Reference Pliner and Hobden 36 ). The FNS consists of ten statements (e.g. ‘I don’t trust new foods), each rated on a 7-point scale from ‘strongly disagree’ to ‘strongly agree’, with higher scores indicating higher levels of food neophobia. The questions implying food neophilia were reverse scored. Scores from each question were summed together to give a total score for each participant, ranging from 10 to 70. These continuous FNS scores were classified into tertiles, with cut-off points set at 1 sd (12·1) away from the mean (30·6). Therefore, those who scored <18·4 were categorised as food neophilic (n 97), those who scored 18·5–42·7 were categorised as neutral (n 365) and those who scored ≥42·8 were categorised as food neophobic (n 104). This type of classification has been utilised in previous studies and is regarded to be a corroborative method( Reference Olabi, Najm and Baghdadi 37 – Reference Falciglia, Pabst and Couch 40 ). The Cronbach’s α reliability for FNS was strong within this sample at 0·845.
Health and lifestyle questionnaire
Parents completed two separate questionnaires on the health and lifestyle components of both the child’s and parent’s life. The child questionnaire covered a range of factors, some of which were incorporated in the analyses, such as duration of breast-feeding, child gender and age. Parental perceptions of availability, advertising, cost, convenience, child’s likes/dislikes and allergies as barriers to providing a healthy diet for their child were included in the child questionnaire, with the response to each being either ‘yes’ or ‘no’. The parent health and lifestyle questionnaire was used to obtain information in relation to sociodemographic characteristics such as social class, maternal age and marital status, which were variables included in the analyses.
Anthropometric questionnaire
Anthropometric measurements (weight, height) were taken for both parents and children by a qualified fieldworker. The Seca 770 digital personal weighing scale measured weight to the nearest 0·1kg. The Leicester portable height measure measured height to the nearest 0·1cm. BMI was used to indirectly assess adiposity and was calculated as weight/height2 (kg/m2). The International Obesity Task Force age- and sex-specific BMI charts were used to classify the weight status of the children aged 2–18 years( Reference Cole, Bellizzi and Flegal 41 ). These cut-offs were generated from pooled international data for BMI and are linked to BMI cut-off points used in adults( 42 ). These WHO BMI cut-off points for adults were used in the current analyses to classify maternal weight status( 42 ).
Statistical analysis
The statistical software package IBM SPSS Statistics version 24.0 was used for all analyses in the present study. Food fussiness, as the dependant variable, was found to be normally distributed. Independent variables selected as determinants for food fussiness in children were chosen based on the literature, as well as those found to be confounders. The study sample was split into the following two age groups (3-year intervals), as there was a significant difference in levels of food fussiness between them: 5–8 years and 9–12 years. The sample was split in such a way to identify if determinants of food fussiness differed by age. No significant advantage was seen when age was further split into four groups (i.e. 2-year intervals). Maternal age was categorised according to the 25th, 50th and 75th percentiles. There were no significant differences between the two child age groups in relation to sociodemographic factors (excluding maternal age) and therefore these factors did not need to be controlled for. One-way ANCOVA, to control for differences in maternal age in the age groups, revealed that there were no significant differences between adjusted means (P=0·900).
Differences in food fussiness score within sociodemographic characteristics and parental factors were examined using independent-sample t tests and a one-way ANOVA. A one-way ANOVA was carried out to determine if parental neophobia levels influenced child’s food fussiness, with Bonferroni post hoc analysis used to compare the differences in child’s food fussiness score across parental neophobia tertiles. Multiple linear regression was used to identify determinants of food fussiness in younger and older children. Significant independent variables from the bivariate analyses were entered in the unadjusted models as continuous variables (where possible). Findings from the unadjusted model informed the subsequent adjusted multivariate model analyses, such that only independent variables that were significantly associated with food fussiness were included and therefore the models differed for younger and older children. Both categorical and continuous independent variables were included in the model: child gender (male=0, female=1), child BMI (kg/m2), social class (dummy variable with ‘professional/managerial’ classified as the baseline/control variable), parental neophobia (scale), and cost, child preferences, availability, advertising as barriers and family mealtime (coded as no=0, yes=1). The social class variables were included in the first step of the model; they construct a dummy variable. All other independent variables were included in the next step, which is the final model. Statistical significance was set at P<0·05.
Results
Characteristics of the study sample
Table 1 gives an overview of the sociodemographic characteristics of the sample. There was an equal distribution of boys and girls in this study sample. According to BMI cut-offs, one child in four was classified as overweight or obese (26·6 %)( Reference Cole, Bellizzi and Flegal 41 ). The mean age of mothers in the study sample was 40 years old and 48·6 % of mothers were classified as overweight/obese. The majority of mothers were married (91·3 %), had professional or managerial jobs (52·5 %) and had at least completed secondary level education (38·9 %), with a further 42·6 % going on to higher education.Less than half the children were breast-fed for any length of time (45·5 %).
Table 1 Characteristics of the study sample of nationally representative Irish children aged 5–12 years and their parents, National Children’s Food Survey (2003–2004)

Values presented are n and %, unless specified otherwise.
† International Obesity Task Force age- and sex-specific BMI cut-offs for defining weight status in children aged 2–18 years.
‡ Weight status determined using WHO standards: normal weight, BMI<25·0 kg/m2; overweight, BMI=25·0–29·9 kg/m2; obese, BMI≥30·0 kg/m2.
Food fussiness in relation to sociodemographic characteristics
There was a significant difference in food fussiness score between younger and older children, such that younger children had higher levels of food fussiness than older children (P=0·034). Significant differences in food fussiness levels in relation to sociodemographic characteristics were evident in younger children (5–8 years), with the same characteristic differences noted in the total population (Table 2). Males had significantly higher levels of food fussiness compared with females and children who were breast-fed for >6 months had significantly lower levels of food fussiness than those who were not breast-fed or breast-fed for <6 months. Social class was the only maternal characteristic to significantly affect children’s level of food fussiness, with those in higher-status roles (professional/managerial) having children with lower levels of food fussiness compared with those in lower-status roles (semi-skilled and unskilled). No significant differences in levels of food fussiness were evident according to sociodemographic characteristics in older children (9–12 years).
Table 2 Differences in mean food fussiness score across sociodemographic characteristics for the total sample and by child age in the nationally representative sample of Irish children aged 5–12 years (n 594), National Children’s Food Survey (2003–2004)
* Mean food fussiness score was significantly different between 5–8-year-olds and 9–12-year-olds: P<0·05.
† International Obesity Task Force age- and sex-specific BMI cut-offs for defining weight status in children aged 2–18 years.
‡ Weight status determined using WHO standards: normal weight, BMI<25·0 kg/m2; overweight, BMI=25·0–29·9 kg/m2; obese, BMI≥30·0 kg/m2.
Food fussiness in relation to parental factors
Table 3 illustrates how parental factors, such as family mealtimes and parental barriers towards providing a healthy diet for their child, affected children’s levels of food fussiness. Older children who engaged in family mealtime had significantly lower levels of food fussiness. If parents identified their child’s food preferences as a barrier to providing a healthy diet their child had a significantly higher level of food fussiness, regardless of age. Figure 1 illustrates how parental levels of neophobia impacted children’s levels of food fussiness. In younger children, levels of food fussiness were significantly lower (P<0·003) if their parents were neophilic compared with neophobic. Among the older children, levels of food fussiness were significantly (P<0·001) different between all tertiles of parental neophobia, such that food fussiness level in children with neutral parents was significantly different from levels in children of both neophobic and neophilic parents.
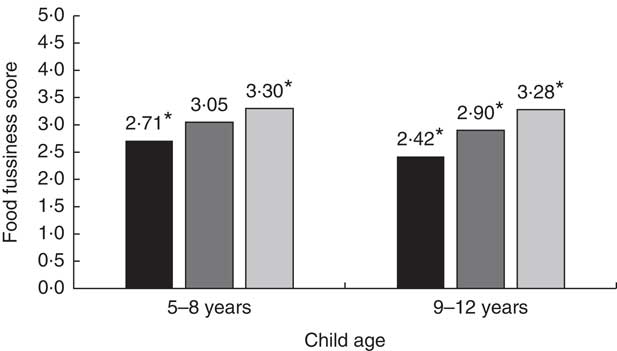
Fig. 1 Differences in child food fussiness score based on parental level of food neophobia (![]() , food neophilic;
, food neophilic; ![]() , neutral;
, neutral; ![]() , food neophobic) and by child age in a nationally representative sample of Irish children aged 5–12 years (n 594), National Children’s Food Survey (2003–2004). *In 5–8-year-olds and 9–12-year-olds separately, food fussiness was significantly different according to parental levels of food neophobia: P<0·05
, food neophobic) and by child age in a nationally representative sample of Irish children aged 5–12 years (n 594), National Children’s Food Survey (2003–2004). *In 5–8-year-olds and 9–12-year-olds separately, food fussiness was significantly different according to parental levels of food neophobia: P<0·05
Table 3 Parental behaviour and barriers to providing a healthy diet in relation to child’s food fussiness and by child age in the nationally representative sample of Irish children aged 5–12 years (n 594), National Children’s Food Survey (2003–2004)
† The question ‘Do you eat dinner with your parent?’ was asked only of children >9 years old.
Independent determinants of food fussiness in younger and older children
Tables 4 and 5 illustrate the associations between sociodemographic characteristics, parental factors and children’s food fussiness among younger and older children, respectively. The mean variance inflation factor for the final regression model in younger children is 1·046 and 1·035 for the final regression model in older children; therefore collinearity is not a problem for either model. The unadjusted model is a simple linear regression between the individual independent variables and food fussiness (dependent variable) and replicates the findings from bivariate analyses where applicable. However, some sociodemographic variables entered as categorical variables in bivariate analyses, such as BMI and duration of breast-feeding, produced different associations with food fussiness when entered in the unadjusted regression model as continuous variables. In younger children, duration of breast-feeding was no longer significantly associated with food fussiness. In older children, child’s BMI was inversely associated with food fussiness (β=−0·147, P=0·013).
Table 4 Significant determinants of food fussiness in younger Irish children (5–8-year-olds) using linear multiple regression, National Children’s Food Survey (2003–2004)
n/a, not applicable.
*P<0·05, **P<0·01, ***P<0·001.
†R 2=0·203, adjusted R 2=0·183, F (5206)=10·461 (P<0·001).
Table 5 Significant determinants of food fussiness in older children (9–12-year-olds) using linear multiple regression, National Children’s Food Survey (2003–2004)

n/a, not applicable.
*P<0·05, **P<0·01, ***P<0·001.
†R 2=0·344, adjusted R 2=0·328, F (6244)=21·535 (P<0·001).
‡ The question ‘Do you eat dinner with your parent?’ was asked only of children >9 years old.
The multivariate regression model for younger children predicted 18·3 % of the variance in food fussiness. Parental perceptions of child’s food preferences (β=0·317, P<0·001) and advertising (β=−0·150; P=0·019) as a barrier to providing a healthy diet were significantly associated with food fussiness levels in younger children. In addition, higher parental neophobia levels (β=0·143, P=0·025) were significantly associated with higher levels of food fussiness. The multivariate regression model for older children predicted 32·8 % of the variance in food fussiness. Higher levels of parental neophobia were associated with higher levels of food fussiness (β=0·210, P<0·001), with children’s food preferences (as a barrier to providing a healthy diet) also increasing levels of food fussiness (β=0·440, P<0·001). In older children, child’s BMI (β=−0·133, P=0·012) and family mealtimes (β=−0·113, P=0·031) were associated with decreased levels of food fussiness.
Discussion
The present study explored the factors that are associated with food fussiness in Irish school-aged children. In addition, it assessed whether these factors primarily differed among younger and older children, and whether the strength of association between factors and food fussiness could be explained by the child’s age. Parental neophobia and child’s food preferences (as a barrier to providing a healthy diet) were significantly associated with food fussiness, regardless of age. Among younger children, parental perception of advertising as a barrier to providing a healthy diet was inversely associated with food fussiness, although this finding could not be replicated in older children. In older children, having a greater BMI and more family mealtimes were associated with lower levels of food fussiness.
As food fussiness levels in the CEBQ also include food neophobia items, referring to levels of food fussiness in the present study incorporates both. Study findings indicate that age does affect levels of food fussiness in children, with younger children having higher levels of food fussiness than older children. These findings are similar to those observed in earlier studies( Reference Hursti and Sjödén 43 – Reference Powell, Farrow and Meyer 45 ). These findings may arise because older children are more likely to have greater exposure to various foods and therefore they will become less neophobic as fewer foods are novel to them( Reference Cooke and Wardle 31 ). However, this may not lead to the acceptance or increased liking of these foods as illustrated in a previous study( Reference Cooke and Wardle 31 ). Cooke and Wardle found that the number of foods liked decreases as children get older, as a direct function of the frequency of foods tried( Reference Cooke and Wardle 31 ). Therefore, even though levels of food fussiness decrease with age this does not mean that the diet of older children will subsequently improve, as the decrease is associated with reduction in food neophobia and not food fussiness.
In the light of the results above, when looking at the different determinants of food fussiness, considering age is important because some factors may be age-dependent determinants. From the bivariate analyses of the present study, significant differences in food fussiness levels within the sociodemographic characteristics were evident only in younger children. However, findings from the final adjusted model illustrated the opposite, with only one sociodemographic factor associated with food fussiness and the association evident only in older children. Older children’s weight status was inversely associated with food fussiness levels, such that those with a lower BMI had higher levels of food fussiness and vice versa. In previous literature there is conflicting evidence regarding the direction of the relationship between food fussiness and weight status, with a recent systematic review claiming that the association is unclear for fussy eaters( Reference Brown, Vander Schaaf and Cohen 46 ). However, numerous studies support the findings of the current study: two recent longitudinal studies in Dutch children (5–9 years) and American girls (5–15 years) suggest that persistent fussy eaters are more likely to remain within the normal weight range and are less likely to become overweight( Reference Berger, Hohman and Marini 47 , Reference Antoniou, Roefs and Kremers 48 ). Although the current study is cross-sectional, findings from such longitudinal studies provide a possible explanation for BMI being significantly associated with food fussiness only among older children. Within the current study, findings from the bivariate analysis in older children show that there was no significant difference in food fussiness levels based on weight status classification (categorical variable). However, as a significant difference is evident in the multivariate analysis (continuous variable), these findings suggest that while an association exists, it is not to an extent that the weight status of fussy eaters and non-fussy eaters can be classified differently. Berger et al. had similar findings, such that both fussy and non-fussy eaters had mean BMI that tracked within the normal weight range from 5 to 15 years old with significant differences in BMI evident between fussy and non-fussy eaters( Reference Berger, Hohman and Marini 47 ). Findings from the current study suggest it may be the case that children develop persistent eating behaviours throughout their childhood, with the long-term physical implications of these evident only when they are older.
Parental neophobia significantly predicted the variance in food fussiness in both younger and older children, with a higher score on the FNS associated with higher levels of food fussiness in children. These findings suggest that ultimately parental eating behaviours and food consumption affect children’s eating behaviours throughout childhood and possibly in later life. Other studies have observed similar findings, with a small study in children aged 10–12 years illustrating that parental neophobia was significantly associated with child neophobia( Reference Falciglia, Pabst and Couch 40 ). In contrast, Skinner et al. found no significant correlation between child and mother food neophobia but observed a significant association between both in terms of general neophobia( Reference Skinner, Carruth and Bounds 49 ). Another interesting finding from the longitudinal study carried out by Skinner et al. was that children’s and mothers’ food preferences were significantly correlated for liked, disliked and never tasted foods at all time points, with children often not introduced to foods disliked by mothers( Reference Skinner, Carruth and Bounds 49 ). Food neophobia has been referred to as an age-dependent state, which means that if a child is initially neophobic but is brought up in a supportive environment, the child should become less neophobic with age( Reference Dovey, Staples and Gibson 2 , Reference Pelchat and Pliner 19 , Reference Rigal, Frelut and Monneuse 50 ). Therefore, as there was a stronger association between parental neophobia and food fussiness in older children, it is more likely that parental modelling is influencing it as opposed to the heritability of this eating behaviour. Alternatively, it may be the nurturing of the inherent trait through years of parental modelling.
Parental modelling is a form of ‘social facilitation’ whereby, if a child is consuming food in the presence of others also eating, his/her behaviour is socially facilitated by these people( Reference Lafraire, Rioux and Giboreau 51 ). Social facilitation in children aged 5–11 years is more likely to occur when the co-eaters are familiar to the child than if the child is eating alone or in the presence of a stranger( Reference Salvy, Vartanian and Coelho 29 ). The current study supports these findings, with family mealtimes associated with lower levels of food fussiness in older children. Similar findings were reported by Finnane et al., such that by providing children with structured mealtimes children had lower levels of food fussiness and higher levels of enjoyment of food( Reference Finnane, Jansen and Mallan 52 ). The influence of parental modelling is seen in a longitudinal study conducted by Vereecken et al., which found that older children’s dietary intake is significantly correlated with parental food consumption( Reference Vereecken, Haerens and De Bourdeaudhuij 53 ). Parental fruit and vegetable consumption at time-point 1 (child aged 10 years) was a significant positive predictor of child’s fruit, vegetable, snack and sugar-sweetened beverage intakes at time-point 4 (child aged 14 years)( Reference Vereecken, Haerens and De Bourdeaudhuij 53 ). An additional theory supporting parental modelling is ‘cognitive aversions’, which proposes that if children are enjoying a shared eating experience with their parents, these positive emotions could act as a prompt for trying novel foods( Reference Batsell and Brown 54 ). Structured mealtimes are an important component of responsive parental feeding, whereby parents attenuate to their child’s meaningful signals and successfully communicate with their child to aid and promote the child’s awareness of internal hunger and satiety cues( Reference Black and Aboud 55 ).
In the present study, children had significantly higher levels of food fussiness if parents reported that their child’s food preferences were a barrier to providing a healthy diet. It was the only significant barrier associated with food fussiness levels in both age groups; however, the association was stronger in older children. Similar findings were observed in a recent study in which, within a list of barriers to providing a healthy diet for a child, parents reported that 75 % of the barriers were accounted for by children’s food preferences( Reference Jarvis, Harrington and Manson 56 ). A qualitative study by Nepper and Chai reported comparable findings, such that parents identified fussy eaters as a challenge to providing a healthy diet, however they believed they have strategies to overcome this barrier( Reference Nepper and Chai 57 ). Studies have shown that repeat exposure to a wide variety of foods can aid in the development of preferences for a food or flavour( Reference Skinner, Carruth and Bounds 49 ). Therefore, if parents do not ‘expose’ children to a variety of foods, the child will have reduced opportunities to develop food preferences and levels of food fussiness can remain high, as the foods they desire are readily available in the home. This may explain the stronger association in older children than younger children, such that parents may realise that their opportunity to influence their child’s food preferences has slowly diminished as their child has got older. Therefore, with older children parents may be more likely to allow their child’s food preferences to influence food choice and availability. In addition, parents may cease exposing their child to a variety of food(s), as they believe their current food preferences are permanent and resistant to change.
Parental perception of advertising as a barrier to providing a healthy diet was significantly associated with lower levels of food fussiness in younger children. In recent years, there has been a huge focus by national public health bodies worldwide to reduce the volume of unhealthy food products being advertised to children. Studies to date suggest that the food advertising predominantly promotes energy-dense, nutrient-poor foods and with the aim to promote the consumption of these type of foods by children( Reference Boyland and Whalen 58 ). Pocock et al. conducted a systematic review of qualitative studies to establish parental perceptions on healthy lifestyle behaviours to prevent obesity( Reference Pocock, Trivedi and Wills 59 ). In relation to food advertising, parents who had knowledge about the importance of healthy eating and exercise thought that food advertising was a barrier, as it prevented them from putting their knowledge into practice( Reference Pocock, Trivedi and Wills 59 ). Therefore, findings from the current study are somewhat contradictive of studies to date, perhaps due to the nature of the question asked to parents or in relation to the current study focusing on a specific eating behaviour (food fussiness) as opposed to food consumption patterns. In the current study, it appears that parents of younger fussy eaters identify the child’s food preferences as the predominant barrier to providing a healthy diet and therefore the effects of food advertising are less of a concern to parents of younger fussy eaters. Qualitative work conducted by Campbell et al. may provide a possible explanation for findings from the current study( Reference Campbell, Crawford and Hesketh 60 ). Their research suggests parents do believe that food advertising has an influence on their child’s food preferences, but as parents they intervene so that the requested ‘advertised’ food products are not purchased and brought into the home and therefore do not become barriers to providing a healthy diet( Reference Campbell, Crawford and Hesketh 60 ).
The NCFS is a nationally representative sample of the population of the Republic of Ireland in terms of age, sex, social class, socio-economic group and geographic location. The use of psychometric rather than behavioural measures could be seen as a limitation, but it may also be a strength. Parents regularly observe their children’s eating behaviours, putting them in a strong position to give an account of the child’s habitual behaviour, as opposed to one-off behaviours. As the NCFS includes parents with a range of literacy and abilities, it is more appropriate to use a standardised method of assessment such as a parent-report instrument to strengthen the data obtained. This method also avoids difficulties in comprehension and self-awareness that would be encountered while administering a similar questionnaire to children. Although mothers’ emotional attitude and opinions may form bias, the observed correlations between the CEBQ scores and objective measures of eating behaviour alleviate some of these concerns. A limitation within the present study is the cross-sectional nature of the data collection that prevents determination of the direction of associations.
The current study identified some of the significant determinants of food fussiness in Irish school-aged children. Findings suggest that a child’s food preferences as a barrier for parents providing their child with a healthy diet is a major determinant of food fussiness as it significantly determined food fussiness in both younger and older children. This may be due to lack of availability/accessibility to a variety of foods. Parental modelling, as opposed to heritability, may explain the association between parental neophobia and food fussiness, as the strength of this association increased with age. In addition, in older children engaging in family mealtimes resulted in lower levels of food fussiness. In terms of sociodemographic factors, BMI was inversely associated with food fussiness in older children but not to the extent whereby a difference in weight status was noted. To conclude, findings from the current study suggest that certain factors regardless of age are associated with food fussiness, with the strength of the association increasing as children get older, and that parental neophobia is an independent determinant of food fussiness. In addition, the determinants of food fussiness differ somewhat with age because findings suggest that the possible effects of persistent fussy eating, such as those on weight status, are not evident until children are older.
Acknowledgements
Financial support: This work was supported by the Department of Agriculture Food and Marine, under the National Development Plan 2000–2006. The Department of Agriculture Food and Marine had no role in the design, analysis or writing of this article. Conflict of interest: None. Authorship: S.R. was involved in generation of the research question, carrying out analyses of the data and writing the research article. A.K. and J.K. were responsible for generation of the research question and review of data analyses and the research article. J.W. and B.A.M. were involved in the study design and conducting the study. Ethics of human subject participation: This study was conducted according to the guidelines laid down in the Declaration of Helsinki and all procedures involving human subjects were approved by the Federated Dublin Voluntary Hospitals and St James’s Hospital Joint Research Ethics Committee. Written informed consent was obtained from all subjects.


