


The key elements of the global obesity challenge are these. First, the global food supply has been structured to maximise inexpensive kJ from staple grains, vegetable oils and sugar crops( Reference Drewnowski and Popkin 1 ). Second, the food industry has produced many energy-dense and good-tasting foods that can contain excess solid fat, sugar or salt( Reference Hawkes, Smith and Jewell 2 – Reference Poti, Mendez and Ng 5 ). Third, energy-dense processed and packaged foods tend to be cheaper and more convenient than foods that are perishable and farm-fresh. Fourth, people eat what they can afford( Reference Drewnowski and Specter 6 , Reference Darmon and Drewnowski 7 ). Lower-cost foods and lower-cost diets are more likely to be consumed by lower-income groups( Reference Drewnowski and Specter 6 ). Not by coincidence, lower-income groups have lower-quality diets and are more likely to be diabetic or obese( Reference Drewnowski and Specter 6 , 8 ).
High sensory appeal, low cost, wide availability and large portions of energy-dense foods can promote overeating and weight gain( Reference Drewnowski and Specter 6 , Reference Darmon and Drewnowski 7 ). Previous studies have noted strong associations between dietary energy density and obesity( Reference Bes-Rastrollo, van Dam and Martinez-Gonzalez 9 – Reference Mendoza, Drewnowski and Christakis 11 ) and type 2 diabetes( Reference Wang, Luben and Khaw 12 , Reference Hingle, Wertheim and Neuhouser 13 ). Among potential mechanisms linking dietary choices and health outcomes were high glycaemic index, low fibre content and high reward value of energy-dense foods( Reference Wang, Luben and Khaw 12 – 15 ). Short-term feeding studies suggested that lower-energy-density food choices can result in lower energy intakes( Reference Hingle, Wertheim and Neuhouser 13 ). The 2010 Dietary Guidelines Advisory Committee concluded that reducing dietary energy density improved weight maintenance and weight loss( Reference Hingle, Wertheim and Neuhouser 13 ).
What needs to be recognised is that dietary energy density and dietary nutrient density are inversely linked( Reference Maillot, Darmon and Darmon 16 ). Reducing dietary energy density( Reference Hingle, Wertheim and Neuhouser 13 – 15 ) usually encompasses increasing dietary nutrient density, whether for weight management or public health purposes. Whereas energy density is simply defined as kcal/100 g (or kJ/100 g), metrics of nutrient density rely on more complex nutrient profiling (NP) methods( Reference Drewnowski 17 , Reference Rayner, Scarborough and Boxer 18 ). The goal of NP models is to separate foods, meals or food patterns into those that are energy-dense and those that are nutrient rich( Reference Drewnowski and Fulgoni 19 ). Unfortunately, higher-quality food patterns are often associated with higher per kJ diet costs( Reference Rao, Afshin and Singh 20 , Reference Rehm, Monsivais and Drewnowski 21 ).
Most dietary guidelines are silent on the fundamental issue of diet cost( 22 ). For example, the United States Department of Agriculture (USDA) Healthy Food Patterns, a part of the 2015 Dietary Guidelines for Americans (DGA)( 22 ), featured Healthy US, Healthy Vegetarian and Healthy Mediterranean patterns. The patterns specified the amounts of leafy green vegetables, whole fruit and seafood that ought to be included in a healthy diet, without much concern for their likely higher cost. Whereas energy-dense diets cost less, the recommended higher-quality diets are likely to cost more( Reference Rao, Afshin and Singh 20 , Reference Rehm, Monsivais and Drewnowski 21 ). Indeed, the defining characteristic of energy-dense diets may not be their sugar or fat content but their lower cost per kJ( Reference Drewnowski 23 ). Arguably, taxation measures imposed on low-cost sugary beverages, fats and sweets implicitly recognise the economic roots of social disparities in diets and health( Reference Batis, Rivera and Popkin 24 ).
Obesity, energy and nutrients
The regular disagreements whether it is dietary sugar or dietary fat that drives the obesity epidemic can be viewed through the prism of energy costs. Both low-energy-density sugary beverages and high-energy-density snacks and fast foods have been listed as likely culprits, although at different times( Reference Drewnowski 23 ). Whereas both science and popular opinion were once resolutely against dietary fat, they are now against added sugar. It bears repeating that low-energy-density sugary beverages and high-energy-density snacks have little in common, other than their low per kJ cost( Reference Drewnowski 23 ). Their palatability, satiety, glycaemic index and fibre content are all vastly different. Reducing dietary energy density meets the twin objectives of reducing energy intakes and improving the nutrients:energy content ratio( Reference Hingle, Wertheim and Neuhouser 13 ). It is currently viewed as an emerging approach to weight management( Reference Wang, Luben and Khaw 12 ).
The present position is that improving dietary nutrient density, defined here as the nutrients:energy ratio, can be viewed as an approach to weight management in its own right. Whereas energy-dense diets have been repeatedly linked to obesity risk, nutrient-rich diets (roughly their reciprocal) have not. It is worth noting, in this context, that lower-income groups that are most likely to be overweight or obese are also most likely to exhibit nutrient deficiencies( Reference Amoroso 25 ). In other words, it has become possible to be undernourished yet overfed. The term ‘hidden hunger’( Reference Amoroso 25 ), only recently linked to obesity risk, refers to shortfalls in dietary intakes of vitamins and minerals, most often found among low-income and other vulnerable groups.
These observations run counter to the long-standing dogma of nutritional epidemiology, which is that all dietary nutrients are positively correlated with total energy intakes. The low cost of excess energy from plant foods (sugar cane, soya and maize are all plants) has led to the uncoupling of the key relation between kJ and nutrients. Attempts to reduce diet costs steer consumers towards lower-cost high-energy foods, leading to diets that are energy-rich but nutrient-poor. In that case, eating more empty kJ from ‘junk’ foods would not necessarily yield any additional nutrients.
What is energy density?
In general, energy-dense foods are foods that are dry. It is water content, rather than the content of fat and sugar, that drives the energy density of beverages and foods( Reference Drewnowski 23 ). The energy density range runs from water (0 kcal/g or 0 kJ/g) to sugar (4 kcal/g or 17 kJ/g) to fat (9 kcal/g or 38 kJ/g). Even though recent studies may have referred to ‘energy-dense’ sugary beverages and ‘low-energy-density’ beans or whole grains( Reference Hingle, Wertheim and Neuhouser 13 ), such statements are the opposite of the truth. Despite being the major source of added sugars in the US diet, sugary beverages have low energy density, in the order of 40 kcal/100 g, same as baby carrots.
The relation between mean energy density of foods (kcal/100 g) and their mean water content (g/100 g) is shown in Fig. 1. The data are for 7162 foods in the Food and Nutrient Database for Dietary Studies (FNDDS 2009–2010), aggregated to nine major USDA food groups. The size of the bubble reflects the number of FNDDS foods within each of the nine food groups. FNDDS data are used to calculate calories and nutrients in the What we Eat in America studies.
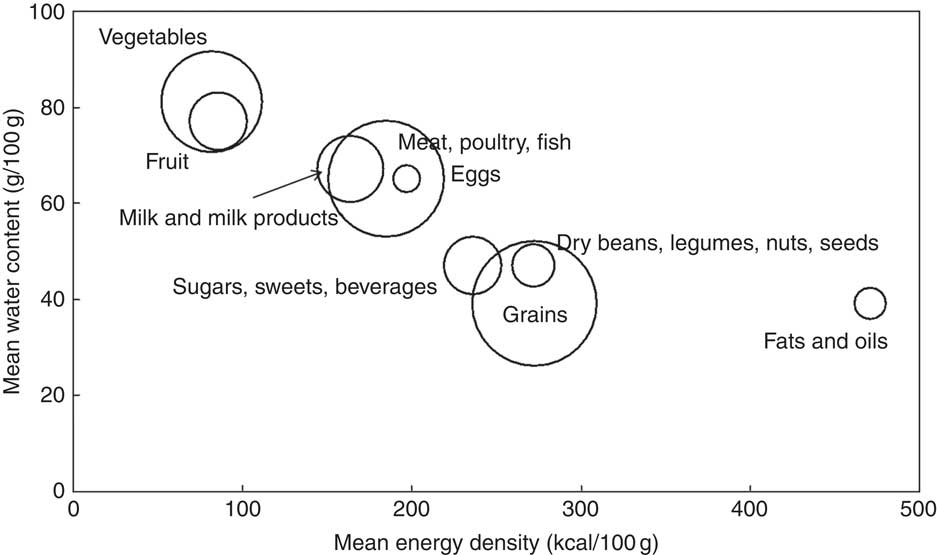
Fig. 1 Relation between mean energy density (kcal/100 g) and mean water content of foods (g/100 g) by United States Department of Agriculture nine major food groups. Data are for 7162 foods in the Food and Nutrient Database for Dietary Studies (2009–2010). Size of the bubble denotes the number of foods per major food group.
Fig. 2 shows the relation between mean energy cost of foods ($/100 kcal) and their mean water content (g/100 g). It can be seen that grains, fats and oils cost less per kJ than do vegetables, fruit or meat, poultry and fish. The data are for 5319 foods in FNDDS 2009–2010 for which national food prices were available, adjusting for inflation.
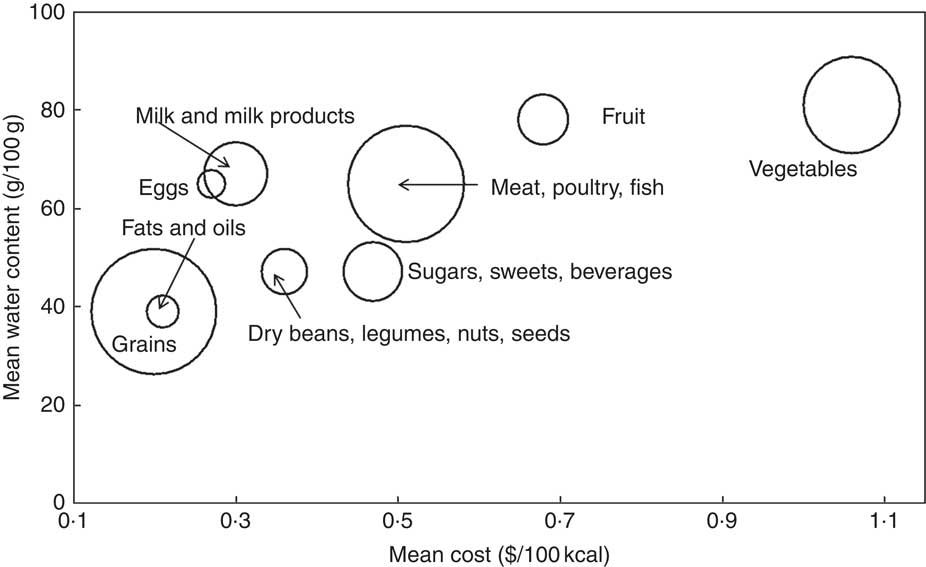
Fig. 2 Relation between mean cost per 100 kcal ($/100 kcal) and mean water content of foods (g/100 g) by United States Department of Agriculture nine major food groups. Data are for 5319 foods in the Food and Nutrient Database for Dietary Studies (2009–2010). Size of the bubble denotes the number of foods per major food group. To convert kcal to kJ, multiply by 4·18.
Reducing dietary energy density, as opposed to focusing on either sugar or fat, is viewed as an emerging approach to weight management( Reference Hingle, Wertheim and Neuhouser 13 ). The World Health Organization report( 15 ), published in 2006, also identified dietary energy density as a key factor. Dietary energy density can be reduced by lowering the diet’s content of fat (9 kcal/g or 38 kJ/g) and/or dry grains (4 kcal/g or 17kJ/g) and by increasing the consumption of moisture-containing vegetables and whole fruit (<1 kcal/g or <4·18kJ/g)( 14 ). One advantage of reducing dietary energy density was that the volume of bulky, low-energy-density diets has been linked to increased satiety, the feeling of being full after fewer kJ( 14 ). Paradoxically, consuming more low-energy-density beverages did not count. Beverages, whether energetic or non-energetic, do not enter into most dietary energy density calculations, and neither does drinking water.
As might be expected, diets containing fewer kJ per gram tend to contain more nutrients per kJ. However, replacing energy-dense grains, fats and sweets with equienergetic but healthier options does increase diet cost. Fig. 3 shows the relation between mean energy density (kcal/100 g) of foods and their mean energy cost ($/100 kcal). Energy-dense fats and oils, as well as grains, were cheaper per kJ than were low-energy-density vegetables and fruit.
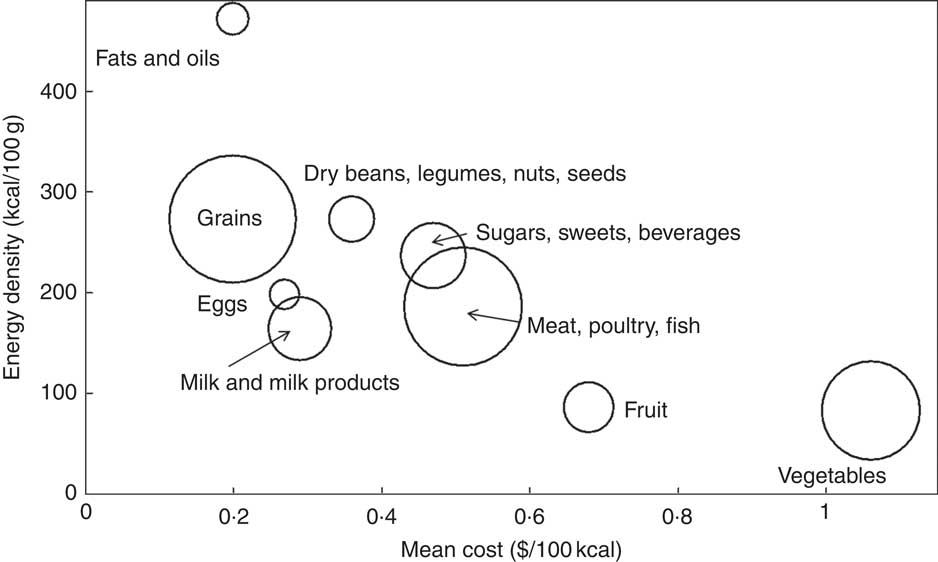
Fig. 3 Relation between mean cost per 100 kcal ($/100 kcal) and mean energy density of foods (kcal/100 g) by United States Department of Agriculture nine major food groups. Data are for 5319 foods in the Food and Nutrient Database for Dietary Studies (FNDDS 2009–2010). Size of the bubble denotes the number of foods per major food group. To convert kcal to kJ multiply by 4·18.
Given that getting maximum perceived kJ per unit cost is the prime driver of food choices for the low-income consumer( Reference Beheshti, Igusa and Jones-Smith 26 ), eating more vegetables and fruit may not be a viable dietary advice. The unwillingness to buy expensive perishable foods can steer many food insecure households towards more shelf-stable options, especially when shopping is limited to once or twice per month. Although food prices may be one obstacle, additional factors may include accessibility, food distribution and retail, and food storage, as well as factors related to food preservation and safety, cooking skills or preparation time. The entry of women into the global labour force, in particular, has led to increased reliance on time-saving processed and fast foods( Reference Schlosser 27 ).
Food stamp recipients in the USA have been criticised for selecting sweetened beverages and energy-dense desserts, salty snacks, candy and sugar instead of the more nutritious but perishable foods such as fruit and vegetables, eggs and beans, nuts and seeds( Reference O’Connor 28 ). Despite the USDA conclusion that both food stamp recipients and other households generally made similar purchases, experts suggested policing food choices of low-income groups to ensure more purchases of healthier, if more expensive, foods( Reference O’Connor 28 ).
Food processing, energy density and cost
On the basis of current definitions( Reference Martinez Steele, Baraldi and Louzada 29 , Reference Martínez Steele, Popkin and Swinburn 30 ), unprocessed or minimally processed foods include fresh, dry and frozen fruit or vegetables, grains, legumes and fresh meat, fish and milk. Processed culinary ingredients include table sugar, oils, animal fats and salt. Simply processed foods, produced by adding fat, sugar or salt to minimally processed foods, include simple breads, ham and cheese. Ultra-processed foods, the fourth category, were defined as industrial formulations that contained added salt, sugar, oils and fats, as well as substances that had been added to mimic the taste appeal of fresh foods. Among those substances were flavours, colours, sweeteners, emulsifiers and other additives that were not used in culinary preparations, as would normally be undertaken at home.
As might be expected, most grain-based products automatically fall into the ultra-processed category. Grains are not normally consumed raw; to prepare bread, pasta, oatmeal, breakfast cereals or tortillas, some degree of processing is involved. Furthermore, most refined grains are enriched such that B vitamins (thiamin, riboflavin, niacin, folic acid) and Fe are added back after milling and processing. Ironically, the MyPlate advice to consume more whole-grain breads or cereals can be viewed as an invitation to eat more ultra-processed foods.
A direct comparison of selected unprocessed and ultra-processed food groups on energy density (kcal/100 g), cost per 100 g and cost per 100 kcal is shown in Table 1. Energy density data were obtained from the USDA FNDDS 2009–2010. Food prices per 100 g of edible portion were obtained from the USDA national food prices database and were adjusted for inflation. Analyses were restricted to foods listed more than 20 times on the 1st day of recall in the National Health and Nutrition Examination Survey 2009–2010 (NHANES 2009–2010). Food categories were based on the National Cancer Institute food aggregation scheme( 31 ).
Table 1 A comparison of selected unprocessed and ultra-processed food groups on energy density (kcal/100 g), cost per 100 g and cost per 100 kcal*
FNDDS, Food and Nutrient Database for Dietary Studies; RTE, ready-to-eat; NHANES, National Health and Nutrition Examination Survey.
* Energy density data from FNNDS 2009–2010. Cost data from United States Department of Agriculture national food prices database, adjusted for inflation. Analyses restricted to foods listed more than 20 times on the 1st day of recall in the NHANES 2009–2010. Food categories based on the National Cancer Institute food aggregation scheme. To convert kcal to kJ, multiply by 4·18.
Table 1 clearly shows that the ultra-processed foods, largely grains, were in general more energy-dense than were milk, fish, eggs, whole fruit or fresh produce. On a per kJ basis, the ultra-processed foods were also considerably less expensive. The current dismissal of ultra-processed foods as important sources of essential nutrients owes much to the failure to consider the basic economics of food choice behaviour.
Unlike many fresh foods, processed foods can be reformulated to improve their nutritional quality and the nutrient:energy content ratio( Reference Maillot, Darmon and Darmon 16 ). The food industry has been using NP to improve the nutrient density of product portfolios. The economic challenge is how to improve product nutrient density without increasing cost per nutrient.
Energy-dense foods need not always be nutrient-poor. Even though the inverse relation does hold, there are exceptions, notably dry beans, legumes, nuts and seeds, eggs and some milk products. Tree nuts, including almonds, as well as peanuts, pulses and legumes, not to mention fortified ready-to-eat cereals, have high energy density and high overall nutritional value. Dry cheeses are exceptionally rich in Ca, whereas French fried potatoes are a major source of K in the American diet. Whereas dry whole-grain snacks are energy-dense, energy density of sugar-sweetened beverages is low.
Nonetheless, the energy density concept has recently been adapted for taxation purposes. Mexico recently imposed a tax on non-essential snacks with energy density exceeding 275 kcal/100 g or 1150 kJ/100 g( 22 ): tortillas, tamales and lard, which are the major sources of low-cost kJ among the Mexican poor, were exempted for cultural reasons. Included in the definition of non-essential foods were chocolate, potato chips and nuts but not the lower-energy-density ice cream. Sugary beverages were taxed, seemingly based on their sugar content and not energy density.
Nutrient density of foods
Unlike energy density, the definition of ‘nutrient density’ is open to multiple interpretations( Reference Drewnowski 17 – Reference Drewnowski and Fulgoni 19 ). The concept of nutrient density was initially built around key nutrients contained in 100 kcal (or 418 kJ) of a given food( Reference Rehm, Monsivais and Drewnowski 21 ). Nutrient-dense foods were later described as those that contained more nutrients than kJ. Making that fuzzy definition more quantitative was the stated goal of early NP models. The main challenge was to select the most appropriate nutrients and the reference amounts.
Nutrient density of foods can be measured as nutrients per kJ, nutrients per serving or nutrients per 100 g. NP models rank individual foods based on their nutrient content relative to kJ content. The goal of NP is to separate foods that are largely high in energy content from those that are nutrient-rich( Reference Rao, Afshin and Singh 20 ).
Nutrient profile models distinguish between qualifying and disqualifying nutrients, sometimes referred to as shortfall nutrients, consumed in insufficient amounts, and nutrients of public health concern, often consumed in excess. Among the shortfall nutrients in the 2015 DGA were fibre, K, Ca and vitamin D, since their consumption fell short of recommended values. By contrast, nutrients of public health concern generally include solid (or saturated) fats, added sugar and Na. Sugars can be included as total sugars, added sugars and free sugars. On the basis of the 2015 DGA, cholesterol was no longer a nutrient of concern.
The Nutrient Rich Foods (NRF) index, representing a family of scores, was based on a variable number of qualifying nutrients (nutrients to encourage) and on three disqualifying nutrients (nutrients to limit). In the NRF9.3 variant the qualifying nutrients were protein, fibre, Ca, Fe, K and Mg, vitamin A, vitamin C and vitamin E. The disqualifying nutrients were saturated fat, added sugars and Na. The NRF9.3 algorithm was based on the sum of percent daily values (%DV) for nine qualifying nutrients minus the sum of maximum recommended values for three disqualifying nutrients. The basis of calculation was per 100 kcal, or per 418 kJ, or per serving, in contrast to the British FSA-Ofcom model that is based on 100 g( Reference Rayner, Scarborough and Boxer 18 ). Models based on nutrients per unit weight cannot readily deal with diverse portion sizes across different food groups. The FSA-Ofcom model captures the foods’ energy density, and not their nutritional value( Reference Rayner, Scarborough and Boxer 18 ).
Most foods contain multiple nutrients. Some NP models do not allow qualifying nutrients to compensate for excess fat, sugar and salt. The US FDA also disqualifies foods from nutrition and health claims if they contain the above-specified amounts of fat, saturated fat, trans-fat, cholesterol and Na per serving. For instance, a food that is high in total or saturated fat cannot claim to be ‘low in Na’. The FDA prevents foods with an undesirable nutrient profile from making a nutrition and health claim by adjusting serving sizes. For foods with small serving sizes, the serving size defaults to 50 g if a nutrition claim is to be made. The potentially disqualifying nutrients are then calculated on a 50-g basis.
In practice, some NP models are compensatory, whereas others are not. The NRF family of scores balances qualifying and disqualifying nutrients( Reference Rayner, Scarborough and Boxer 18 – Reference Rao, Afshin and Singh 20 ), whereas the Nestlé Nutrition Profile does not( 32 ). Balanced or compensatory models allow qualifying nutrients to compensate for the presence of disqualifying ones. Protein, fibre, vitamins and minerals were able to compensate for the presence of fat, sugar and salt. In non-compensatory models, this is not allowed.
Nutrient balance of composite meals and total diets
Focusing on individual foods and beverages has generated some paradoxes. Some foods or foods groups score low, yet they contain essential nutrients that are indispensable to a healthy diet. The fats and oils category is one example: olive oil and other fats score low. On the other hand, some highly rated nutrient-dense foods do not contain sufficient kJ to meet energy requirements. This dietary energy needs to come from other, lower-rated foods to achieve the best nutrients-to-energy balance. In other words, whereas energy-dense foods may not be conducive to good health, a diet composed entirely of the most nutrient-rich foods may be incompatible with survival.
The concept of nutrient balance( 22 ) shifts the analytical focus from individual foods to combinations of foods as contained in composite meals, or daily food patterns. The overall quality of food patterns is based on qualifying and disqualifying nutrients, and also on the complementarity of the nutrients as achieved by some food combinations but not by others. In principle, balanced healthy food patterns can be arrived at using a wide variety of food combinations( Reference Drewnowski 23 ). Those food patterns are very much dependent on societal factors, history and culture. For example, the current trends towards more convenient processed foods and fast foods eaten away from home cannot be separated from the entry of women into the labour force( Reference Schlosser 27 ). Local and regional food patterns will need to be included in the new generation of NP models.
Adaptations of nutrient profile models for lower-income countries will require adequate local or regional data on the nutrient composition of foods, dietary intakes and health outcomes. Potential NP models will be limited by the number of foods and nutrients that are included in the national or regional nutrient composition databases.
New food affordability metrics
The US 2015 DGA have identified solid fats and added sugars as the principal sources of empty kJ in the American diet. The population diet was too high in energy, saturated fats, added sugars and Na. The advice was to consume more fibre, K, Ca and vitamin D, identified as shortfall nutrients of public health concern. Among the recommended food groups were whole fruits, leafy green vegetables, lean meats and seafood, low-fat dairy products and whole grains. However, close adherence to federal dietary guidelines was associated with higher diet costs to the consumer.
Despite denials, food prices remain an important driver of food choice. It is well known that food prices can be the primary determinant of food purchases, along with taste, convenience and perceived nutritional value. Paradoxically, many unhealthy foods are convenient, good-tasting and cost less, whereas some healthier foods can be hard to prepare, taste bad and cost more.
Once the nutrient density of foods is calculated per energy content or per serving, the relative affordability of foods can then be expressed as kJ or nutrients per penny( Reference Drewnowski 17 , Reference Drewnowski 23 , Reference Batis, Rivera and Popkin 24 ). The goal is to identify the most affordable items within each of the recommended food groups: vegetables, fruit, whole grains or low-fat dairy products.
On the basis of USDA national prices for ninety-eight vegetables, fresh, frozen and canned, a recent study( Reference Amoroso 25 ) calculated vegetable costs per 100 g, per 100 kcal and per edible cup. Nutrient density was based on a custom-created NP model that included fibre, vitamins A, C and K, K and Mg. Nutrient affordability was the cost associated with the provision of 10 % DV of each nutrient per cup equivalent.
A similar approach, applied to Ca value metrics for a wide range of milks and dairy products in France, showed that fluid milks, hard cheeses and low-fat yogurts delivered Ca at relatively low monetary cost and without excessive amounts of kJ or disqualifying nutrients( Reference Beheshti, Igusa and Jones-Smith 26 ). Comparable value metrics are being developed for whole fruits and juices, dairy protein sources and whole grains.
The relation between food patterns’ quality and cost
By emphasising nutrient content of individual foods, NP models have yielded some paradoxes. First, some ‘good’ foods (nuts, yogurt, cheese) can contain ‘bad’ nutrients, fat, sugar or salt. On the other hand, some of the highly ranked nutrient-rich foods do not contain sufficient energy content to meet energy needs. One petition before the US Food and Drug Administration is to base the definition of ‘healthy’ foods not on single nutrients but on food groups. Thus, some food groups (e.g. whole fruit, nuts and seeds) could be declared to be healthy regardless of their nutrient content.
More attention is also being paid to food patterns, as opposed to individual foods. Foods can contribute different amounts of nutrients to the diet, depending on local eating habits. The relative amounts of these nutrients in culturally appropriate food consumption patterns need to be taken into account in the new generation of NP. A shift in focus from judging individual foods to quantifying nutrient balance in meals and total diets would be helpful as well.
Merging retail prices with dietary intake data has allowed the estimation of diet costs at the individual level. Previously, data on food costs and food expenditures were collected not at the individual but at the household level. The methods take advantage of the USDA Center for Policy and Promotion national food prices database, which has been adjusted for inflation and merged with NHANES 2009–2010( Reference Schlosser 27 ). The monetary value of the diet was then calculated by multiplying gram amounts of each food eaten by every NHANES participant by price per gram. These values were then summed for each participant.
Dietary guidelines have generally focused on the relation between diet quality metrics and selected health outcomes. The recent focus on sustainable diets has expanded the nutrition discourse to the diets’ monetary and environmental cost. The four domains of sustainability are nutrition and health, economics, society and the environment. Mathematical modelling techniques, such as linear programming, have extended NP of foods to create sustainable food patterns for diverse population subgroups, subject to a variety of constraints. Their goal is to create food patterns that are simultaneously nutrient-rich, affordable, culturally acceptable and appealing. Helping consumers identify optimal and affordable food patterns would ensure that dietary recommendations can be achieved by all socioeconomic groups.
Conclusion
Calculating the relative costs of eating healthy is a component of nutrition economics. Dietary recommendations aimed at all socioeconomic strata would benefit from economic feasibility studies.
Acknowledgements
The paper is based on a presentation at the WALTHAM International Sciences Symposium, Chicago, USA, on 18–21 October 2016.
Analyses were supported by National Institutes of Health grant R01 DK076608.
A. D. has received grants, contracts, honoraria and consulting fees from numerous food and beverage companies and other commercial and non-profit entities with interests in diet quality and health. The University of Washington has received grants, donations and contracts from both the public and the private sector.


