


A recent Cochrane review concluded that vitamin A supplementation (VAS) reduces mortality in children 6–59 months old by about 24 %( Reference Imdad, Herzer and Mayo-Wilson 1 , Reference Mayo-Wilson, Imdad and Herzer 2 ). Thus, the WHO recommends that in settings where vitamin A deficiency (VAD) is a public health problem, children 6–59 months old be given vitamin A supplements every 4–6 months to reduce morbidity and mortality( 3 ).
In India, VAD has long been recognized as a public health problem( Reference Gopaldas, Gujral and Abbi 4 – Reference Shaw, Islam and Chakroborty 6 ). Surveys carried out in 2002–2005 found that 62 % of children of pre-school age were vitamin A deficient (serum retinol <20 μg/dl) and that the prevalence and severity of VAD were significantly higher among children from socio-economically disadvantaged households( Reference Laxmaiah, Nair and Arlappa 7 , 8 ). Furthermore, India's National Family Health Survey 2006 indicated that the proportion of children 6–59 months old who had received vitamin A supplementation in the 6 months preceding the survey was significantly lower in states with lower levels of social and economic development and among children from households in the lowest wealth quintile( Reference Agrawal and Agrawal 9 – 11 ). Since 2006, the Government of India and India's State Governments have made a concerted effort to increase the coverage of the national VAS programme by strengthening the implementation of biannual VAS rounds.
The objective of the present paper is to characterize the coverage of India's national VAS programme between 2006 and 2011 in the seven states with the highest burden of child mortality in 2005–06 – Bihar, Chhattisgarh, Jharkhand, Madhya Pradesh, Odisha, Rajasthan and Uttar Pradesh – and document its performance in reaching children who live in the poorest districts of these states.
Methods
Population and study setting
The seven states included in our analysis (Fig. 1) comprise 255 districts that are home to 59·4 million children aged 0–59 months and represent 52·4 % of India's under-5s population. The mean under-5s mortality rate in these states is eighty-four deaths for every 1000 live births (sixty-three in India), while the mean prevalence of child underweight is 48·3 % (42·5 % nationally in India). These seven states are home to 58 % of India's stunted children, 59 % of wasted children, 60 % of underweight children, 72 % of infant deaths and 74 % of under-5s deaths( 11 – 13 ).
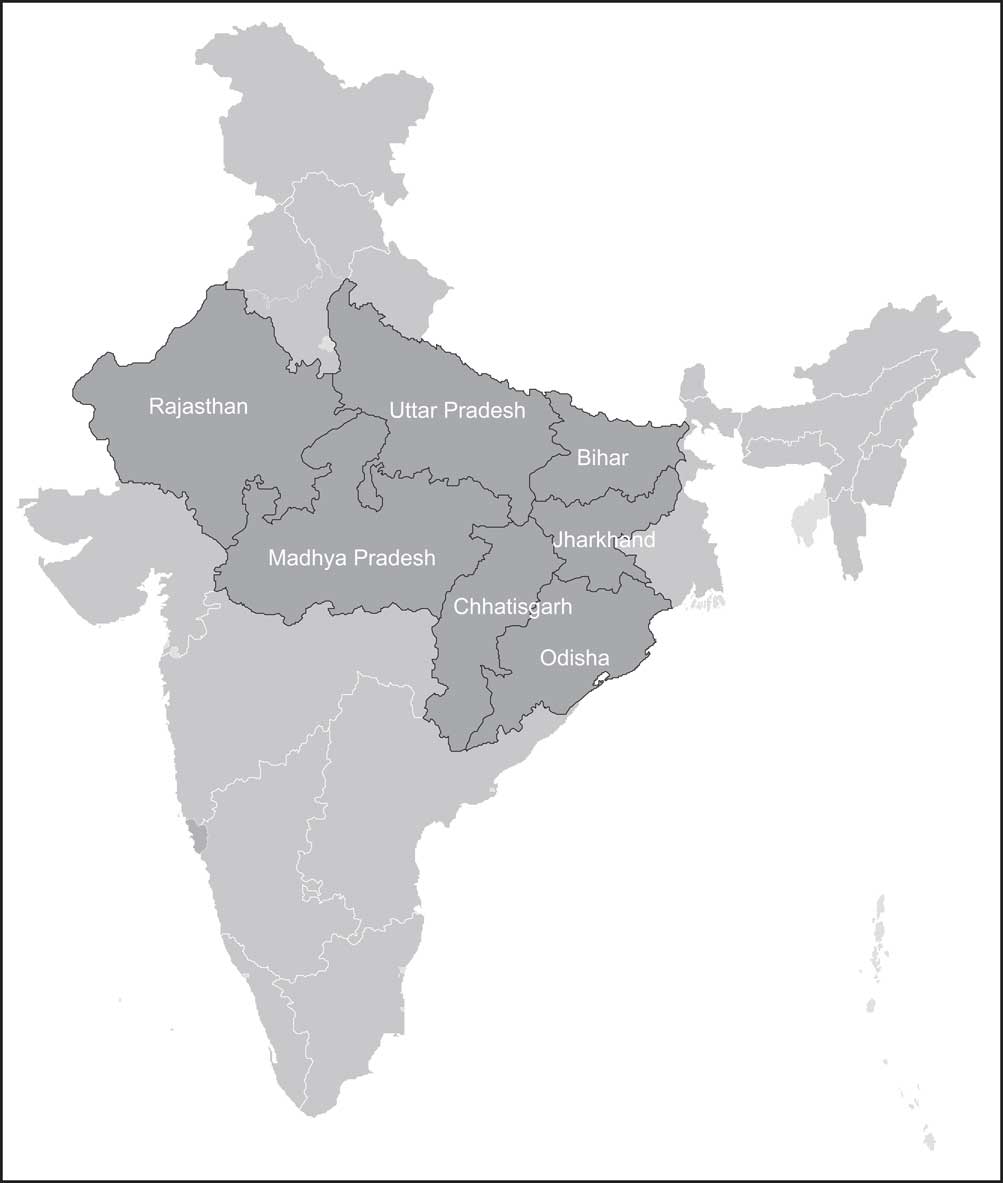
Fig. 1 Indian states included in the analysis
Data collection and analysis
India's national VAS programme is managed by the Ministry of Health and Family Welfare. The programme aims at delivering preventive VAS to all children 6–59 months old. The first VAS dose (30 mg retinol equivalents; 100 000 IU) is administered with the measles vaccination at ∼9 months while the subsequent nine doses (each 60 mg retinol equivalents; 200 000 IU) are administered every 6 months up to the age of 59 months through biannual VAS rounds as the main delivery platform( 14 ).
For the purpose of our analysis, the number of children 6–59 months old who benefitted from the VAS programme in each district (numerator) was determined using a standardized bottom-up data collection and collation procedure – common to all districts and states – with data flowing up from the VAS site in the village to the block, from the block to the district, and from the district to the state. In a given calendar semester (semester 1: 1 January–30 June; semester 2: 1 July–31 December), data collection and collation took into account the number of children 6–11 months old who received the VAS dose through the routine immunization programme (measles vaccination at ∼9 months) and the number of children 12–59 months old who received VAS through the VAS round. The number of children 6–59 months old targeted by the VAS programme in each district (denominator) and the district population size and composition were determined using the projected age-group population by India's Office of the Registrar General and Census Commissioner of India on the basis of the national census 2001 as the base year( 15 ).
Following international recommendations, ‘VAS coverage’ was defined as the proportion of eligible children who received at least one VAS dose in a given calendar year while ‘full VAS coverage’ was defined as the proportion of eligible children who received two VAS doses per calendar year. As recommended globally, the VAS coverage in a given district and calendar year was computed as that of the semester with the highest VAS coverage whereas full VAS coverage was computed as that of the semester with the lowest VAS coverage, thus assuming that all children who benefitted from the VAS programme in the semester with the lowest VAS coverage also did in the semester with the highest VAS coverage( 16 ).
Data from India's District Level Household Survey 2007–08 were used to compute a wealth index that combined household amenities, assets and durables( 17 ). The wealth index was computed at the national level and divided into wealth quintiles. In each district, the households that fell in India's lowest wealth quintile were categorized as poor. For each district, the proportion of poor households was computed and used as an indicator of district poverty.
The statistical software package Stata 12 was used for all data analyses.
Results
In the seven states included in the analysis, the percentage of households classified as poor was 32·9 %, ranging from 22·4 % in Odisha to 48·3 % in Madhya Pradesh. Within states, the lowest inter-district disparity was observed in Bihar, where the proportion of poor households by district ranged from 14·4 % to 32·6 % while the highest was observed in Uttar Pradesh, where it ranged from 1·8 % to 30·7 % (Table 1).
Table 1 Number of districts, poverty concentration and coverage of the vitamin A supplementation (VAS) programme by state, India, 2006–2011

Between 2006 and 2011, the number of districts with high (≥80 %) VAS coverage increased from fifty-six (22 %) to 191 (75 %) while the number of districts with high (≥80 %) full VAS coverage increased from twenty-four (9 %) to 131 (51 %; Table 1). As a result, the average VAS coverage in the seven states increased from 60·0 % in 2006 to 91·9 % in 2011 while the average full VAS coverage increased from 44·7 % in 2006 to 67·3 % in 2011 (Tables 2 and 3). With the exception of Odisha and Rajasthan, the VAS programme experienced significant coverage fluctuations over the 6-year period, including one (Madhya Pradesh and Uttar Pradesh), two (Bihar and Chhattisgarh) or four (Jharkhand) years with only one VAS round and therefore zero full VAS coverage (Table 3).
Table 2 Vitamin A supplementation coverage (at least one vitamin A dose per child per year) by district poverty concentration quintile and state, India, 2006–2011

Table 3 Full vitamin A supplementation coverage (two vitamin A doses per child per year) by district poverty concentration quintile and state, India, 2006–2011

The performance of the VAS programme was analysed by dividing the districts in each state into five poverty concentration quintiles. The lowest quintile comprised the 20 % of districts in the state with the lowest proportion of poor households while the highest quintile comprised the 20 % of districts in the state with the highest proportion of poor households.
In 2006, the full VAS coverage was highest in the lowest poverty concentration quintile (46·4 %) and lowest in the highest poverty concentration quintile (41·4 %). Between 2006 and 2011, the highest increase in full VAS coverage (+30·3 percentage points) was recorded in the quintile with the highest concentration of poor households while the lowest increase (+18·5 percentage points) was recorded in the quintile with the lowest concentration of poor households. By 2011, the full VAS coverage was highest (71·7 %) in the quintile with the highest concentration of poor households and lowest (64·9 %) in the quintile with the lowest concentration of poor households (Table 3).
Similar findings were observed when the performance of the VAS programme was analysed by pooling the 255 districts and categorizing them into five poverty concentration quintiles (fifty-one districts per quintile). In 2006, the full VAS coverage figures were lowest (37·7 %) in the quintile with the highest concentration of poor households. Between 2006 and 2011, the average full VAS coverage increased in all quintiles and this increase was positively correlated with the quintile rank: higher increases were observed in the quintiles with higher concentration of poor households. By 2011, the full VAS coverage in the middle, higher and highest quintiles was >70 % while it was ≤60 % in the lower and lowest quintiles (Table 4).
Table 4 Pooled vitamin A supplementation coverage (at least one dose per child per year) and full vitamin A supplementation coverage (two doses per child per year) by district poverty concentration quintile in seven Indian states, 2006–2011

The estimated number of children who did not receive the two recommended VAS doses annually decreased from 31·4 million in 2006 to 16·1 million in 2011 (48·7 % decrease). This reduction was largest in the districts with the highest concentration of poor households and lowest in the districts with the lowest concentration of poor households (61·5 % v. 23·3 %; Table 5).
Table 5 Estimated number of children 6–59 months old not benefiting from the vitamin A supplementation programme by district poverty concentration quintile in seven Indian states, 2006–2011

For each district we estimated the number of poor children (i.e. children living in households classified as poor) who were not covered (zero VAS doses) or were only partially covered (one VAS dose) per year by combining the population of children 6–59 months old, the proportion of households classified as poor and the VAS coverage/full VAS coverage in the district in a given year, assuming homogeneous coverage/full coverage across population groups within the district. The estimated number of children living in poor households who did not receive the two recommended VAS doses annually decreased from 8·5 million in 2006 to 5·1 million in 2011 (40·3 % decrease). This reduction was significantly larger in the districts with the highest concentration of poor households than in the districts with the lowest concentration of poor households (54·8 % v. 15·0 %; Table 5).
Discussion
In the seven states included in our analysis, the average full VAS coverage – the indicator of choice to measure the performance of national VAS programmes( 16 ) – increased significantly between 2006 and 2011 (from 44·7 % to 67·3 %) and so did the proportion of districts with high (≥80 %) full VAS coverage (from 9·4 % to 51·4 %).
A recent review has indicated that the critical success factors of the VAS programme in the states of Bihar and Odisha include: strong leadership and ownership by the State Government; close coordination between the two departments (Health and Family Welfare and Women and Child Development) involved in the VAS programme; effective micro-planning prior to each biannual round; flexible dosing mechanisms that enhance coverage in hard-to-reach areas; a stable procurement and distribution mechanism to ensure an adequate, timely and sustainable supply of VAS; intensive social mobilization and communication; and appropriate training and supervision of staff (JH Rah, R Houston, BD Mohapatra et al., unpublished results).
Our analysis indicates that in these seven states, the VAS programme evolved to be a social equalizer as the most significant increases in the proportion of children receiving two VAS doses per year were observed in the districts with the highest proportion of poor households; to the extent that, by 2011, the highest full VAS coverage figures (≥70 %) were recorded in the three district quintiles with higher proportions of poor households.
However, despite such significant increases in full VAS coverage, only two states – Odisha and Rajasthan – managed to expand the VAS programme steadily and reach and sustain full VAS coverage ≥80 % from 2007–08 onwards in all quintiles. As a result, a large number of children are not yet benefitting from this life-protecting intervention across states, particularly children who are potentially the most vulnerable, as about one-third (32 %) of the children who did not receive two VAS doses in 2011 lived in poor households. Importantly, half (49 %) of these children lived in districts with low concentration of poor households. Efforts aiming at scaling up the coverage of the VAS programme seem to have emphasized a geographic focus and given priority to the districts with a high concentration of households of scheduled-caste and scheduled-tribe families, which are traditionally left out by economic growth and mainstream development (VM Aguayo, N Badgaiyan and JH Rah, unpublished results).
Thus, specific state-wide programme efforts will be required in the states with lower and/or erratic full VAS coverage to ensure that all children 6–59 months old receive two VAS doses annually. Additionally, in all states priority needs to be given to the sub-district level units (blocks and villages) with higher concentrations of poor households, regardless of the poverty concentration at the district level.
As India makes progress in achieving its national and international commitments to child survival, it will be important to reassess the prevalence of clinical and sub-clinical VAD in pre-school aged children and evaluate the impact of the national VAS programme. This will address recent concerns by some investigators and practitioners about the extent and severity of VAD in India and the relevance of the national VAS programme( Reference Awasthi, Peto and Read 18 ), and build the evidence base to design the way forward post 2015.
Finally it will be important that states ensure that their VAS efforts be part of an integrated programme to control VAD that puts increasing emphasis on food-based strategies for the general population and strategies aiming at improving the quality of foods and feeding practices for young children in particular. Evidence shows that 42 % of Indian children 6–36 months old are not fed vitamin A-rich foods regularly and that the vast majority of children do not meet even 50 % of the recommended vitamin A dietary requirements because of poor diets( Reference Laxmaiah, Nair and Arlappa 7 , 8 , 11 , Reference Ramakrishnan, Martorell and Latham 19 , Reference Sachdeva, Alam and Beig 20 ).
Acknowledgements
Sources of funding: This research received no specific grant from any funding agency in the commercial sector. UNICEF supported the data analyses and paper writing. The opinions expressed in this paper are those of the authors and do not necessarily represent an official position by UNICEF. Conflicts of interest: The authors declare that they have no conflict of interest. Ethics: Ethical approval was not required. Authors’ contributions: S.B., L.B. and N.B. contributed equally to this study. V.M.A. designed the research, led the data analysis and wrote the paper; N.B. ensured data management; S.B. and L.B. contributed to the final manuscript. All authors have read and approved the final submission.


