


Introduction
Eating disorders (EDs) are severe debilitating mental illnesses with the highest mortality rate of all mental illnesses [Reference Smink, van Hoeken and Hoek1]. Mortality is the most extreme prognosis but other outcomes associated with EDs include long-term impairments such as poor functioning, unemployment, physical complications, and other mental comorbidities [Reference Schmidt, Adan, Böhm, Campbell, Dingemans and Ehrlich2,Reference Steinhausen3]. Remission rates in treated samples range from 19 to 65%. The onset of EDs typically occurs during adolescence or early adulthood and a growing body of studies shows an increase in the incidence and prevalence of EDs in children [Reference Pratt and Woolfenden4,Reference Rosen5]. These data emphasize that early identification of modifiable risk factors for the development of EDs is key in achieving better outcomes [Reference Smink, van Hoeken and Hoek1,Reference Keel and Brown6,Reference Kessler, Berglund, Chiu, Deitz, Hudson and Shahly7].
One such factor may be disadvantageous decision-making under conditions of risk [Reference Harrison, O'Brien, Lopez and Treasure8,Reference Harrison, Sternheim, O'Hara, Oldershaw and Schmidt9], related to the probability of risky behaviors and a host of adverse life outcomes [Reference Smith, Xiao and Bechara10]. An explanation why it may also be related to the risk of EDs is that making inefficient decisions under conditions of risk may reflect impulsivity and anxiety traits known to play an important role in the genesis of dysfunctional behaviors, including EDs [Reference Kaye11]. There is indeed evidence that overly cautious responding on tasks measuring decision-making under conditions of risk is associated with restricting EDs, whereas more impulsive responses have been associated with binge-purge EDs [Reference Matton, Goossens, Braet and Vervaet12,Reference Treasure and Schmidt13].
Arguably, investigating the role of decision-making under risk in early and middle adolescence for EDs may be especially informative. That period, due to the difference in the pace of maturation of the ventromedial prefrontal cortex compared to that of the dorsolateral prefrontal cortex [Reference Smith, Xiao and Bechara10,Reference Giedd, Blumenthal, Jeffries, Castellanos, Liu and Zijdenbos14], is very important for studying the development of decision-making skills [Reference Smith, Xiao and Bechara10,Reference Hooper, Luciana, Conklin and Yarger15]. To our knowledge, this role has only been recently investigated in the general population. For example, in our previous (unpublished) study we explored this by measuring decision-making under risky conditions with the Cambridge gambling task [Reference Deakin, Aitken, Robbins and Sahakian16,Reference Rogers, Owen, Middleton, Williams, Pickard and Sahakian17] (CGT). The CGT, used in the present study as well, has been developed to assess decision-making and risk-taking behavior outside a learning context. We found that higher scores in risk-taking and lower scores in quality of decision-making at age 11 were associated with the risk of developing EDs at age 14 (Harrison, Francesconi & Flouri, submitted).
What we have not investigated, and is still unknown, however, is how the development of decision-making from early to middle adolescence may be associated with the presence of ED symptoms. This is important especially considering that decision-making is highly sensitive to age-related change, particularly in adolescence [Reference Van Leijenhorst, Westenberg and Crone18]. In contrast to the typical linear development of executive functions, for example, affective decision-making abilities progress non-linearly, declining from late childhood to early adolescence, and improving during mid-adolescence [Reference Smith, Xiao and Bechara10]. We argue that atypical patterns of change in decision-making skills from early to middle adolescence may be particularly useful for understanding the etiopathogenesis of mental illnesses associated with decision-making difficulties, including EDs. Therefore, this study aimed to investigate the role of change in decision-making skills from early to middle adolescence in the development of ED symptoms in middle adolescence, while taking into account potential confounders, in a large general-population cohort. It was hypothesized that change in decision-making skills, measured using the CGT-derived variables (risk-taking, quality of decision-making, deliberation time, risk adjustment, and delay aversion) between the ages of 11 and 14 in the participants of the Millennium Cohort Study (MCS) would be associated with the probability of belonging to groups that differ in terms of important ED symptoms (body dissatisfaction, intention to lose weight, dietary restriction, significant under/overweight, and driven exercise to influence weight/shape) at age 14.
Methods
The MCS is a nationally representative longitudinal study of 19,244 infants who were born across England, Scotland, Wales, and Northern Ireland in 2000–2002 [Reference Plewis, Calderwood, Hawkes, Hughes and Joshi19]. In MCS certain sub-groups of the population were intentionally over-sampled, namely children living in disadvantaged areas, children of ethnic minority backgrounds, and children growing up in the three smaller nations of the UK. The disproportionate representation of these groups ensures that typically hard to reach populations are adequately represented and that sample sizes are sufficient for the analysis of ethnic minorities, those from disadvantaged backgrounds and children within each of the UK nations. There have been six sweeps of data collection to date. In this study, we used data from sweeps 5 (age 11) and 6 (age 14). Our analytic sample included singletons and first-born twins or triplets with available information on eating, dieting, or body image questions at age 14 and with available data on the CGT at age 11 or 14 (n = 11,303).
Measures
The CGT [Reference Rogers, Owen, Middleton, Williams, Pickard and Sahakian17] is an experimental subtest of the widely used and well-validated Cambridge Neuropsychological Test Automated Battery [Reference Robbins, James, Owen, Sahakian, Lawrence and McInnes20] that measures decision-making under risky conditions. Participants see a row of 10 boxes (red and blue) across the top of the computer screen and are told that a token is hidden behind one of them. The task consists of five stages, each of which is a block of trials. In the first, decision only stage, participants simply have to guess whether the token is hidden under a red or blue box. The latter four stages are gambling stages where, following the color decision, participants bet a proportion of their points (from an initial 100 on each stage) on their confidence in the location of the yellow token. Two of the gambling stages are practice sessions undertaken prior to a test session, so that participants’ performance is ultimately assessed by the two test gambling stages. In the gambling stages, participants start with a number of points displayed on the screen and select a proportion of these points, displayed in either rising or falling order, in a second box on the screen to gamble on their confidence in this judgment. A stake box on the screen displays the current amount of the bet. Participants are informed that correct bets will be added onto their points score (and incorrect ones will be subtracted from it) and that they should try to win as many points as possible.
Participants have to choose (a) which color of box they believe the token is hidden behind (red or blue) and (b) the number of points they want to gamble. The proportion of red to blue boxes (box ratio) varies during the task pseudo-randomly to assess the influence of statistical risk (probability) on decision-making. The five CGT measures of decision-making that are used in this study include: (a) risk-taking, the mean proportion of points bet on trials where the most probable color was selected; (b) quality of decision-making, the mean proportion of trials where the most probable color was selected; (c) deliberation time, the mean time (in milliseconds) taken to make a box color selection; (d) risk adjustment, the extent to which betting behavior is moderated by probability; (e) delay aversion, the time participants are prepared to wait in order to place a higher or lower bet. A sixth CGT measure, overall proportion bet (i.e., the mean proportion of points gambled across all trials) was excluded from our analysis in view of its very high correlation (>0.90) with risk-taking. Further details on the outcome measures from the CGT are given in Table S1 in the supplementary material.
In the MCS, a series of questions were asked at age 14 to assess eating and dieting attitudes and behavior, which correspond to key diagnostic criteria provided by the American Psychiatric Association (2013). These dichotomous items (yes/no) measured: body dissatisfaction (one item measuring whether the participant perceived themselves as too overweight or not); intention to lose weight (one item measuring the presence of a strong desire to lose weight); dietary restriction (one item measuring whether the participant had ever actively eaten less to influence their shape/weight) and excessive exercise (one item measuring whether the participant had ever exercised in a driven way in order to influence their weight and shape). In MCS, height, weight, and body fat measurements were taken by the interviewer at age 14 for each cohort member. Therefore we also included in our analysis an objective measure of underweight and overweight based on the most widely used reference panel, the UK90, which is sensitive to gender and age and developed for the British population. Cut-offs in our sample were based on the age of the cohort member at the time of interview. The underweight cut-off point was the second centile and the overweight cut-off point was the 85th centile, as suggested by the UK 90 [Reference Cole, Freeman and Preece21].
We controlled for a number of covariates known to be associated with exposure and outcome, including gender, ethnicity (according to the UK census groups of white, black, Indian, Pakistani/Bangladeshi, mixed, or other), family poverty at age 11 (below the poverty line or not), IQ, derived in MCS at age 5 from three subscales of the British Ability Scales (BAS) [Reference Elliot, Smith and McCulloch22], pubertal status at age 11 (breast growth or menstruation or hair on body for females, and voice change or facial hair or hair on body for males) and internalizing and externalizing symptoms at age 11. These were assessed using the mother-rated Strengths and Difficulties Questionnaire (SDQ) [Reference Goodman23]. The SDQ is a valid and reliable tool for measuring such symptoms in children [Reference Goodman24]. It consists of 20 “difficulties” items related to behavior (in the past 6 months), with each item scored on a 3-point scale (0 = “not true,” 1 = “somewhat true,” and 2 = “certainly true”). Items can be summed to form four scales (emotional, conduct, hyperactivity, and peer problems) or two (internalizing symptoms, the sum of the scores on the emotional and peer problems items, and externalizing symptoms, the sum of the scores on the conduct and hyperactivity problems items), which we used for this analysis [Reference Goodman, Lamping and Ploubidis25]. We also took into account an objective measure of excessive exercise collected via accelerometers. In MCS, a subsample of cohort members who participated in the age 14 sweep were asked to wear accelerometer devices for two specified full days: one during the week and the other at the weekend. The accelerometer data of MCS at age 14 express their output in “Euclidean Norm Minus One” (ENMO). This metric (ENMO) is the calculation of the average magnitude of dynamic acceleration, that is, the vector magnitude of acceleration corrected for gravity, and separates movement and gravity components in the acceleration signal. In our study, we considered the upper decile of the mean acceleration (ENMO) distribution for the week day and the weekend day to indicate moderate to vigorous physical activity.
Statistical analysis
All analyses were performed in STATA 16.0 [26]. In all models, the MCS sampling stratum was controlled to account for the disproportionate stratification of the MCS survey design. In order to identify different ED symptom groups, we applied latent class analysis (LCA). We compared models from one to three classes. The best-fitting class solution was chosen based on the following model fit statistics: (Reference Smink, van Hoeken and Hoek1) The Bayesian information criterion (BIC); (Reference Schmidt, Adan, Böhm, Campbell, Dingemans and Ehrlich2) the Akaike information criterion (AIC), and (Reference Steinhausen3) the entropy of each model. Lower BIC and AIC values indicate better fit to the data. Entropy ranges from 0 to 1, with higher values indicating that the latent classes are clearly distinguishable. Maximum Likelihood with Missing Values (MLMV) was used to deal with missing data. MLMV aims to retrieve as much information as possible from observations containing missing values. We calculated the change in CGT performance between age 11 and age 14 by subtracting CGT scores at age 11 from CGT scores at age 14. We then fitted two different sets of logistic regression models in order to explore the association between the change in CGT scores between age 11 and age 14 (adjusting for CGT scores at age 11) and ED risk groups. Missingness ranged between 0.1 (ethnicity) and 28.7% (risk adjustment at age 11), and, to handle it, we used multiple imputations by chained equations (20 imputed datasets) [Reference Royston27].
Results
Table S2 in the supplementary material shows the fit indices of the competing LCA models. Starting with the one-class model, stepwise additions of classes resulted in lower BIC and AIC values, suggesting a better model fit for higher order class solutions. However, the three-class model showed a lower entropy value compared to the two-class solution. Therefore, we considered the two-class solution optimal. The latent class marginal means, which represent the probability of responding positively to each question investigating ED symptoms, are shown in Table S3. We found that it was more likely that those belonging to class one 1: (a) did not have a perception of themselves as too overweight; (b) were not intending to try to lose weight; (c) were not actively restricting their nutritional intake to lose weight; (d) were not exercising to influence their body weight, and (e) were more likely to have a weight that was not in the UK90 under or overweight ranges. On the contrary, it was more likely that those belonging to class one 2: (a) had a perception of themselves as too overweight; (b) were intending to try to lose weight; (c) were restricting their nutritional intake to lose weight; (d) were exercising to influence their body weight; and (e) had an average, or above average (overweight) weight, according to the UK90. Based on these results we defined class one as being at “low risk” for ED symptoms and class two as the group “at higher risk” for ED symptoms.
Table 1 shows the descriptive statistics of the study variables in the analytic sample and the differences between the two classes. As can be seen, a higher number of white children and a lower number of Pakistani and Bangladeshi children comprised the group at lower risk for ED symptoms. In terms of CGT patterns, the group at higher risk for ED symptoms showed lower scores in risk-taking, quality of decision-making, and risk adjustment at age 11. The same individuals also showed higher scores in deliberation time and had higher levels of internalizing symptoms. Moreover, they were more likely to be in a family below the poverty line. At age 14 the higher risk group for ED symptoms still had lower scores in risk-taking, quality of decision-making, and risk adjustment but also showed higher scores in delay aversion compared to the lower risk group. Exploring the change in CGT scores between age 11 and age 14 we found that, across time, the group at higher risk for ED symptoms had a higher reduction in deliberation time scores and a lower increase in risk adjustment scores. Tables S4 and S5 in the supplementary material show the descriptive statistics of the study variables in males and females respectively. As can be seen, in males the higher risk for ED symptoms group had higher scores in risk-taking, delay aversion, internalizing and externalizing symptoms and lower scores in risk adjustment, quality of decision-making at age 11 and IQ. At age 14, they kept lower scores in risk adjustment and quality of decision-making and higher scores in delay aversion. In females, the higher risk for ED symptoms group had lower scores in quality of decision-making at ages 11 and 14 and lower scores in risk adjustment at age 14 only. They also showed higher internalizing and externalizing symptoms at age 11.
Table 1. Distribution between classes of the study variables in the analytic sample (n = 11,303) (unweighted).

* p < 0.05.
** p < 0.01.
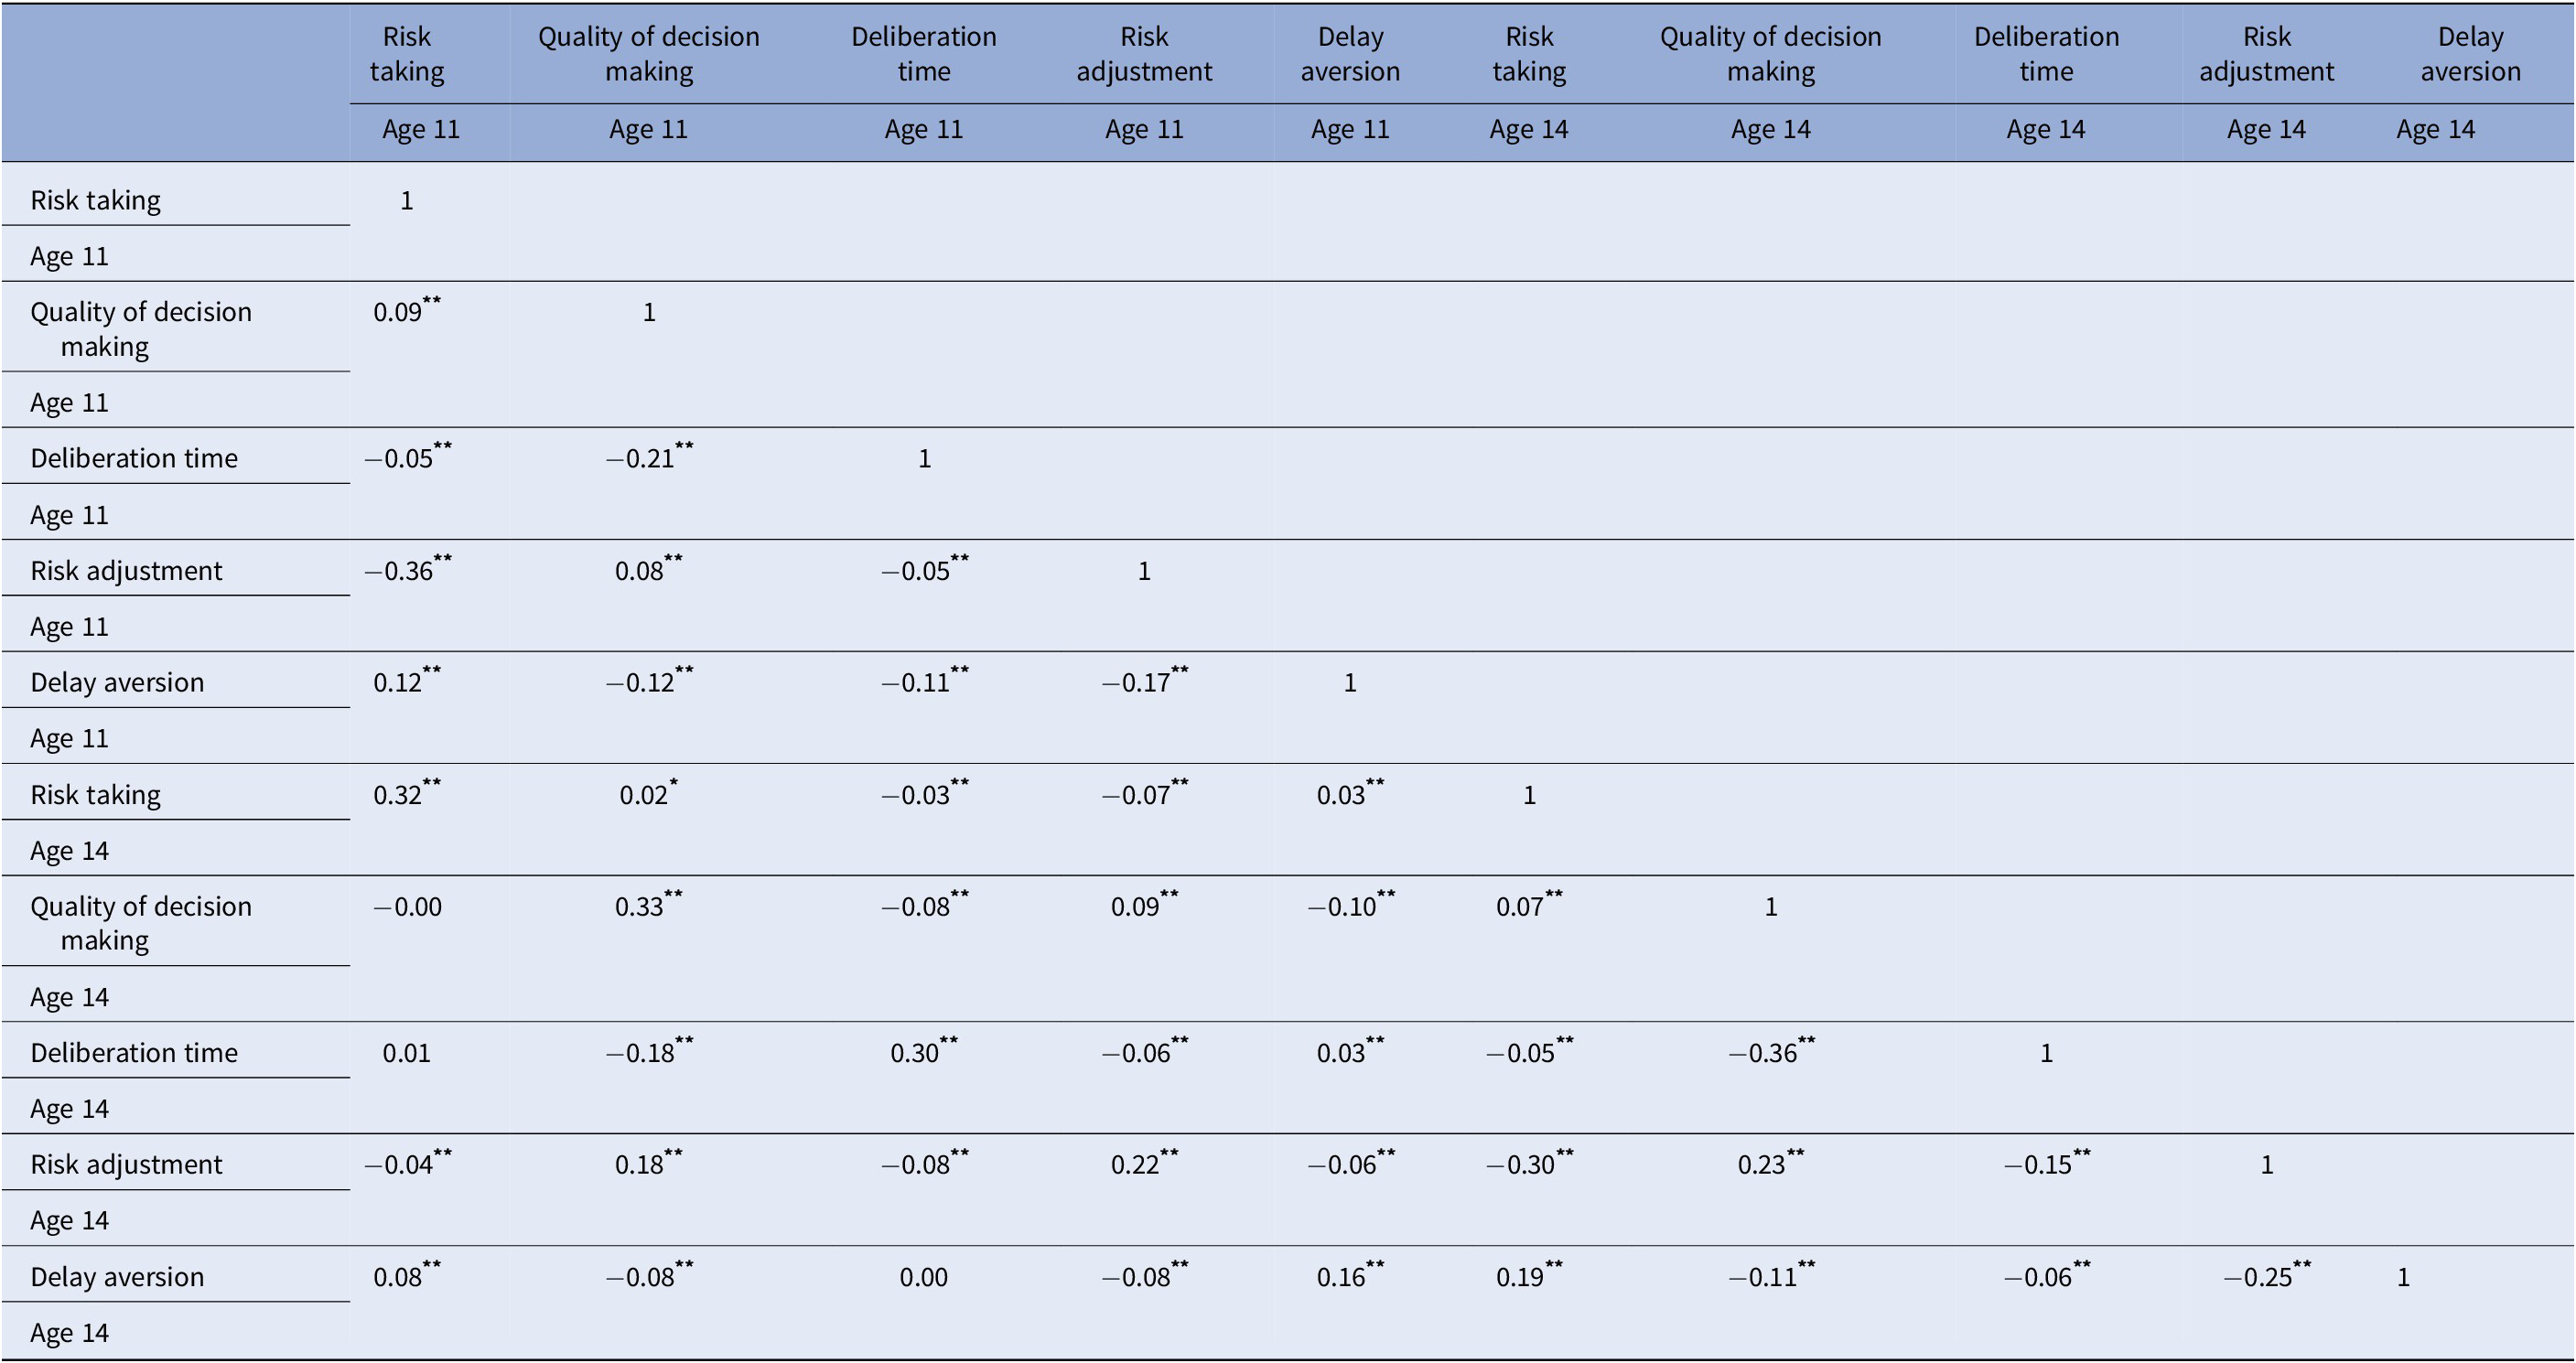
In Table 2 we report the correlation coefficients of the CGT variables at both time-points for the full analytic sample. As shown, correlations were generally low to moderate but, as expected, higher within-domain. That is CGT scores at age 11 correlated with CGT scores at age 14 within domain. Across domains, correlations were largest, consistently across time-points, for risk adjustment and risk-taking (−0.36 for age 11; −0.30 for age 14).
Table 2. Pearson’s correlations of the CGT variables at both time-points in the analytic sample (n = 11,303).
* p < 0.05.
** p < 0.01.
We display the results (on both complete and imputed cases) of our logistic regression models in Table 3. As can be seen, our unadjusted model (Model 1) on imputed data showed that 1-unit increases in risk-taking and risk adjustment at age 11 were associated, respectively with 47 and 11% lower probability of being at higher risk for ED symptoms at age 14 (risk-taking b = −0.62, OR = 0.53, p < 0.01; risk adjustment b = −0.11, OR = 0.89, p < 0.05). We obtained the same results in the imputed and complete cases analysis. In our fully adjusted model (Model 2) after imputation we found that for a 1-unit increase in risk-taking score at age 11 the odds of being at higher risk for ED symptoms at age 14 increased by 2.7 times (b = 1.00, OR = 2.73, p < 0.01). In contrast, a 1-unit increase in quality of decision-making score at age 11 was associated with a 62% lower probability of being at higher risk for ED symptoms at age 14 (b = −0.94, OR = 0.38, p < 0.05). Importantly, the change in risk-taking scores between age 11 and age 14 was also associated with the odds of being in the higher risk groups for ED symptoms. A smaller reduction in risk-taking over time was associated with a higher probability of being at higher risk for ED symptoms at age 14 (b = 0.62, OR = 1.87, p < 0.05).
Table 3 Logistic regression models showing the probability of belonging to the higher vs low risk for ED symptoms.
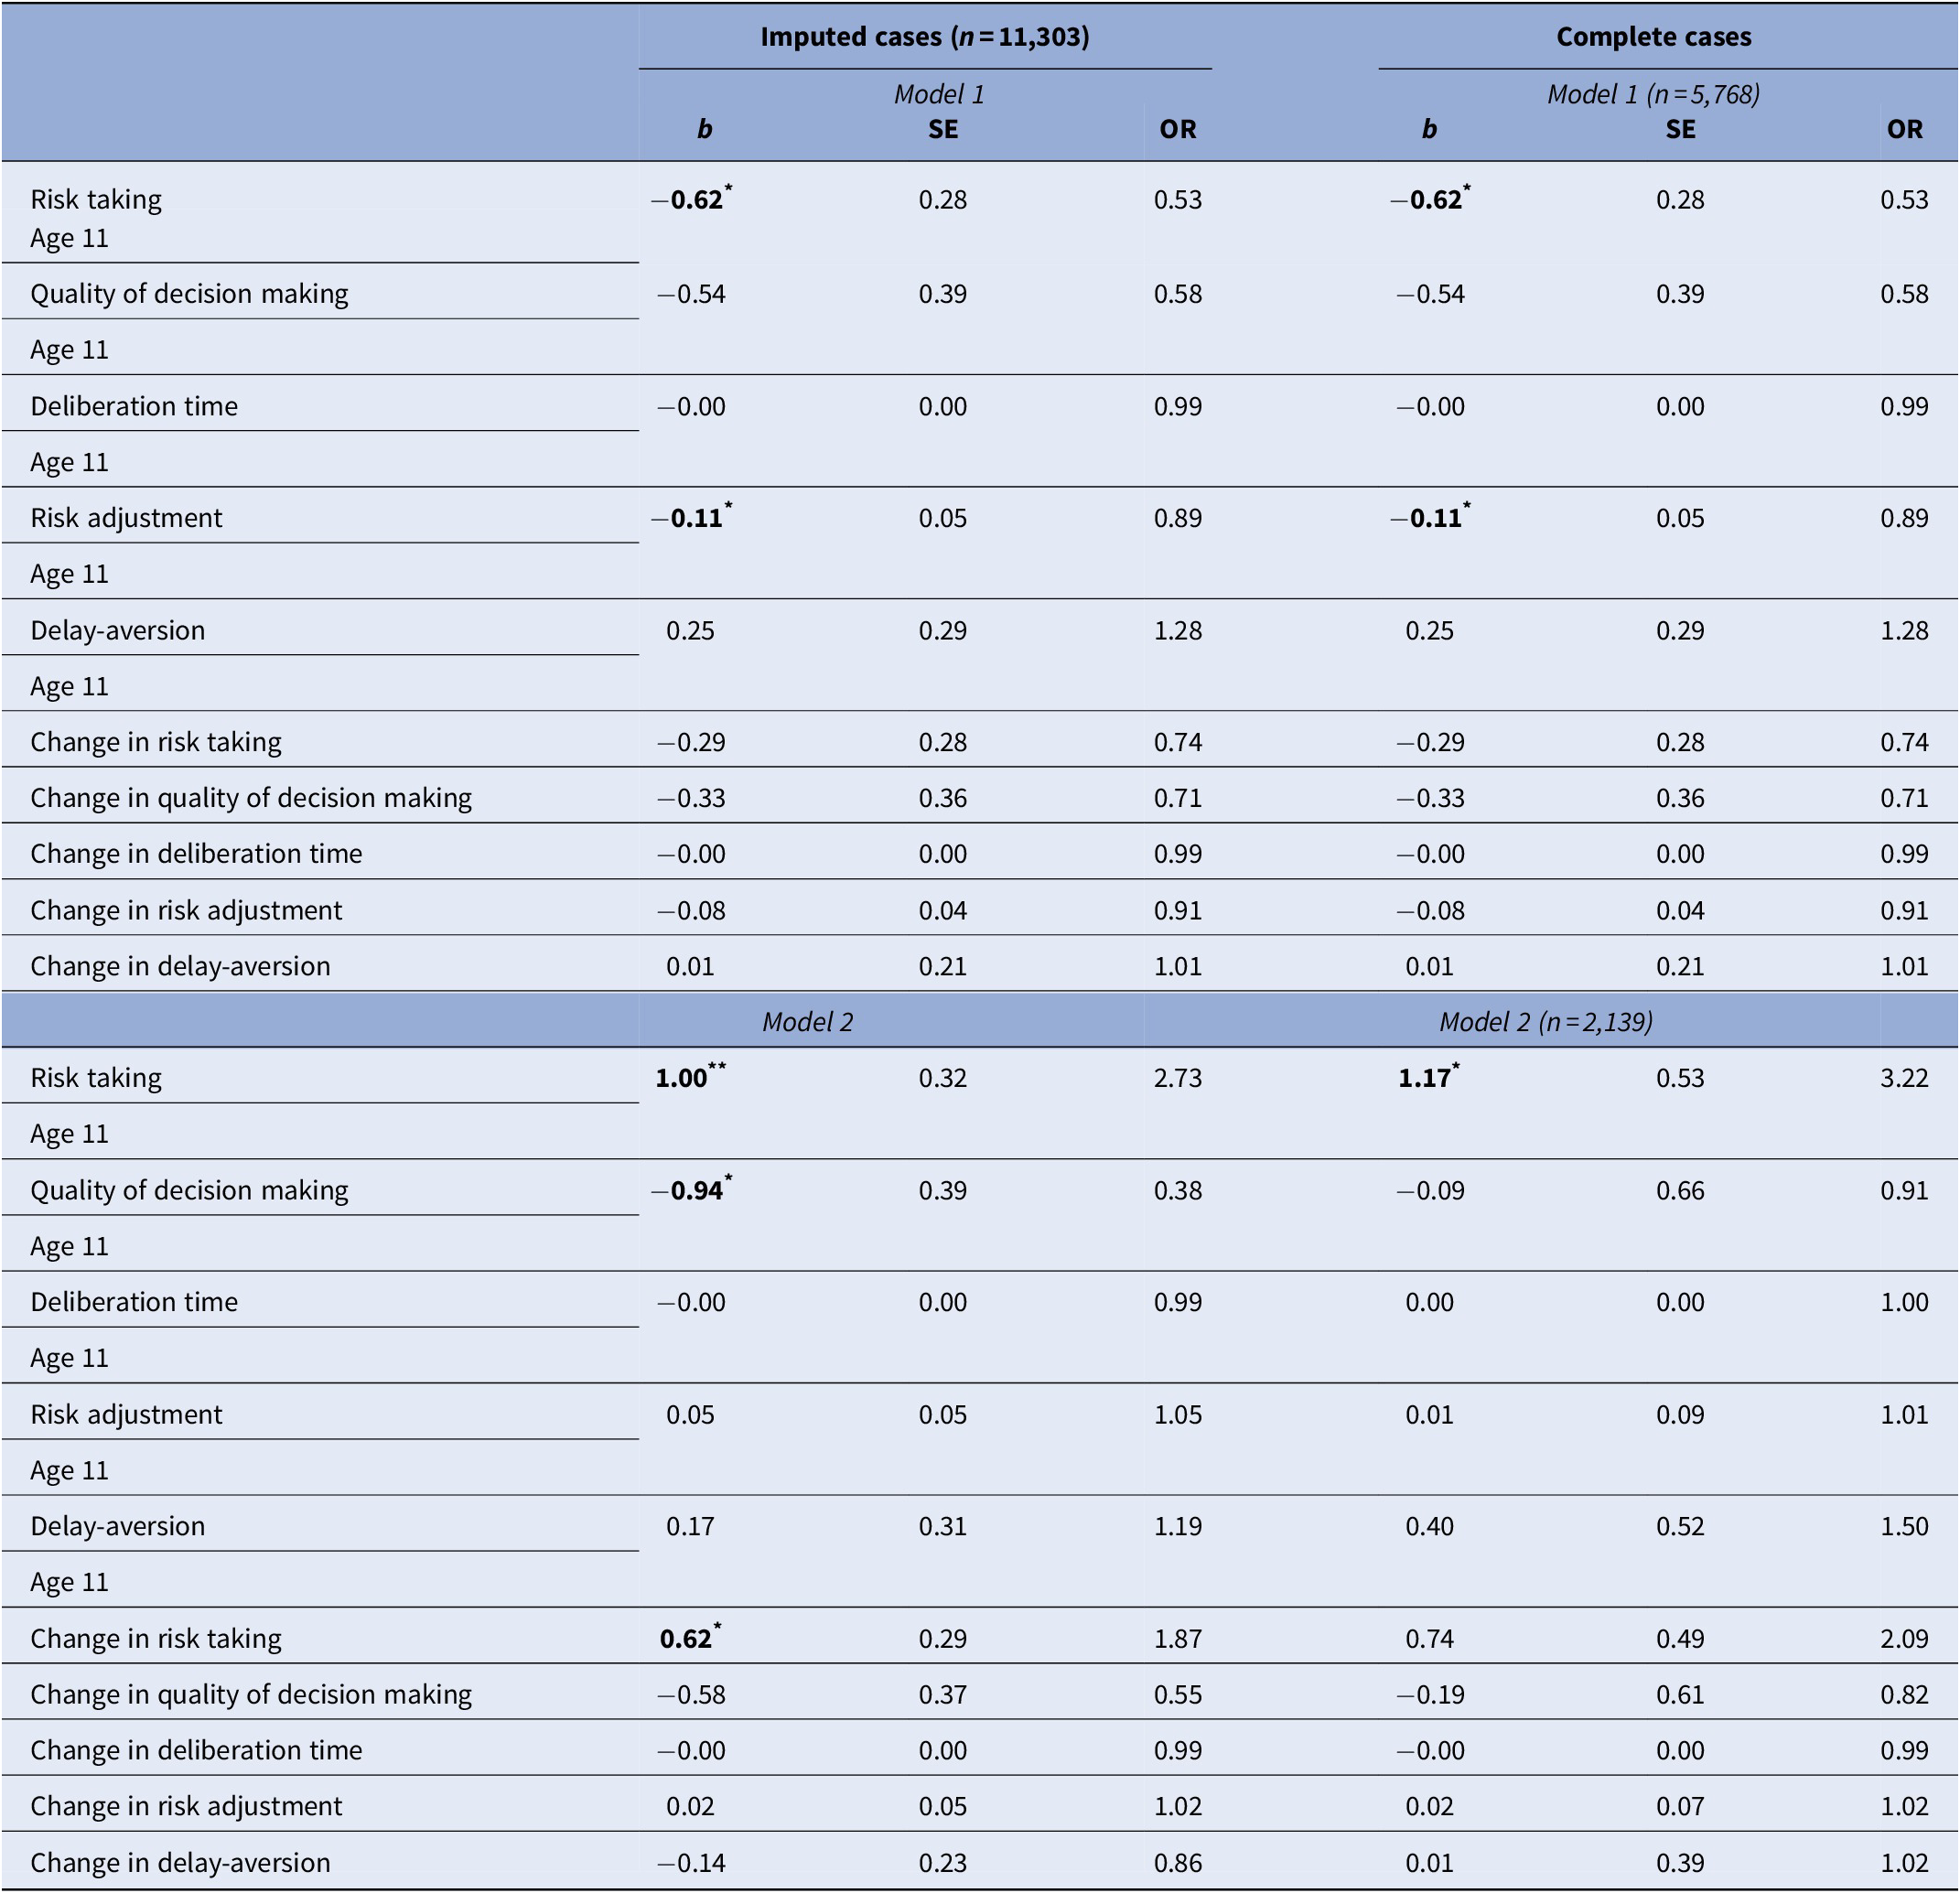
Model 1 = CGT measures; Model 2 = Model 1+ gender, ethnicity, SES, IQ at age 5, pubertal status, exact age, internalizing and externalizing symptoms at age 11 and accelerometer data at age 14.
* p < 0.05.
** p < 0.01.
Discussion
To our knowledge, this is the first general-population study to investigate the role of change in decision-making skills (risk-taking, quality of decision-making, risk adjustment, deliberation time, delay aversion) over time in adolescence in ED symptomatology. We explored this across two time-points in adolescence (ages 11 and 14 years) and found that those at higher risk of ED symptoms at age 14 years had at the previous time-point (age 11 years) higher scores on risk-taking and lower scores on quality of decision-making. The association was robust to adjustment for decision-making skills at age 14 as well as confounders. Importantly, a smaller reduction in risk-taking over time (between ages 11 and 14) was associated with a higher risk of developing ED symptoms at age 14.
Our LCA identified two distinct groups. Individuals belonging to group 1 were at low risk of developing ED symptoms as they showed: lower risk of perceiving their body as overweight; less intention to lose weight; less nutritional restriction; less use of exercise with the purpose of influencing their body weight; and lower risk of being under or overweight according to the UK90 reference cut-offs. On the contrary, individuals belonging to group 2 were at higher risk of developing ED symptoms as they showed: higher risk of perceiving their body as overweight; more intention to lose weight; more nutritional restriction; more use of exercise with the purpose of influencing their body weight; and higher risk of being overweight according to the UK90 reference cut-off. The group at higher risk for ED symptoms showed significantly lower scores on risk-taking, quality of decision-making, and risk adjustment at age 11 compared to the group at low risk for ED symptoms. We observed the same results in the two groups at age 14. Moreover, at age 14 the group at higher risk for ED symptoms showed higher scores on delay aversion. Deliberation time was slower for that group at age 11 but the two groups did not differ in the age 14 scores. Focusing on the change over time in the CGT scores, we found that at age 14, compared to age 11, both groups appeared to show less risk-taking, deliberation time, and delay aversion but the greater quality of decision-making and risk adjustment.
Overall, the direction of these changes suggests that both groups appeared to follow, broadly, the same developmental trajectories of decision-making skills. However, in our descriptive “unadjusted” analysis, we also found that there were some significant differences in the amount of change for the two groups. The higher risk group displayed a greater reduction in deliberation time and less improvement in risk adjustment, compared to the group at low risk for ED symptoms. The finding with respect to risk adjustment can be taken as evidence for the much-discussed inflexibility in reward processing shown by those at risk of ED symptoms. The finding with respect to the reduction in deliberation time must be considered alongside the two groups’ absolute levels of deliberation time in the two time-points. The higher risk group did not differ in absolute terms from their low-risk counterparts at age 14. They merely showed much slower times at age 11. Together, these findings suggest that developmental lags in response (or processing) time may indicate the risk of ED symptoms in the general adolescent population. This is important to consider alongside the null findings with respect to group differences in IQ in our sample. Overall, we observe a small improvement in decision-making in the “normative” group, in line with the evidence on the average trajectory of decision-making across adolescence described in previous studies [Reference Smith, Xiao and Bechara10]. Our findings are also in line with other studies that found impaired decision-making abilities in adolescents with EDs [Reference Kittel, Schmidt and Hilbert28,Reference Reiter, Heinze, Schlagenhauf and Deserno29].
In our final regression model controlling for all covariates, the association between risk-taking at age 11 and the risk for ED symptoms at age 14 was reversed. That is, risk-taking at age 11 was related positively to risk for ED symptoms at age 14 after adjustment for confounders. This phenomenon is sometimes known as the Lord’s paradox [Reference Tu and Gunnell30] and is relevant to situations where some of the covariates lie on a causal pathway. In our case, the risk for developing ED symptoms was higher when risk-taking was higher after adjusting for gender. These findings are in line with previous studies about gender differences [Reference Van Leijenhorst, Westenberg and Crone18] in decision-making and EDs [Reference Harvey and Robinson31]. In addition, we found that better quality of decision-making at age 11 was associated with a lower likelihood of being at risk for ED symptoms at age 14, and, as discussed earlier, that less reduction over time in risk-taking was associated with the risk of developing ED symptoms. Less reduction in risk-taking scores across this period may be taken to suggest that trait-like reward sensitivity early in adolescence may be a putative risk factor for later EDs. This, in turn, would be in line with findings from neurobiological studies about a dysregulated reward circuitry function in EDs [Reference Dichter, Damiano and Allen32,Reference Guillaume, Gorwood, Jollant, Van den Eynde, Courtet and Richard-Devantoy33].
Our findings come with some limitations. First, given the multidisciplinary nature of the MCS, we did not have a clinical interview for EDs available. However, we used a broad classification system to detect ED symptomatology which may be more appropriate with a general population sample. For instance, the residual “eating disorder not otherwise specified” category, which describes the most heterogeneous ED category, has been consistently found as the most common ED diagnosis in clinical samples. These results highlight the importance of using a broader approach in considering ED symptomatology especially when investigating a young community sample. Second, ED symptoms in MCS were measured for the first time at age 14 so we could not control for them at age 11, when we first measured decision-making. Third, we found significant, albeit very small, differences in CGT scores between the two groups, which suggests that CGT may have limited value in clinical practice. Nevertheless, it is important to keep in mind that both our groups come from a general population cohort. Thus, one should not expect to find the same differences typically shown between clinical and healthy control groups. Fourth, as we used the recommended cut-offs for underweight and overweight from the UK90, the second centile likely underestimates underweight and is not direct equivalent to the 85th centile for overweight. This could explain why we find a relatively small number of individuals in the cohort with significant underweight. In future work, we could consider other cut-offs, such as weight for height percentiles based on World Health Organization Growth Charts. Finally, there are the limitations of the CGT. Risk-taking conflates the seeking of reward and the avoidance of punishment. Reduced betting, even when the odds of winning are high, might occur because participants are less motivated by reward or because they want to avoid loss (punishment), and this cannot be disentangled in this task.
Conclusions
This study sheds light on the role of decision-making skills in ED symptomatology in adolescence. If replicated in a clinical sample our results might help to structure new interventions targeting modifiable risk factors for the development of EDs, thus helping young individuals to achieve better outcomes. We filled an important gap in the literature by showing how the development of decision-making under risky conditions across early and middle adolescence may be related to the risk for ED psychopathology in middle adolescence. Future studies should explore our findings in older populations (i.e., late adolescence/young adulthood) as well.
Acknowledgments
We are extremely grateful to all the families who took part in this study and the whole MCS team.
Financial Support
This project is funded by a Medical Research Council awarded to Dr Amy Harrison, Principal Investigator, and Prof Eirini Flouri, Co-Investigator, ref: MR/SO19707/1.
Conflicts of Interest
The authors report no biomedical financial interests or potential conflicts of interest.
Data Availability Statement
The data that support the findings of this study are openly available from the UK data service website (https://ukdataservice.ac.uk/).
Supplementary Materials
To view supplementary material for this article, please visit http://dx.doi.org/10.1192/j.eurpsy.2020.92.


 Open access
Comments
No Comments have been published for this article.