


In the USA, 26 % and 14 % of mortality and disability-adjusted life years, respectively, are related to our dietary patterns( Reference Murray, Atkinson and Bhalla 1 ). Traditionally, diets high in total energy, refined carbohydrates, and red and processed meats have been implicated in the development of obesity, diabetes and common co-morbidities, particularly CVD( Reference Mannisto, Kontto and Kataja-Tuomola 2 – Reference Pan, Sun and Bernstein 4 ), while diets high in fruit and vegetables are associated with reduced risks( Reference Narayan, Zhang and Kanaya 5 , Reference Muraki, Imamura and Manson 6 ). Currently, more than one-third (36 %) of American adults are obese( Reference Ogden, Carroll and Kit 7 ) and 12 % have diabetes( Reference Cheng, Imperatore and Geiss 8 ), while heart disease is the leading cause of death( Reference Go, Mozaffarian and Roger 9 ).
Finding suitable policy interventions that positively influence the nation’s diet and resulting cardiometabolic health has been challenging. The US Department of Agriculture (USDA) and US Department of Health and Human Services set nutritional recommendations that encourage consumption of diets high in fruits and vegetables and lower in energy, sugar, salt and saturated fat, but a recent report suggests that the majority of Americans do not meet these dietary guidelines( Reference Brody 10 ). Moreover, current US agricultural policies promote the production of refined grains, dairy and meat products. From 1995 to 2010, 83 % of the $US 194 billion total in government agricultural subsidies under Title I (commodity payments that subsidy the production of crops) of the Farm Bill went to five commodity crops: corn, soyabeans, wheat, rice and sorghum. In the same period, the USDA spent an additional $US 5 billion and $US 4 billion on dairy and livestock programmes, respectively. A large proportion of the grain commodities become feed for livestock or ingredients in processed food. In contrast, apples are the only fresh fruit or vegetable receiving significant federal commodity payments; from 1995 to 2010, $US 262 million was spent on apples( 11 ).
Ecological data suggest that US agricultural policies influence food consumption and, thereby, cardiometabolic health( Reference Powell and Chaloupka 12 , Reference Eyles, Ni Mhurchu and Nghiem 13 ), but we lack individual-level, non-ecological evidence on whether and how an individual’s consumption of these commodities is associated with health status. There is utility in examining what people with high-subsidized diets are eating: if diets higher in foods derived from subsidized commodities are found to be less healthy than those that are unsubsidized, this would support the need to better align agricultural and nutritional policies in order to improve the nutritional composition of US diets. To date, however, no study has empirically and systematically quantified individual-level consumption of foods derived from subsidized commodities. We aim to fill this gap. In the present paper we describe a method to estimate the proportion of total daily dietary energy intake that comes from the seven commodities (corn, soyabeans, wheat, rice, sorghum, dairy and livestock) that from 1995 to 2010 received the most federal subsidy dollars overall.
Methods
To trace these food commodities through the food system, we used several federal databases, each of which provided key pieces of information.
Data sources
National Health and Nutrition Examination Survey
We used information from the National Health and Nutrition Examination Survey (NHANES)( 14 ) to determine the actual intake of specific foods. The National Center for Health Statistics at the Centers for Disease Control and Prevention conducts continuous, cross-sectional surveys of the US population in 2-year cycles. NHANES uses stratified, multistage, probability cluster sampling to ensure adequate representation of the nation’s non-institutionalized civilian population. We pooled NHANES dietary data from 2001 to 2006, recent years in which the sampling and dietary measurement methods were similar across the 2-year cycles. Dietary intake data were collected through 24 h dietary recall (1 d in the 2001–2002 cycle; 2 d in 2003–2004 and 2 d in 2005–2006); to ensure methodological consistency, we used data from only the first survey day of each survey cycle. Nutrient content of foods reported in NHANES included total intakes in kilocalories and grams as determined by standardized food composition databases( 15 , 16 ). With the NHANES database restricted to individuals aged 18–64 years, a total of 11 811 non-elderly adults from 2001–2006 surveys completed the first day of 24 h recalls and examination.
MyPyramid Equivalency Database
The MyPyramid Equivalency Database (MPED)( Reference Bowman, Friday and Moshfegh 17 ) provides the number of MyPyramid equivalents (standard serving sizes of grams, cups, ounces or teaspoons) of major food categories (grains, meat, dairy, fruit, vegetables and beans, as well as for added sugars and discretionary fat) that each NHANES participant reports consuming daily. We used MPED version 1·0 for NHANES data collected in 2001–2002, and version 2·0 for data in 2003–2006.Footnote *
Food Intakes Converted to Retail Commodities Database
Similar to the MPED, the Food Intakes Converted to Retail Commodities Database (FICRCD)( Reference Bowman, Martin and Friday 18 ) provides the number of grams of sixty-five commodities in each 100 g of food, including food commodities of interest: dairy, fats and oils, fruit, grains, meat, poultry, fish and eggs, nuts, caloric sweeteners and vegetables. This conversion database was developed for the foods reported in various national surveys, including NHANES 2001–2002.Footnote †
What We Eat In America Food Commodity Intake Database
The What We Eat In America Food Commodity Intake Database (WWEIA)( 19 ), produced by the Environmental Protection Agency, provides information about the gram weights of certain food commodities, including farm-raised fish, soyabean oil and sorghum syrup, present in foods reported in NHANES 2001–2002 to 2007–2008.Footnote ‡
Tracing food commodities throughout the food system
Our objective was to identify, for each individual, the number of grams consumed from the seven subsidized commodities and those consumed from all other sources. Although many forms of food subsidies exist, we focus on commodity programmes in Title I of the US Farm Bill( Reference Weber and Becker 20 ). The majority (80–90 %) of food subsidy dollars are spent on only seven key food commodities (corn, soyabeans, wheat, rice, sorghum, dairy and livestock). Supplemental Table 1 (see online supplementary material) shows how spending on individual commodities varies across programmes as well as across years. However, these commodities are abundant throughout our food system. For this reason, in estimating consumption of subsidized food commodities, it is important to include not only the raw commodities, but also their numerous end-products and by-products. For example, a large proportion of commodities become feed for livestock and farm-raised fish or ingredients in highly processed foods. Of the corn grown in the USA, approximately 5 % is consumed as sweet corn, corn meal or corn starch; the majority is incorporated into processed foods and made into high-fructose corn syrup or is used as feed for livestock, which is then turned into dairy and meat products( 21 ). As another example, approximately 1 % of the sorghum grown in the USA is turned into molasses; the rest is grain sorghum, which is used as feed for livestock.
We used data from NHANES to identify the quantity consumed and which food items (e.g. hamburgers) were consumed. We used MPED to derive the daily amounts (in ounces or teaspoons) of soya products and added sweeteners in each food. To identify corn sweeteners specifically from the added sweetener category, we used the Glinsmann method( Reference Glinsmann, Irausquin and Park 22 , Reference Duffey and Popkin 23 ), which uses data on availability of natural and added sugars, including high-fructose corn syrup, sucrose and other corn sweeteners, to create category-wide estimates of the proportion of added sweetener that is derived from corn for various industry sectors: dairy products; bakery and cereal products; canned, bottled and frozen foods; confectionery and related products; beverages; and all other foods( Reference Glinsmann, Irausquin and Park 22 , Reference Duffey and Popkin 23 ). We applied this to the individual diet by multiplying each individual’s added sugar consumption by these category-wide estimates for the proportion of added sweetener that is derived from corn. We converted the amounts of soya and corn sweeteners from ounces/teaspoons into grams using conversion factors of 28·3495 g/ounce and 16 g/teaspoon( 15 ).
We used FICRCD to estimate the amount (in grams) of whole corn, corn flour/corn starch, soyabean meal (feed), grain sorghum (feed), wheat, rice, dairy (milk, yoghurt, cheese, butter) and meat (beef, pork, chicken) per 100 g of each reported food item in NHANES. We used WWEIA for soyabean oil, farm-raised fish and sorghum syrup. To convert these values into the amounts of commodities (in grams) consumed, we multiplied the percentages by the total amount (in grams) of the food consumed as reported in NHANES.
From these four sources, we estimated the grams of food commodities of interest consumed by each NHANES participant. To account for imported foods (which do not receive US subsidies), we divided each commodity category (meats, dairy, grains) by the appropriate number according to the percentage of that category imported in 2002, 2004 and 2006, as reported by the USDA( Reference Jerardo 24 ). These percentages are shown in Supplemental Table 2 (see online supplementary material).
Subsidy Score
We multiplied the total amount of foods (in grams) by the energy (kilocalories per gram) to obtain the total energy consumed from each commodity. We obtained energy per gram from the USDA’s National Nutrient Database for Standard Reference( 15 ). For commodity categories with a range of kilocalories per gram (such as cheese), we calculated the median value across the category and used that for our calculations. We used the median rather than the mean value due to the skewed nature of these food categories. We also performed sensitivity analyses using the 25th and 75th percentile values across each category.
We computed the Subsidy Score (also referred to below as the ‘score’) as the proportion of total energy derived from subsidized commodities. Specifically, we divided the total energy from subsidized commodities by the total energy intake (in kilocalories per day), using the formula:
 $$\eqalign{{\bigg[{\left( {\mathop{\sum}\nolimits_{i=1}^n {MPED_{i} \cdot Kcal_{i} } } \right){\plus}\Big( {\mathop{\sum}\nolimits_{j=1}^n {FICRCD_{j} \cdot {\textstyle{{Grams_{j} } \over {100}}} \,\,\cdot } \,\,Kcal_{j} } \right\Big)}}\cr\quad\quad{{\plus}\left( {\mathop{\sum}\nolimits_{k=1}^n {WWEIA_{k} } \cdot Kcal_{k} } \right)}\Big]\Big/ {TotalDailyKcal}}$$
where MPED i is the grams consumed daily of each subsidized commodity from MPED (soya products and corn sweeteners), FICRCD j is the grams per 100 g of food item of each of the commodities from FICRCD (corn flour/starch, corn/soyabean meal/sorghum used as feed, wheat, rice, dairy and meat), and WWEIA k is the grams of each of the commodities from WWEIA (soyabean oil, farm-raised fish, sorghum consumed by people). Grams is the number of grams of the food item consumed (provided by NHANES); Kcal is the amount of energy (in kilocalories) per gram of food item; and TotalDailyKcal is the total daily energy intake (in kilocalories).
As initially computed, 0·46 % of scores exceeded 1·0 (maximum value: 1·27). We truncated these scores at a theoretical maximum of 1·0. Thus, the score ranges from 0·0 to 1·0, where 0·0 indicates zero percentage of total energy from commodities and 1·0 indicates 100 % of total energy from commodities.
Statistics
We used the statistical software package SAS version 9·2 for calculations and analyses, and SAS-callable SUDAAN version 10·0 to adjust for the complex sample design used in NHANES. To ensure results are representative of the US population aged 18–64 years, we applied sample weights for the six years of data that reflected the probability of selection and non-response.
We calculated weighted medians and interquartile ranges (IQR) for the score. To check whether the score performs as expected, with individuals with low v. high scores consuming relatively small and large amounts of subsidized commodities, respectively, and to examine the relative healthfulness of a high v. low score, we split our sample population into deciles of the score and calculated the mean amount (in grams) of commodities, total fats, total sugars and total energy consumed in each decile. We calculated P values for overall trend using the F test. Additionally, we randomly selected two individuals each from the 10th, 50th and 90th percentile of the score to compare the actualfoods consumed by individuals with low, median and high scores.
We also calculated medians and IQR, as well as means and 95 % CI of the score by key demographic subgroups that differ in their food consumption patterns and risk for cardiometabolic disease, specifically: age (categorized into 10-year intervals); sex (male/female); self-reported race/ethnicity (non-Hispanic White, non-Hispanic Black, Mexican American, Other); educational attainment (less than high school, high school, some college, college graduate or above); and socio-economic status (determined using tertiles of the poverty–income ratio (PIR)). PIR is an index of income in relation to family need, derived from household income and federally established poverty thresholds based on family size and cost of living as reported by the Consumer Price Index( 25 ). We categorized PIR according to eligibility for food assistance programmes: <130 % of the poverty level (eligible for the Supplemental Nutrition Assistance Program and free school meals), 130–185 % of the poverty level (eligible for the Special Supplemental Nutrition Program for Women, Infants, and Children), >185 % of poverty level (high income). We used F tests to compare Subsidy Score means across groups; all P values were two-sided; P<0·05 was considered statistically significant.
We also performed multivariate logistic regression (categorizing the score as ‘high’ (in the highest 30th percentile, >0·6362) or ‘low’ (in the lowest 30th percentile, <0·4935)) to investigate associations between various demographic subgroups and odds of having a high v. low score. Prevalence ratios (PR) and 95 % CI derived from predicted marginal probabilities are reported and P values were calculated using the Wald F test.
Validation
Since the construction of our main score, the Subsidy Score, is novel, we performed an internal validation to test its reliability. To do this, we used a split-sample comparison by dividing our 2001–2006 NHANES sample into two even random samples and comparing the mean (95 % CI), median (IQR) and distribution of the score for each sample. We also assessed the association between the score and a commonly used diet quality index. The Healthy Eating Index-2010 (HEI-2010) is a measure of diet quality that assesses conformance to federal dietary guidance (Dietary Guidelines for Americans 2010) and measures adequate intake of fruits and vegetables, whole grains, dairy, total and seafood and plant protein, and fatty acids, and moderate consumption of refined grains, sodium and empty calories( 26 ). We examined mean HEI-2010 scores across deciles of the Subsidy Score, using the F test to calculate P values for overall trend.
Results
The Subsidy Score estimated for the adult, non-elderly population displayed a near normal distribution (Fig. 1). Among US adults aged 18–64 years, the median score was 56·7 % (IQR 47·2–65·4 %) and the mean score was 56·1 % (95 % CI 55·7, 56·6 %; Table 1). Table 2 shows food intake amounts by Subsidy Score decile. While total energy decreased significantly from decile 1 to decile 10 (P<0·001), the amount of total fats increased from decile 1 to decile 7, at which point it began to decrease until decile 10 (P value for trend <0·001). As could be expected, the mean intakes of total and higher-fat milk (but not skimmed milk), butter, cheese, yoghurt, eggs, grains and total meat (and beef, pork, chicken and turkey individually) were significantly higher in decile 10 compared with decile 1 (P<0·05) and the mean intakes of vegetables (excluding sweet corn) and fruit, as well as overall diet quality as measured by the HEI-2010, were significantly lower in decile 10 compared with decile 1 (P<0·001). Random selection of individuals in the 10th, 50th and 90th percentile of the score showed a range of diets, whereby an individual with a lower score consumed a diet relatively higher in foods derived from non-subsidized commodities (peanut butter, fruit, vegetables, chocolate, coffee, wine) and an individual with a higher score consumed a diet higher in foods derived from subsidized commodities (whole milk, meat, and grains like pasta and rice; Table 2).
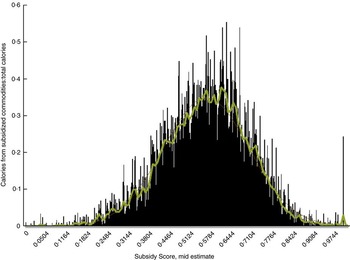
Fig. 1 Distribution of the Subsidy Score among US adults (n 11 811) aged 18–64 years, National Health and Nutrition Examination Survey 2001–2006 (mean=0·561254, median=0·566949; sd=0·137782, maximum=1, minimum=0, skewness=–0·183540, kurtosis=0·272957)
Table 1 Percentage of dietary energy from subsidized food commodities, overall and by age, sex, race/ethnicity, educational attainment and socio-economic status, among US adults (n 11 811) aged 18–64 years, National Health and Nutrition Examination Survey 2001–2006
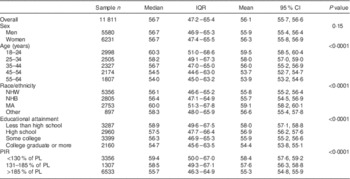
IQR, interquartile range; NHW, non-Hispanic White; NHB, non-Hispanic Black; MA, Mexican American; PIR, poverty–income ratio; PL, poverty level.
Data on educational status were missing for five individuals; data on PIR were missing for 615 individuals.
Table 2 Food intake amounts by Subsidy Score decile among US adults (n 11 811) aged 18–64 years, National Health and Nutrition Examination Survey 2001–2006

Total energy is reported in kilocalories (1 kcal=4·184 kJ). All dietary components are in grams. ‘Vegetables’ category excludes sweet corn. HEI-2010 is the Healthy Eating Index-2010. Subsidy Score deciles are broken down as follows: 1st (≤0·3868); 2nd (0·3869–0·4465); 3rd (0·4466–0·4935); 4th (0·4936–0·5327); 5th (0·5328–0·5669); 6th (0·5670–0·6024); 7th (0·6025–0·6362); 8th (0·6363–0·6755); 9th (0·6756–0·7310); 10th (>0·7310). P values are for overall trend (F test).
The score varied by demographic subgroups. Individuals aged 18–24 years had a higher mean score (59·5 %; 95 % CI 58·5, 60·4 %) than adults aged 55–64 years (53·9 %; 95 % CI 53·2, 54·6 %). Compared with non-Hispanic Whites (55·8 %; 95 % CI 55·2, 56·4 %), non-Hispanic Blacks (55·7 %; 95 % CI 54·5, 56·9 %) and Mexican Americans (59·1 %; 95 % CI 58·2, 60·1 %) had higher mean scores. The Subsidy Score varied across levels of educational attainment, with higher scores among individuals reporting less than a high-school education compared with college or higher-educated individuals (58·0 %; 95 % CI 57·1, 58·8 % v. 54·4; 95 % CI 53·8, 55·1 %). Those in the lowest category of PIR had higher scores than those in the highest category (58·4; 95 % CI 57·6, 59·2 % v. 55·3; 95 % CI 54·8, 55·9 %). The score did not vary by sex (P=0·15; Table 1).
In models adjusted for age, sex, race/ethnicity, education and income, we noted that age, education and income remained independently associated with a high Subsidy Score. Compared with individuals aged 55–64 years, higher proportions of those aged 18–24 years (PR=1·50; 95 % CI 1·34, 1·68), those aged 25–34 years (PR=1·40; 95 % CI 1·24, 1·57) and those aged 35–44 years (PR=1·21; 95 % CI 1·07, 1·36) consumed diets with high a Subsidy Score. Compared with non-Hispanic Whites, 20 % more Mexican Americans had high scores (PR=1·20; 95 % CI 1·07, 1·35). Compared with college-educated individuals, 21 % more of those with less than a high-school education (PR=1·21; 95 % CI 1·08, 1·36) and 18 % more of those with a high-school education alone (PR=1·18; 95 % CI 1·07, 1·30) consumed high diets with a Subsidy Score. Compared with individuals in the highest PIR category (representing higher socio-economic status), 11 % more of those in the lowest PIR category (lowest socio-economic status: PR=1·11; 95 % CI 1·03, 1·20) consumed diets with a high Subsidy Score. Controlling for covariates, scores did not vary significantly by sex or across race/ethnicity (Table 3).
Table 3 Multivariate logistic regression to predict the probability of having a high v. low Subsidy Score among US adults (n 11 811) aged 18–64 years, National Health and Nutrition Examination Survey 2001–2006

PR, prevalence ratio; NHW, non-Hispanic White; NHB, non-Hispanic Black; MA, Mexican American; PIR, poverty–income ratio; Ref., referent category.
The dependent variable was defined as score values in the lowest 30th percentile (<0·4935) v. values in the highest 30th percentile (>0·6362). The reference category was low score (i.e. <0·4935). Wald F tests were used to determine P values.
Sensitivity analysis
We performed a sensitivity analyses in which we calculated the Subsidy Score using the 25th and 75th percentile values for the amount of energy (kilocalories) per gram of commodity categories from the USDA’s National Nutrient Database for Standard Reference( 15 ). In this sensitivity analysis, the score also had a relatively normal distribution and respective means of 50·2 % and 64·2 % (Supplemental Fig. 1 and Supplemental Table 3; see online supplementary material).
Validation
Results from the split-sample validation of the Subsidy Score suggested strong reliability: sample 1 (n 5905) had a median score of 56·7 % (IQR 47·3–65·4 %) and a mean score of 56·1 % (95 % CI 55·5, 56·6 %), while sample 2 (n 5906) had a median score of 56·7 % (IQR 47·0–65·4 %) and a mean score of 56·2 % (95 % CI 55·5, 56·8 %).
Results from the regression of Subsidy Score v. HEI-2010 suggested the two scores are negatively correlated, with a mean HEI-2010 score of 54·2 (95 % CI 52·9, 55·5) among individuals in decile 1 of the Subsidy Score and a mean HEI-2010 score of 41·5 (95 % CI 40·1, 42·9) among individuals in decile 10 of the Subsidy Score (P value for trend <0·001). Food intake amounts by HEI-2010 decile are presented in Supplemental Table 4 (see online supplementary material).
Discussion
Overall, US non-elderly adults (aged 18–64 years) consume more than half (56·7 %) of their total daily energy intake in the form of foods derived from seven subsidized commodities: corn, soyabeans, wheat, rice, sorghum, dairy and livestock. Young adults, Mexican Americans, lower-educated and lower-income individuals had a larger percentage of their diets comprised of foods derived from these subsidized commodities. Adjusted for common sociodemographic factors, younger, lower-educated and lower-income individuals were significantly more likely to have a high v. low Subsidy Score diet. As Table 2 shows, the diets of individuals with higher scores tended to be rich in high-fat dairy, grains and meat products, and poor in fruits and vegetables as well as overall diet quality (as measured by HEI-2010).
The present study is the first one to empirically examine the distribution and the consumption of foods derived from subsidized food commodities in a representative sample of the US adult population (different from those captured in other diet quality indices like HEI-2010, a commonly used measure of overall diet quality as related to cardiometabolic disease). Since diet quality is strongly associated with diabetes and obesity (including long-term weight gain), this understanding is critical for informing agricultural policy in the USA. For example, results from a systematic review and meta-analysis of dietary patterns (rather than specific foods) and type 2 diabetes risk indicate that dietary patterns consisting of healthy foods and/or nutrient choices and with higher energy contributions from wholegrain products, fruit and vegetables may decrease the risk of type 2 diabetes. In contrast, dietary patterns represented by unhealthy food choices and higher energy contributions from foods such as red or processed meats, high-fat dairy refined grains and sweets may increase the risk of developing type 2 diabetes( Reference Alhazmi, Stojanovski and McEvoy 27 ). A prospective analysis of three separate cohorts found specific dietary (higher consumption of potato chips, potatoes, sugar-sweetened beverages, unprocessed red meats and processed meats; lower consumption of whole grains, fruits, vegetables, nuts and yoghurt) and lifestyle (physical inactivity, alcohol use, smoking, sleep and television watching) factors to be independently associated with long-term weight gain – and with a substantial synergistic effect( Reference Mozaffarian, Hao and Rimm 28 ).
Nutrition experts have started to rethink dietary guidelines for cardiometabolic disease, with a focus on foods and dietary patterns rather than single key micro- or macronutrients( Reference Mozaffarian and Ludwig 29 ). For example, fruits, vegetables, whole grains and nuts are consistently associated with lower disease risk (and fish with reduced cardiac mortality), while processed meats, packaged and fast foods, and sugar-sweetened beverages increase cardiometabolic risk( Reference Mozaffarian and Ludwig 29 ). Overall, healthy eating patterns tend to emphasize whole or minimally processed foods and minimal sugary beverages; be lower in salt trans-fat, saturated fat, refined carbohydrates and added sugars while higher in unsaturated fats, fibre, antioxidants, minerals and phytochemicals; and be more satiating( Reference Mozaffarian and Ludwig 29 , Reference Mozaffarian, Appel and Van Horn 30 ). However, these are not the dietary patterns associated with subsidized diets. Although nutritional guidelines take the population’s needs for healthier foods into consideration, food and agricultural policies that influence the availability of these healthier foods have not yet done the same.
It is important to note that our findings do not suggest that subsidies are causing poor nutrition (due to the cross-sectional nature of the study) nor that it is the agricultural subsidies themselves that are responsible for suboptimal diet quality and resulting cardiometabolic health problems in the USA. The findings do, however, support better alignment of agricultural and nutritional policies in order to improve nutrition and reduce risk factors for cardiometabolic disease. Our analysis shows that, controlling for energy, individuals consuming a diet comprised of more subsidized foods have worse nutritional intake as compared with those individuals consuming a diet comprised of fewer subsidized foods.
Still, there are some limitations to our analysis. First, approximately 0·46 % of computed Subsidy Score values exceeded 1·0, suggesting inconsistencies and limitations across the databases used in their derivation. This could be due to overestimation of the amount of commodities in various foods in the databases used. Another reason may be that, across some commodity categories, we averaged the energy content per gram. The use of these averages may have led to overestimation of kilocalories from commodities as a percentage of total energy. For example, it was not possible to directly estimate the amount of high-fructose corn syrup in foods due to incomplete nutritional and ingredient information for foods reported in NHANES. Additionally, there are some by-products of subsidized commodities (such as soya lecithin, for example) that have not been captured by our analysis, since these by-products are not traced through the food system. However, the amount of these by-products in foods is negligible and their exclusion is unlikely to significantly affect results.
Second, we are limited in our ability to precisely estimate consumption of imported foods (~11 % of the total US food supply) which do not receive federal subsidies. However, we used category-specific estimates of the shares of imported foods, as reported by the USDA, which attenuate this limitation.
Third, a single 24 h dietary recall was used to assess diet; this may not represent the usual diet of respondents (which varies by weekdays or weekend days), and may serve to decrease between-group differences we see in Table 3. However, a single 24 h recall is appropriate to assess mean group intakes( Reference Willett 31 ) and provides greater detail on the specific types and amounts of food eaten than does an FFQ. Fourth, under-reporting of certain foods high in sugar, fat, salt or energy may occur more frequently among certain subgroups. Moreover, since processed and packaged foods are those most likely to be under-reported, the true contribution of the Subsidy Score is likely to be higher than that estimated.
Our study also has several important strengths. We used individual-level dietary assessment data that are nationally representative and, to our knowledge, the current study is the first to present a method to describe the contribution of subsidized commodities to the diet of US adults. The large sample size and detailed description of dietary intakes facilitated comparison of the proportion of energy derived from subsidized commodities among various demographic subgroups.
Our analysis may help to clarify the ongoing debate – and ecological evidence – on the role of farm policies and food consumption. To date, opinions – and ecological evidence – on the role of farm policies, food consumption and health have been mixed. Recent economic evaluations posit that agricultural policies play no role in determining consumption patterns and, in turn, health( Reference Beghin and Jensen 32 – 35 ). The main arguments against farm policies playing a role are: (i) subsidies have a mixed effect on the prices and production outputs of various food items( Reference Rickard, Okrent and Alston 33 , Reference Alston, Summer and Vosti 34 , Reference Alston, Summer and Vosti 36 ); (ii) the impacts on commodity prices offer savings to the food industry, but have little effect on food costs at retail and even less on those prices passed on to consumers( 35 ); (iii) food consumption is relatively unresponsive to changes in market prices and so the very small food price changes induced by farm subsidies could not have had large effects on food consumption patterns( Reference Alston, Summer and Vosti 34 ); and (iv) food consumption has not previously changed markedly in response to policy-induced adjustments in relative prices( Reference Beghin and Jensen 32 ).
However, ecological studies and public health commentaries suggest that farm policies do matter for health( Reference Powell and Chaloupka 12 , Reference Eyles, Ni Mhurchu and Nghiem 13 , Reference Franck, Grandi and Eisenberg 37 – Reference Glickman and Veneman 39 ). Since agricultural policy changes in the 1970s (the origin for today’s policies), food supply – the amount of energy available to the population – has increased from 9075 kJ (2169 kcal)/person per d in 1970 to 10 853 kJ (2594 kcal)/person per d in 2009( Reference Wallinga 40 ), with the largest increase seen in refined grains (782 kJ (187 kcal)) and added fats and oils (703 kJ (168 kcal)). At the same time, the USA does not produce enough healthy foods (whole grains, fruits and vegetables) to meet the nutritional needs of the population in accordance with federal recommendations( Reference Jackson, Minjares and Naumoff 41 ). Since the agricultural sector of the US economy produces roughly 80 % of the foods that Americans eat( Reference Glickman and Veneman 39 ) – for example, only 8 % of vegetables and 23 % of fruits consumed in the USA are imported( Reference Jerardo 24 ) – domestic production is important. Less than 4 % of US cropland was planted with fruits and vegetables in 2004( Reference Muller, Schoonover and Wallinga 42 ), and a report by the American Farmland Trust estimated that in order to produce enough to provide Americans with the five recommended servings of fruits and vegetables per day, approximately 52,600 more square kilometres (13 million more acres) of farmland devoted to growing these crops is needed( 43 ). One potential policy lever for addressing this may be shifting agricultural subsidies towards the production of healthier crops – such as fruits and vegetables, unrefined grains and lower-fat dairy – rather than meat, high-fat dairy, eggs and corn-sweetened products high in energy and saturated fat.
The results of our analyses underscore the importance of aligning agricultural policies with nutrition recommendations, but there remains much work to be done. Future research is needed that examines how agricultural policies, including foods derived from subsidized commodities, are associated with key markers of cardiometabolic health at the individual level, as well as how the Subsidy Score varies by levels of food security. Additionally, modelling analyses are needed to investigate how various changes to the current subsidy structures would impact consumption of various foods, and resulting nutritional status and health outcomes. Subsidies may not cause poor diets or poor health, but by tracing subsidized commodities through the US food supply and examining associations with the nutritional composition of American diets, we highlight the importance of better aligning agricultural policies with federal nutritional recommendations.
Acknowledgements
Financial support: This work was supported by the Graduate Division of Biological and Biomedical Sciences, Laney Graduate School, Emory University. The Laney Graduate School had no role in the design, analysis, or writing of this article. The findings and conclusions in this report are those of the authors and do not necessarily represent the official position of the Centers for Disease Control and Prevention. Conflict of interest: None. Authorship: K.R.S. was a PhD student at Nutrition and Health Sciences, Laney Graduate School, Emory University at the time this work was done; this paper represents her dissertation work. K.R.S., K.M.B., M.K.A., H.S.K. and G.I. formulated the research question; K.R.S., K.M.B., M.K.A., A.D.S., H.S.K., K.M.V.N. and G.I. designed the study; K.R.S. and K.M.B. carried it out; K.R.S. and K.M.B. analysed the data, with interpretative input from all authors; K.R.S. drafted the manuscript; all authors helped to revise the manuscript and approved the final version. Ethics of human subject participation: Not applicable.
Supplementary Material
To view supplementary material for this article, please visit http://dx.doi.org/10.1017/S1368980015002414


