


BMI is an indicator used internationally to classify obesity. Adults with BMI equal to or greater than 30·0 kg/m2 are considered obese, regardless of age, sex or ethnicity. Despite being used widely, mainly due to ease of calculation, this approach is inconsistent with the definition of obesity as an excess of body fat that can be harmful to health( 1 ).
Several authors have reported a positive association between BMI and fat mass percentage (%FM)( Reference Macias, Quezada and Flores 2 , Reference Gallagher, Heymsfield and Heo 3 ); however, variation in fat mass between individuals is wide and BMI does not consider it. Individuals with the same BMI value can have differences in their %FM. For example, in a sample of adult men, Smalley et al. found for a BMI value of 27·0 kg/m2 that %FM can range from 10 to 31·7( Reference Smalley, Knerr and Kendrick 4 ).
The worldwide increased prevalence of obesity in recent years( 5 ), Mexico included( Reference Barquera, Campos-Nonato and Hernández-Barrera 6 ), has resulted in high rates of diseases associated with obesity( Reference De Pergola G & Silvestris F 7 – Reference Lenz, Richter and Mühlhauser 9 ) and high costs to health services( Reference Rtveladze, Marsh and Barquera 10 ). Because of this is important to have more precise adiposity measurements.
The use of a single BMI standard for both men and women cannot be justified on the basis of weight–height relationships. In most populations, BMI is dependent on height; weight does not universally vary with the square of height; and the relationship between weight and height differs significantly between males and females( 11 ). Furthermore, the same BMI cut-off of 30·0 kg/m2 corresponds to different %FM in the diagnosis of obesity for Caucasian men and women (25 or 35 %, respectively)( Reference Okorodudu, Jumean and Montori 12 ).
Excess adiposity is the main phenotypic feature that defines human obesity and has a pathophysiological role in most chronic diseases. Although BMI and waist circumference have been widely used to define obesity and central obesity, they do not represent body fat mass and fat distribution precisely( Reference Han, Gan and Wang 13 ). BMI and waist circumference perform similarly as indicators of body fatness and are more closely related to each other than with percentage of body fat. These variables may be an inaccurate measure of body fat percentage for an individual( Reference Flegal, Shepherd and Looker 14 ). Some authors have highlighted the importance of studying fat mass. For example, Lee et al. ( Reference Lee, Keum and Hu 15 ) showed a strong positive monotonic association between predicted fat mass and all-cause mortality; they found that, compared with those in the lowest fifth of predicted fat mass, men in the highest fifth had a hazard ratio of 1·35 (95 % CI 1·26, 1·46) for mortality from all causes. Measuring the amount of fat mass is a central issue of studying obesity at the individual and population levels( Reference Heymsfield, Ebbeling and Zheng 16 ).
Although there are various methods and instruments to measure the fat component of an individual( Reference Heymsfield, Lohman and Wang 17 ), most of them are expensive and non-viable for population studies.
Prediction equations of body composition have emerged as a cheaper, simple and more viable option. However, some of them were conceived to be used for bioimpedance( Reference Macias, Alemán-Mateo and Esparza-Romero 18 , Reference Schifferli, Carrasco and Inostroza 19 ). The equations for adults that consider anthropometric measurements were mainly developed for specific populations and age groups( Reference Lee, Keum and Hu 20 – Reference Aristizabal, Estrada-Restrepo and García 27 ) (Table 1). This issue has not been addressed by a simple anthropometry-based model for Mexican adults.
Table 1 Equations for estimation of fat mass/fat-free mass using anthropometrics in adults
SEE, standard sample error; R 2, regression coefficient; M, male; F, female; FFM, fat-free mass; W, weight (kg); S, stature (cm); A, age (years); %FM, fat mass percentage; TSF, triceps skinfold (mm); BSF, biceps skinfold (mm); FM, fat mass; CSF, calf skinfold (mm); Σ3S, sum of three sex-specific skinfold sites (mm); AA, African-American; H, Hispanic; Σ4SF, sum of four skinfold sites; ASF, abdominal skinfold (mm); Mex, Mexican; B, Black; OR, Other race; WC, waist circumference (cm); AC, arm circumference (cm); CC, calf circumference (cm); TC, thigh circumference (cm); SSF, subscapular skinfold (mm); AbC, abdominal circumference (cm); %W, percentage of weight; %BF, percentage of body fat; NA, not available.
† Two equations were selected for each sex from the study of Lee et al.( Reference Lee, Keum and Hu 15 ).
The present study had two aims: (i) to develop and validate a fat-free mass (FFM) anthropometry-based equation to estimate %FM in a sample of adults; and (ii) to assess its discriminant ability for obesity compared with the %FM obtained by air-displacement plethysmography.
Methods
Participants
Two hundred and seventy-five volunteers aged 20–63 years from the Hidalgo State attended the plicometry laboratory of the Institute of Health Sciences of the Autonomous University of Hidalgo State located in Pachuca, Mexico. None of the individuals had a disease or physical condition that might affect their body volume such as oedema, dehydration, pregnancy or amputations, nor a phobia to confined places.
The inclusion criteria included a 12 h fast, no consumption of alcohol for 24 h before measurements, no strenuous exercise within 12 h before the measurements, avoidance of use of moisturizing lotions, no taking a shower within 6 h before the measurements, and women should not be in their menstrual period or lactating. Each participant completed a test with the air-displacement plethysmography unit (BOD POD®) and a set of anthropometric measurements was taken on the same day and within the same hour.
The Faculty of Medicine Ethics Committee from the National Autonomous University of Mexico approved the protocol. All participants provided written informed consent before participation.
Anthropometry
Standing height was measured with no shoes using a stadiometer (SECA, Hamburg Germany) to the nearest 0·1 cm. Body weight was measured in light clothing with no shoes using the BOD POD’s digital weight scale. Waist circumference was measured to the nearest 0·1 cm midway between the lower costal margin and the iliac crest while the participant was in a standing position and at minimal respiration; it was performed using a flexible and inelastic measuring tape (Rosscraft Innovations Incorporated, Canada). The thickness of two skinfolds (triceps and subscapular) was measured using a Harpenden skinfold calliper (British Indicators, Burgess Hill, UK) and calculated according to Durnin and Womersley( Reference Durnin and Womersley 28 ). The sagittal abdominal diameter was measured to the nearest 0·1 cm after a normal exhalation while the participant was in a supine position on a firm examination table; the measurement was taken at the umbilicus level using the Holtain–Kahn abdominal calliper (Holtain Ltd, Crymych, UK), which is a portable sliding-beam calliper. All measurements were taken on the right side of the body, with each one repeated twice, by well-trained personnel. BMI was calculated as [weight (kg)]/[height (m)]2 and was classified according to WHO standards( 1 ).
Fat mass
We used the air-displacement plethysmography (ADP) method to assess %FMADP and FFMADP. The ADP equipment was the BOD POD® (Body Composition System manufactured by Life Measurement Instruments, Concord, CA, USA). Fields et al. ( Reference Fields, Goran and McCrory 29 ) validated the BOD POD as a reliable procedure to evaluate body composition in a wide range of population types, even those difficult to measure such as the elderly, children and individuals with obesity. The BOD POD is considered a reference method and has previously been described in detail( Reference Dempster and Aitkens 30 ). Before measurement, the equipment was calibrated as recommended by the manufacturer. The participant entered the BOD POD wearing a tight-fitting swimsuit, a swim cap and without any jewellery. After the calibration procedure, the participant’s body volume was measured while the participant was seated quietly in an erect posture in the test chamber and breathing normally; the participant was also instructed to stand with his/her hands on his/her thighs and his/her feet placed on the floor of the device. Thoracic gas volume was predicted by the BOD POD and the %FM was derived by using Siri’s formula for all participants. This equation was based on the Minnesota ‘reference man’, characterized by density (d 0=1·063 g/cm3), fat (f 0=0.14), water (w 0=0.61) protein (p 0=0.19) and mineral (m 0=0.06)( Reference Siri 31 ).
Statistical analysis
The sample was divided into two random groups, which resulted in a development sample and a validation sample. Descriptive statistics were used to characterize the anthropometric and body composition variables, and are reported as means and sd. Homogeneity of variances was tested by the sd test. Differences between the two samples were tested using the χ 2 test for dichotomous variables and Student’s t test for continuous variables. Correlation between explanatory variables was calculated.
Normality of continuous variables was evaluated through the Shapiro–Wilk test and Q–Q plot. Stepwise and lasso multiple regressions were used to develop the model for estimating FFM. Eight variables were considered of interest and entered in the initial model: age, sex, body weight, height, sagittal abdominal diameter, waist circumference and the two skinfolds.
Several models were obtained from this process; the most parsimonious model with optimal regression coefficient (R 2) and lowest standard sample error (SEE) was chosen. The simplicity of the predictor variables was considered; that is, the ease of measurement considering the technique and instrument. Homoscedasticity and normal distribution of multiple regression residuals were verified. Although multicollinearity does not impact the predictive power of the model, it affects parsimony and therefore it was decided to develop a model with low multicollinearity. The variance inflation factor (VIF) was used to assess multicollinearity. Bland–Altman( Reference Bland and Altman 32 ) plots were created in the validation sample to determine levels of agreement between predicted (FFMEQ) and true FFM (FFMADP). Although this technique of validation in a sub-sample is the most used in studies whose purpose is the development of prediction equations of some body component, we also did a leave-one-out cross-validation.
For the second study objective, once validation tests were completed, we used the discriminant multivariate technique to assess the ability of the %FM estimated from the obtained FFM equation to classify obese and non-obese people. Sensitivity, specificity and predictive values of obesity were also calculated. Participants were considered obese if they had BMI≥30·0 kg/m2. The cut-off points used were those recommended by the WHO to define obesity from %FM (≥35 % for women and ≥25 % for men) and to define overweight from %FM (between 30 and 34 % for women and between 20 and 24 % for men). Finally, the %FM was calculated as [(weight – FFM)/weight] ×100, where FFM was predicted from the obtained equation in the present study. Statistical analyses were performed using the statistical software package Stata® version 13.
Results
The development sample included 140 participants (ninety-six women) aged between 20 and 63 years with BMI between 17·4 and 42·4 kg/m2. The validation sample included 135 participants (eighty-five women) aged between 20 and 63 years with BMI between 17·8 and 39·5 kg/m2. Both samples did not differ significantly on any of the anthropometric and body composition variables (Table 2).
Table 2 Anthropometry and other characteristics of the sample of Mexican adults (n 275; 181 women) aged 20–63 years with BMI between 17·4 and 42·4 kg/m2
WC, waist circumference; TSF, triceps skinfold; SSF, subscapular skinfold; SAD, sagittal abdominal diameter; FFMADP, fat-free mass as estimated from air-displacement plethysmography; FMADP, fat mass as estimated from air-displacement plethysmography; %FMADP, fat mass percentage as estimated from air-displacement plethysmography.
† Differences between the samples were tested using the χ 2 test for dichotomous variables and Student’s t test for continuous variables; no significant differences were found.
Seventy-seven per cent of women and 70 % of men were classified as obese using %FMADP; 15 and 18 % of women and men, respectively, were classified as overweight. By contrast, when the classification was done from BMI, the prevalence of obesity dropped to about 40 % in women and 32 % in men (Table 3).
Table 3 Classification of obesity according to fat mass percentage (%FM) and BMI, by sex, in the sample of Mexican adults (n 275; 181 women) aged 20–63 years with BMI between 17·4 and 42·4 kg/m2
Multiple linear regression models obtained from the development sample showed that weight, height and sex were significantly associated with FFMADP (Table 4). Models obtained using stepwise forward regression and lasso regression did not showed significant differences in the values of coefficients, R 2 and SEE.
Table 4 Models for estimation of fat-free mass using different predictive anthropometric variables in the sample of Mexican adults (n 275; 181 women) aged 20–63 years with BMI between 17·4 and 42·4 kg/m2
Coef., coefficient; SSF, subscapular skinfold; TSF, triceps skinfold; SAD, sagittal abdominal diameter; WC, waist circumference; Sex, 0 if a woman and 1 if a man; R 2, regression coefficient; SEE, standard sample error; VIF, variance inflation factor; MC, Mallow’s C p coefficient.
*P<005.
The model chosen was the one formed from simple anthropometric variables:
 $${\rm FFM}{\equals}{\minus}{\rm 46}\hskip-2pt\cdot\hskip-2pt{\rm 03}{\plus}{\rm 0}\hskip-2pt\cdot\hskip-2pt{\rm 44H}{\plus}{\rm 0}\hskip-2pt\cdot\hskip-2pt{\rm 28W}{\plus}{\rm 6}\hskip-2pt\cdot\hskip-2pt{\rm 88 }\;\left( {{\rm if \, male}} \right){\hbox{;}\,}\quad R^{2} {\rm {\equals} 0}\hskip-2pt\cdot\hskip-2pt{\rm 93\; and \;SEE}{\equals}{\rm 2}\hskip-2pt\cdot\hskip-2pt{\rm 6 \, kg}$$
where FFM=fat-free mass (kg), H=height (cm) and W=weight (kg).
In the development sample, the correlation between FFMADP (kg) and height was 0·89 (95 % CI 0·85, 0·92) and the correlation between FFMADP (kg) and weight was 0·77 (95 % CI 0·70, 0·83). Multicollinearity was noted (VIF=2·28) and explained 93 % of the total variance of FFM. Residuals had normal distribution and were homoscedastic. The model was parsimonious (Mallow’s C p coefficient=4).
Bland–Altman plots demonstrated good agreement without bias in the validation analyses. The limits of agreement were −6·0 to 6·2 kg (sd from mean of 3·1 kg), indicating an acceptable validity. From the leave-one-out cross-validation SEE=2·87 and pseudo R 2=0·91 were obtained.
Using the validation sample, FFMEQ (kg) and %FMEQ were calculated from the equation developed in the present study. A non-significant difference of 0·12 kg resulted when FFMEQ (kg) was compared with FFMADP (kg); in the same way, a non-significant difference of 0·11 % resulted when %FMEQ was compared with %FMADP (Table 5). The mean of %FMEQ for individuals with BMI≥30·0 kg/m2 was 33·4 % for men and 43·7 % for women.
Table 5 Fat-free mass (FFM) and fat mass percentage (%FM) estimated from the anthropometry-based equation and the air-displacement plethysmography (ADP) method in the validation sample (n 135) of Mexican adults aged 20–63 years with BMI between 17·4 and 42·4 kg/m2

In the whole sample, prevalence of obesity was 74·9 % based on %FMADP. The equation showed a sensitivity of 90·3 (95 % CI 86·8, 93·8) % and a specificity of 58·0 (95 % CI 52·1, 63·8) % to identify obesity defined as excess of %FM (Table 6).
Table 6 Sensitivity, specificity, positive predictive value (PPV) and negative predictive value (NPV) analysis of BMI and the anthropometry-based equation in diagnosing obesity in the sample of Mexican adults (n 275; 181 women) aged 20–63 years with BMI between 17·4 and 42·4 kg/m2
The cut-offs used to perform the validation of the %FM equation were 25% for men and 35% for women; %FM was obtained from air-displacement plethysmography as gold standard.
Furthermore, the %FM estimated had the ability to discriminate between people with obesity and people without obesity (Fig. 1). Ninety-three per cent and 65 % of people with and without obesity, respectively, were correctly classified.
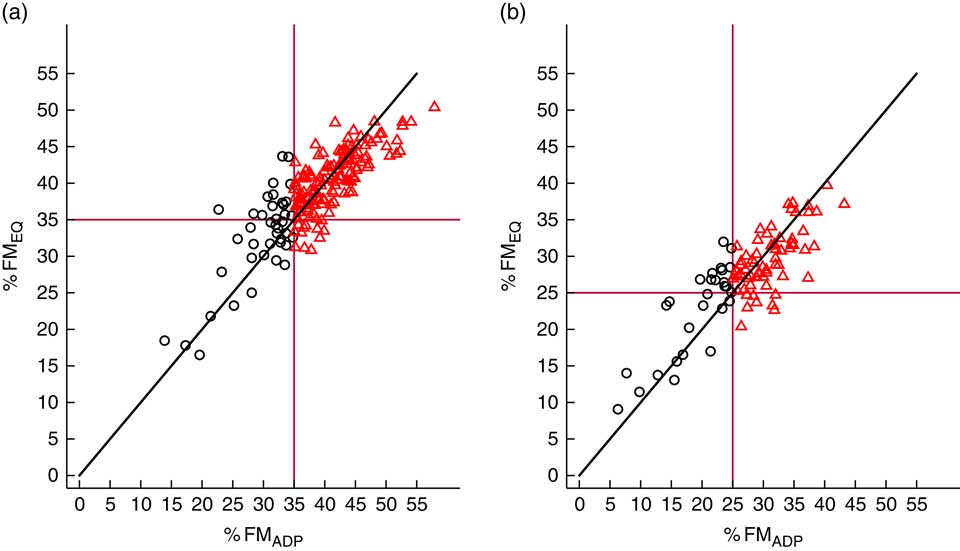
Fig. 1 (colour online) Ability of fat mass percentage to discriminate between individuals with obesity (
![]() ) and without obesity (
) and without obesity (
![]() ), by sex (a, females; b, males), in the sample of Mexican adults (n 275; 181 women) aged 20–63 years with BMI between 17·4 and 42·4 kg/m2;
), by sex (a, females; b, males), in the sample of Mexican adults (n 275; 181 women) aged 20–63 years with BMI between 17·4 and 42·4 kg/m2;
![]() correspond to the %FM cut-offs (%FMEQ, fat mass percentage as estimated from the anthropometry-based equation; %FMADP, fat mass percentage as estimated from air-displacement plethysmography)
correspond to the %FM cut-offs (%FMEQ, fat mass percentage as estimated from the anthropometry-based equation; %FMADP, fat mass percentage as estimated from air-displacement plethysmography)
Discussion
While other studies have addressed the low specificity of the international %FM cut-offs to identify metabolic disorders( Reference Macias, Quezada and Flores 2 ), to our knowledge, the present paper is the first to explore simple anthropometric variables to develop an equation to estimate %FM in a sample of adults, in order to properly classify people with obesity.
Other studies did not consider simplicity of the predictor variables as a goal, possibly because they were not interested in using their results in population studies( Reference Macias, Alemán-Mateo and Esparza-Romero 18 , Reference Schifferli, Carrasco and Inostroza 19 ) or the adult population( Reference Huerta, Esparza-Romero and Urquidez 23 , Reference Aleman-Mateo, Rush and Esparza-Romero 33 – Reference Ortiz-Hernandez, Vega-Lopez and Ramos-Ibañez 35 ) ; thus, they did not explore the ability of their equations to discriminate obesity.
Although anthropometry-based models for adult populations have been developed previously, usually they included different covariates, mainly skinfolds (Table 1). As we stated, one of the objectives of our study was to include the simplest variables with the lowest SEE and high predictive power. In 2007, Huerta et al. ( Reference Huerta, Esparza-Romero and Urquidez 23 ) developed a model for the Mexican population of older adults, but that model used different covariates and different parameter values. One of the main contributions of our model is that, in addition to sex, it contains the same variables used to calculate BMI.
Based on BMI, the prevalence of obesity in our study is higher (37·1 %) compared with that reported previously( Reference Barquera, Campos-Nonato and Hernández-Barrera 6 ) for the Mexican population (32·4 %); the participation of volunteers probably explains this difference. On the other hand, prevalence of obesity based on %FM compared with prevalence of obesity based on BMI is consistent with the results in other studies( Reference Okorodudu, Jumean and Montori 12 , Reference Frankenfield, Rowe and Cooney 36 ).
We found a high correlation of %FMADP with BMI (0·82 for women and 0·77 for men), a result similar to that reported by other authors( Reference Smalley, Knerr and Kendrick 4 , Reference Gallagher, Visser and Sepulveda 37 ). In order to choose the simplest measurements, some variables highly correlated with others easier to measure were not selected in the final equation; for example, we found a high correlation of sagittal abdominal diameter with waist circumference (0·82) and weight (0·80), results that are consistent with the literature( Reference Duarte Pimentel, Portero-McLellan and Maesta 38 ).
Some authors have found an association of age with body composition( Reference Guo, Zeller and Chumlea 39 ); however, in the present study this variable had no significant effect on the FFM estimation although the range of ages included was wide. By contrast, this result is similar to that obtained by other authors interested in predicting FFM( Reference Hsieh, Lu and Chen 40 ).
As expected, height, weight and sex were highly correlated. Although we had presence of multicollinearity, VIF scores of less than 10 suggest that it was not a significant influence on the stability of the parameter estimated( Reference O’Brien 41 ).
In our study, the average %FMADP was higher for women than for men, similarly to previous studies( Reference Macias, Quezada and Flores 2 , Reference Goh, Tain and Tong 42 ). Using data from 5100 Mexicans, Macias et al. ( Reference Macias, Quezada and Flores 2 ) found that the mean of %FM corresponding to BMI≥30·0 kg/m2 was 49·3 % for women and 35·8 % for men; our results are similar for men (33·4 %) and lower for women (43·7 %). The difference could be explained by our sample size.
A cross-validation study of the new FFM prediction equation indicated high correlation with measured FFMADP; however, a slight tendency to underestimate FFMADP was observed for both sexes. Similar tendency resulted from %FM. Other authors have found a tendency to overestimate %FM at a lower %FM and a tendency to underestimate %FM at a higher %FM( Reference Hastuti, Kagawa and Byrne 26 ).
When we compare the root-mean-square error of our study it is smaller than that obtained in other studies. Furthermore, the variance explained by the FFM prediction equation obtained in our study (R 2=0·93) was higher than that obtained by other authors, even when they used larger sample sizes. For example, the model developed for the Colombian population had two skinfolds, abdominal circumference, age and height as predictor variables (R 2=0·72). The R 2 obtained in our study can be explained by the homogeneity of our sample, since we have more than 35 % of the population with obesity. This suggests that this equation could fit populations with prevalence of obesity as high as our sample. In Mexico the prevalence of obesity is about 33 %.
The use of BMI as a measure of obesity can introduce misclassification problems that may result in important bias in estimating the effects related to obesity( Reference Rothman 43 ). BMI had a high specificity, but a poor sensitivity to detect %FM-defined obesity. Furthermore, the accuracy of BMI in diagnosing obesity is limited and it fails to discriminate between percentages of fat mass and lean mass in both sexes( Reference Romero-Corral, Somers and Sierra-Johnson 44 ). The sensitivity and specificity of BMI obtained in the present study were similar to those reported by other authors( Reference Okorodudu, Jumean and Montori 12 , Reference Romero-Corral, Somers and Sierra-Johnson 44 ).
However, one of the main reasons for continuing to use BMI and cut-off points proposed by the WHO is the comparability between populations; in that sense, the use of different indicators or cut-offs of obesity for each population could make this job harder. Another reason is the simplicity of its calculation.
Our findings also suggest that the magnitude of the obesity epidemic may be greater than that estimated by BMI. Using the gold standard definition of obesity as excess in %FM, we show that the prevalence of obesity almost doubled from 39·7 % using BMI≥30·0 kg/m2 to 77·3 % in women and from 31·9 to 70·2 % in men. Differences in the obesity prevalence from both criteria are consistent with other studies( Reference Macias, Quezada and Flores 2 , Reference Okorodudu, Jumean and Montori 12 , Reference Romero-Corral, Somers and Sierra-Johnson 44 ).
Some authors have suggested adjusting the cut-offs of BMI for obesity( Reference Goh, Tain and Tong 42 ); however, this proposal does not overcome the limitation of loss of comparability when the cut-off points depend on the population in question. Other authors have proposed to establish new international healthy body fat ranges( Reference Gallagher, Heymsfield and Heo 3 ).
Potential limitations of our study include: (i) the limited generalization of our results to populations outside our sample, for example, to populations with lower prevalence of obesity; (ii) we used the two components method as referent criterion although some authors say that it would be necessary to analyse at least three components to be a gold standard( Reference van der Ploeg, Gunn and Withers 45 ), however, BOD POD was validated as a reference method( Reference Fields, Goran and McCrory 29 , Reference Ginde, Geliebter and Rubiano 46 ); and (iii) Siri’s formula used in BOD POD was developed from a Caucasian population, ‘Minnesota reference man’. This is a controversial point, because we used Siri’s equation as a reference method to develop a model for a Mexican population.
Lee et al.’s( Reference Lee, Keum and Hu 15 ) finding suggests that the ‘obesity paradox’ controversy may be largely explained by low lean body mass, rather than low fat mass, in the lower range of BMI. In this sense, the FFM prediction equation developed in our study could help to estimate this component. This issue could not be addressed by the waist circumference measurement.
Finally, from our findings it is apparent that the diagnostic performance of the %FM obtained from the new anthropometry-based prediction equation of FFM is a valid option mainly because of the ability of the %FM estimated to discriminate between individuals with obesity and individuals without obesity.
Conclusions
%FM is an important physiological component and its estimation using a formula based on simple, direct and non-invasive anthropometric variables makes this kind of indirect method attractive to diagnose obesity.
Differences between ethnic groups are well established in the literature; however, this equation can be reliable to estimate fat mass in adults with similar physical characteristics to the participants of this study, and it can be used as a screening tool in clinical and epidemiological studies not only to estimate %FM but also to discriminate the obese condition. Nevertheless, as we stated, with a non-representative sample it is difficult to generalize the results and further investigation into the findings described here needs to be undertaken.
Acknowledgements
Acknowledgements: The authors would like to thank the participants and the personnel who performed all the procedures because they made this research possible. They also want to thank to the Institute of Health Sciences of the Autonomous University of Hidalgo State for use of the BOD POD equipment and facilities. They acknowledge the Academic Writing Team of the Centro de Estudios de Posgrado, Universidad Nacional Autónoma de México, for their help with this manuscript. Financial support: This research received no specific grant from any funding agency in the public, commercial or not-for-profit sectors. Conflict of interest: The authors declare that they have no competing interests. Transparency declaration: The lead author affirms that this manuscript is an honest, accurate and transparent account of the study being reported. The lead author affirms that no important aspects of the study have been omitted and that any discrepancies from the study as planned have been explained. Authorship: L.V.C.-P. and M.E.R.-R. participated in the planning, data acquisition, analysis, data interpretation and writing, of the study. J.V.-S. participated in the analysis, data interpretation and writing of the study. M.L.-C. participated directly in the planning, analysis, data interpretation and writing of the study. Ethics of human subject participation: This study was conducted according to the guidelines laid down in the Declaration of Helsinki and all procedures involving human subjects/patients were approved by Faculty of Medicine Ethics Committee from the National Autonomous University of Mexico. All participants provided written informed consent before participation.


