Vitamin D (25(OH)D) is a hormone associated with maintenance of skeletal integrity(Reference Holick1). Furthermore, low serum 25-hydroxyvitamin D (25(OH)D) concentrations are inversely associated with several diseases with known or putative inflammatory aetiology such as rheumatoid arthritis, the metabolic syndrome, type 2 diabetes, CVD and some types of cancer(Reference Holick2–Reference Schnatz, Jiang and Aragaki4).
Obesity has been inversely associated with 25(OH)D status in adults(Reference McGill, Stewart and Lithander5,Reference Yanoff, Parikh and Spitalnik6) McGill et al. observed that serum 25(OH)D concentration was inversely related to BMI and waist circumference (WC) in overweight and obese adults(Reference McGill, Stewart and Lithander5). In a clinical-based sample, Hispanic adults with higher BMI, WC and waist-to-hip ratio had a lower 25(OH)D status(Reference Gonzalez, Ramos-Trautmann and Diaz-Luquis7). As a steroid hormone, 25(OH)D is fat soluble, and thus deficiency of serum 25(OH)D levels associated with obesity is most likely due to the decreased bioavailability of 25(OH)D possibly related to the sequestration of 25(OH)D within the adipose tissue(Reference Wortsman, Matsuoka and Chen8).
With regard to type 2 diabetes, it has been proposed that activated vitamin D (25(OH)D) reduces the risk of type 2 diabetes by promoting insulin secretion and reducing insulin resistance (IR)(Reference Abbasi, Blasey and Feldman9). Population-based investigations have revealed that 25(OH)D is inversely associated with the homoeostatic model assessment of IR (HOMA-IR), plasma insulin and fasting blood glucose (FBG) levels(Reference Abbasi, Blasey and Feldman9–Reference Kostoglou-Athanassiou, Athanassiou and Gkountouvas12). Furthermore, the Australian Diabetes, Obesity, and Lifestyle Study showed that serum 25(OH)D3 concentrations were positively related with insulin sensitivity at the 5-year follow-up(Reference Gagnon, Lu and Magliano13). However, in the CoLaus study, the risk of IR in healthy adults was not associated with serum concentrations of 25(OH)D3 and total 25(OH)D3 in Swiss adults(Reference Marques-Vidal, Vollenweider and Guessous14).
Low serum levels of 25(OH)D have been suggested to cause mild acute phase response resulting in elevated concentrations of C-reactive protein (CRP), several hemostatic factors and different pro-inflammatory cytokines such as IL-6(Reference Canning, Grotenhuis and de Wit15–Reference Zhu, Mahon and Froicu17). Previous observational and intervention studies have suggested that supplemental 25(OH)D may reduce circulating CRP levels as well as other plasma inflammatory cytokines; however, inconsistent results are reported across completed randomised trials(Reference Gepner, Ramamurthy and Krueger18,Reference Zhang, Leung and Richers19) .
Mediation analysis is a statistical procedure that can be used to evaluate mechanisms underlying the relation between an exposure and outcome by quantifying the extent to which this relation is mediated by a third variable(Reference Baron and Kenny20–Reference MacKinnon, Fairchild and Fritz22). The traditional approach to mediation analysis tends to produce a bias when there is an uncontrolled mediator outcome confounding or an interaction between the exposure and the mediator variables. In the present study, by use of the counterfactual framework in causal mediation analysis, unbiased valid estimates of direct and indirect effects can be obtained(Reference Richiardi, Bellocco and Zugna23,Reference Robins and Greenland24) .
In general, it is unclear to what extent the association between serum 25(OH)D and cardiometabolic risk, particular inflammation and glucose and insulin metabolism, is confounded or mediated by excess adiposity. We hypothesised that lower serum 25(OH)D levels would be associated with higher concentrations of inflammatory and IR biomarkers among adults and that these associations would be in part mediated by adiposity markers.
Hence, we evaluated the association between serum 25(OH)D, glucose/insulin homoeostasis and inflammation parameters and assess the mediation effect of different adiposity indexes on the observed associations by applying on ‘causal mediation analysis’. Specifically, mediation analysis could help clarifying the role of adiposity underlying the relation between serum 25(OH)D, markers of glucose/insulin homoeostasis or inflammation(Reference Richiardi, Bellocco and Zugna23). Furthermore, the degree of mediation may vary between different adiposity indexes(Reference Wang, Rimm and Stampfer25).
Methods
Population characteristics
National Health and Nutrition Examination Survey (NHANES) is a series of ongoing repeated cross-sectional surveys conducted by the US National Center for Health Statistics(Reference Videla, Rodrigo and Orellana26). The National Center for Health Statistics Research Ethics Review Board approved the NHANES protocol and consent was obtained from all participants(Reference Videla, Rodrigo and Orellana26). The current study was based on analysis of data for two 2-year NHANES cycles: 2005–2010. Participants in the present study were aged 18 years and above. All methods were performed in accordance with the Declaration of Helsinki regarding ethical standards for research involving human subjects(Reference Videla, Rodrigo and Orellana26). NHANES uses a complex, multistage and stratified sampling design to select a sample representative of the civilian and non-institutionalised resident population of the USA. The sampling procedure consists of four stages: primary sampling units (mostly counties), segments, households and individuals, respectively. Data collection on demographic, information occurs through in-home administered questionnaires, while anthropometrical, inflammation and biochemistry data are collected by trained personnel using mobile exam centers. More detailed information is available elsewhere(Reference Videla, Rodrigo and Orellana26,27) . All methods were carried out in accordance with relevant guidelines and regulations approved by the National Centre for Health Statistics(27–Reference Mohsen Mazidi and Maciej30).
For the assessment of height and weight during the physical examination, participants were dressed in underwear, disposable paper gowns and foam slippers. A digital scale was used to measure weight to the nearest 100 g, a fixed stadiometer to measure height to the nearest millimetre. BMI was calculated as weight in kilograms divided by the square of height in metres. WC was measured at the iliac crest to the nearest millimetre, using a steel tape(27).
A blood specimen was drawn from the participant’s antecubital vein by a trained phlebotomist. Total serum 25(OH)D was measured at the National Center for Environmental Health, CDC, Atlanta, GA, USA using a Radioimmunoassay (RIA) kit (DiaSorin)(31). The sensitivity of this assay has been shown to be 1·5 ng/ml and the CV was 8 %(31). From 2007 to 2008 onwards, 25(OH)D was measured using a standardised liquid chromatography–tandem MS method(Reference Tai, Bedner and Phinney32) and in October 2015, updated 25(OH)D values for 2005–2006 were released, which had been converted from RIA to liquid chromatography–tandem MS equivalents using ordinary least squares regression(31). As recommended by NHANES(31), these liquid chromatography–tandem MS equivalents were used in the present study. The liquid chromatography–tandem MS system consisted of an autosampler (PAL-CTC Analytics), a turbomolecular pump (1100 series; Agilent Technologies) and a Triple Quadrupole mass spectrometer (PE-SCIEX API-3000, Applied Biosystems Division of MDS Health Group Ltd). Analyst software version 1.4.2 (AB SCIEX) was used for results acquisition and quantitation.
Glycated Hb (HbA1c) was measured using a Tosoh A1C 2.2 Plus Glycohemoglobin Analyzer. Fasting plasma glucose was measured by a hexokinase method using a Roche/Hitachi 911 Analyzer and Roche Modular P Chemistry Analyzer (Boehringer Mannheim Diagnostics). Other laboratory-test details are available in the NHANES Laboratory/Medical Technologists Procedures Manual(31). Insulin was measured using an ELISA immunoassay (Mercodia). Details on information on CRP concentrations measurement are available elsewhere(27). HOMA-IR and β-cell function (HOMA-B) were calculated as follows: the HOMA-IR = (glucose (nmol/l) × insulin (mU/ml)/22·5) using fasting values, and HOMA-B = (20 × fasting insulin (μU/ml))/(fasting glucose (mmol/l) − 3·5)(Reference Musso, Gambino and Bo33). The anthropometrically predicted visceral adipose tissue (apVAT) was estimated with sex-specific validated equations that included age, BMI and circumferences of the waist and thigh(Reference Samouda, Dutour and Chaumoitre34). The equation for men was 6 × WC – 4·41 × proximal thigh circumference + 1·19 × age − 213·65; and the equation for women was 2·15 × WC − 3·63 × proximal thigh + 1·46 × age + 6:22 × BMI − 92·713(Reference Samouda, Dutour and Chaumoitre34). Visceral Adiposity Index (VAI) was calculated using sex-specific formulas: men (WC/39·68 + (1·88 × BMI)) × (TAG/1·03) × (1·31/HDL); women: (WC/36·58 + (1·89 × BMI)) × (TAG/0·81) × (1·52/HDL), where both TAG and HDL-cholesterol levels are expressed in mmol/l(Reference Amato, Giordano and Galia35). Smoking status indicates whether the participant is a current smoker or not. Smoking status determined by participants ‘self-report’. Metabolic equivalent of task is used to measure the intensity level of physical activity and indicated the rate of energy consumption for a specific activity. A metabolic equivalent of task is defined as 4·18 kJ/kg per h that is roughly equal to the energy cost of being at rest. Physical activity was categorised into three intensity levels upon metabolic equivalent of task score: light, moderate and vigorous(Reference Liu36).
Statistical analysis
Data were analysed using SPSS® complex sample module version 22.0 (IBM Corp) according to the CDC guidelines for analysis of complex NHANES datasets, accounting for the masked variance and using the proposed weighting methodology(37). We used means and standard deviations for continuous measures (ANOVA) and percentages for categorical variables (χ 2). Kolmogorov–Smirnov test was used to evaluate the normality of data. We computed age, race/ethnicity, season and sex-adjusted mean of markers of IR or inflammation across the quartiles of serum 25(OH)D, using ANCOVA. All tests were two sided, and P < 0·05 was the level of statistical significance.
In the present study, we assessed the total, direct and indirect effects of serum 25(OH)D on markers of IR or inflammation with BMI, WC, apVAT and VAI as a mediator by using the counterfactual framework(Reference Fairchild and McDaniel21,Reference MacKinnon, Fairchild and Fritz22,Reference VanderWeele38–Reference Park, Zhang and Steck44) . In this approach, the total effect can be decomposed into a direct (not mediated by BMI, WC, apVAT, VAI) and indirect effects (mediated by BMI, WC, apVAT, VAI). The SPSS Macro developed by Preacher and Hayes(Reference Park, Zhang and Steck44–Reference Mazidi, Katsiki and Mikhailidis46) was used to evaluate the direct and indirect effects of serum 25(OH)D on markers of IR or inflammation with BMI, WC, apVAT and VAI as mediators. A product-of-coefficients test was used as it has the potential to detect significant mediation effects in the absence of a significant intervention(Reference VanderWeele38,Reference VanderWeele39,Reference Park, Zhang and Steck44) . Utilising single mediator models, the SPSS macro was used to calculate all regression coefficients which were adjusted for baseline values. In brief, the macro generates output that includes the following steps. Firstly, the total effect (C coefficient) of the intervention on the outcome variable (e.g. markers of IR or inflammation) is estimated by regression. The action theory test is then used to examine the effect of the serum 25(OH)D on the hypothesised mediators (α-coefficient, BMI, WC, apVAT, VAI). The conceptual theory test examines the association between changes in the hypothesised mediators and changes in dependent variables (i.e. markers of IR or inflammation; β-coefficient). The programme also estimates the direct (£’ coefficient) and indirect (α#β product of coefficients) effects. The proportion of the mediation effect was calculated using the following equation (α#β/(α#β + £)). Full or complete mediation is present when the total effect (the £’-path) is significant, the direct effect (the £’-path) is non-significant and α#β is significant, whereas partly or incomplete mediation is present when the direct effect (the £’-path) is also significant. Inconsistent mediation is present when neither total nor direct effect is significant and α#β is significant(Reference MacKinnon, Fairchild and Fritz22,Reference Lockwood, DeFrancesco and Elliot40–Reference Preacher42,Reference Park, Zhang and Steck44,Reference Mazidi, Katsiki and Mikhailidis46) . All estimates were adjusted for age, sex, race/ethnicity, level of education, smoking and level of physical activity.
Results
General characteristics
Characteristics of individuals (n 16 621) are summarised in Table 1. Overall, 8607 (48·3 %) participants were men and 9082 (51·7 %) were women. The mean age of the total population was 47·1 years. Non-Hispanic White (69·4 %) was the largest racial group and other Hispanic (4·5 %) the smallest racial group. Furthermore, 56·1 % of the participants were married, while 56·4 % had an educational level greater than high school (Table 1).
Table 1. Demographic and clinical characteristics of participants (n 16 621)
(Mean values with their standard errors; percentages)
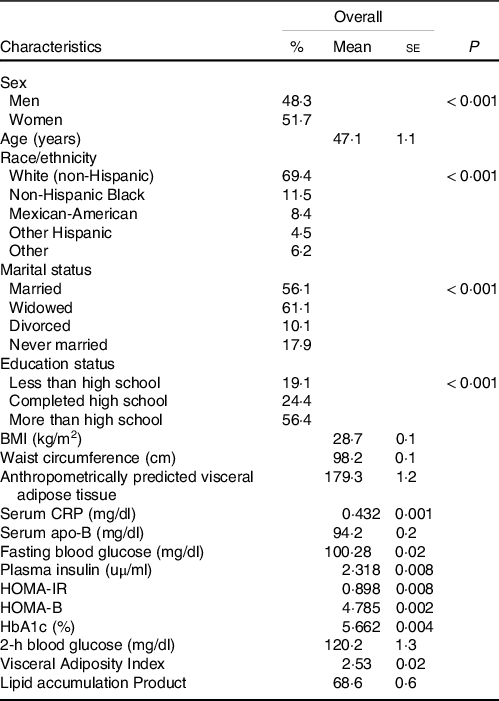
HOMA-IR, homoeostatic model assessment of insulin resistance; HOMA-B, homoeostatic model assessment of β-cell function; CRP, C-reactive protein; HbA1c, glycated Hb; apVAT, anthropometrically predicted visceral adipose tissue.
Mean BMI, WC and apVAT were 28·7 (se 0·05) kg/m2, 98·2 (se 0·1) cm and 179·2 (se 1·2), respectively. Mean 25(OH)D concentrations for the overall population were 57·9 (se 0·1) nmol/l, with minimal difference between men and women 57·5 (se 0·2) nmol/l and 58·2 (se 0·2) nmol/l, respectively. Totally, 20·2 % were current smokers including 24·8 % of men and 15·6 % of women. The participants engaging in vigorous physical activity had the lowest percentage (5·3 %) than those with little/none physical activity (24·1 %). We used ANCOVA to calculate the age, sex, season and race-adjusted mean of markers of IR and inflammation across the quartiles of serum 25(OH)D (Table 2). Levels of serum CRP, serum apo-B, FBG, plasma Insulin, HOMA-IR, HOMA-B, HbA1c (%) and 2-h blood glucose decreased with increasing concentrations of serum 25(OH)D (all P < 0·001).
Table 2. Age-, sex-, season- and race-adjusted mean levels of markers of insulin resistance and inflammation across quartiles of serum 25(OH)D
(Median and percentiles; mean values with their standard errors)
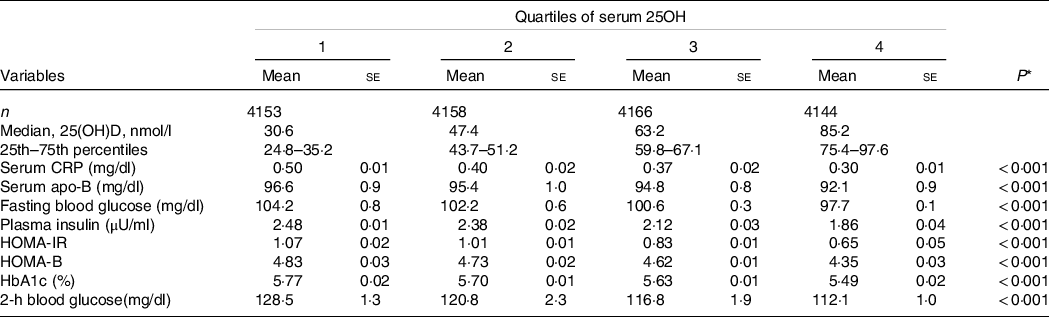
HOMA-IR, homoeostatic model assessment of insulin resistance; HOMA-B, homoeostatic model assessment of β-cell function; CRP, C-reactive protein; HbA1c, glycated Hb.
* P-values for linear trend across quartiles of hs-CRP. Variables were compared across quartiles of CRP using ANCOVA test.
Association between serum 25-hydroxyvitamin D, BMI, waist circumference, anthropometrically predicted visceral adipose tissue, Visceral Adiposity Index and markers of glucose/insulin homoeostasis and inflammation
There was a significant association between BMI, WC, apVAT and VAI with serum 25(OH)D (BMI = β: –3·10, P < 0·001, WC = β: –5·59, P < 0·001, apVAT = β: –22·14, P < 0·001, VAI = β: –0·02, P = 0·197, P < 0·001, Table 3).
Table 3. Estimates of regression coefficients (95 % CI) for the association between serum 25(OH)D, BMI, WC, apVAT, VAI (action theory) and markers of insulin resistance and inflammation (total effect) among US adults in NHANES
(95 % confidence intervals)
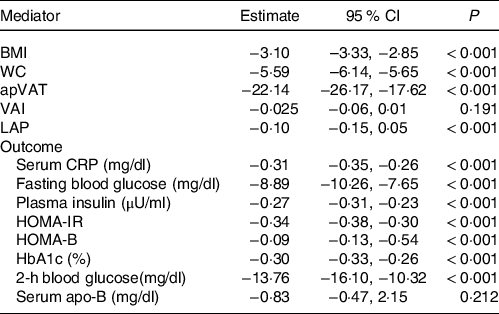
WC, waist circumference; apVAT, anthropometrically predicted visceral adipose tissue; HOMA-IR, homoeostatic model assessment of insulin resistance; HOMA-B, homoeostatic model assessment of β-cell function; HOMA-S, homoeostatic model assessment of insulin sensitivity; CRP, C-reactive protein; HbA1c, glycated Hb. All estimates were adjusted for age, sex, race/ethnicity, educational, smoking and level of physical activity. Estimates for mediator and outcomes correspond to the regression coefficients α and £, respectively (Fig. 1).
Furthermore, we examined the association between serum 25(OH) D and markers of glucose/insulin homoeostasis or inflammation in multivariate models adjusted for demographics, education, smoking and physical activity but without adjusting for the potential adiposity mediators (Table 3). The results showed that, except for serum apo (β) (P = 0·21), the other markers of glucose/insulin homoeostasis or inflammation were inversely and significantly associated with serum 25(OH)D. The 2-h blood glucose (β: −13·76) concentrations showed the strongest association with serum 25(OH)D (all P < 0·001, Table 3).
In Table 4, we tested the ‘conceptual theory’ (Fig. 1) by evaluating the multivariate-adjusted associations between adiposity mediators (BMI, WC, apVAT and VAI) and markers of glucose/insulin homoeostasis or inflammation. We found that all potential mediators had significant, positive associations with markers of glucose/insulin homoeostasis or inflammation (all P < 0·001, Table 4).
Table 4. Estimates of regression coefficients (95 % CI) for the association between BMI, WC, apVAT, VAI with markers of insulin resistance and inflammation (conceptual theory) among US adults
(95 % confidence intervals)
WC, waist circumference; apVAT, anthropometrically predicted visceral adipose tissue; HOMA-IR, homoeostatic model assessment of insulin resistance; HOMA-B, homoeostatic model assessment of β-cell function; HOMA-S, homoeostatic model assessment of insulin sensitivity; CRP, C-reactive protein. All estimates were adjusted for age, sex, race/ethnicity, educational, smoking and level of physical activity. Regression coefficient β is shown in Fig. 1.

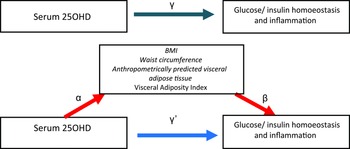
Fig. 1. Mediation model for the association between serum 25OHD with glucose/insulin homoeostasis and inflammation, with BMI, waist circumference (WC) and anthropometrically predicted visceral adipose tissue (apVAT) and Visceral Adiposity Index (VAI) as mediators. Path α represents the regression coefficient for the association of serum 25OHD with BMI, WC, apVAT and VAI. Path β represents the regression coefficient for the association of BMI, WC, apVAT and VAI with glucose/insulin homoeostasis and inflammation. The product of regression coefficients α and β represents the mediated effect (indirect effect) of BMI, WC, apVAT or VAI (α#β). Path £, represents the direct effect of serum 25OHD with glucose/insulin homoeostasis and inflammation, after adjustment for BMI, WC, apVAT or VAI. Path £ represents the simple total effect of serum 25OHD on glucose/insulin homoeostasis and inflammation, without adjustment for BMI, WC, apVAT or VAI.
Direct and indirect effects of the serum 25-hydroxyvitamin D on markers of insulin resistance and inflammation with BMI, waist circumference and anthropometrically predicted visceral adipose tissue as mediators
Table 5 shows the direct, indirect and proportion of mediation effects as well as the Sobel statistics for testing indirect effects.
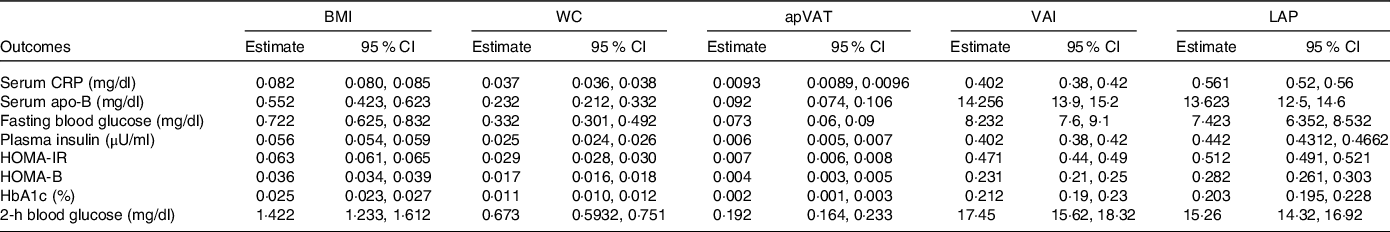
Table 5. Direct and indirect effects of serum 25OHD on markers of insulin resistance and inflammation with BMI, WC, apVAT, VAI and LAP as mediators among US adults

WC, waist circumference; apVAT, anthropometrically predicted visceral adipose tissue; HOMA-IR, homoeostatic model assessment of insulin resistance; HOMA-B, homoeostatic model assessment of β-cell function; HOMA-S, homoeostatic model assessment of insulin sensitivity; CRP, C-reactive protein. All estimates were adjusted for age, sex, race/ethnicity, educational, smoking and level of physical activity. Regression coefficients α, β and £, are shown in Fig. 1.
BMI was found to significantly mediate (to various extent) the associations between serum 25(OH)D and CRP, serum apo-B, FBG, plasma insulin, HOMA-IR, HOMA-B, HbA1c and 2-h blood glucose after full adjustment (all P < 0·001). Interestingly, WC and apVAT were also found to have mediating effects for the associations between serum 25(OH)D with the same markers of IR and inflammation including, CRP, serum apo-B, FBG, plasma insulin, HOMA-IR, HOMA-B, HbA1c and 2-h blood glucose (all P < 0·001). VAI had a different pattern of association with a significant mediating impact on CRP (P < 0·001).
Results of the direct effect estimates show that serum 25(OH)D is significantly associated with CRP, FBG, serum apo-B, plasma insulin, HOMA-IR, HbA1c and 2-h blood glucose even after adjustment for BMI or WC. apVAT showed similar trends to BMI and WC, but it did not have any direct effect on CRP. VAI was found to have a direct effect on all the glucose/insulin homoeostasis and inflammatory factors, but it showed no direct effect on serum apo-B (P = 0·40).
Discussion
Using a large, representative sample of the US population, we have applied a causal mediation analysis to investigate the associations between serum 25(OH)D with inflammatory and glucose/insulin homoeostasis markers and explored the role of different adiposity factors (central and peripheral) as potential mediators of these associations. We found that individuals with higher levels of serum 25(OH)D have a more favourable profile of inflammatory and glucose and insulin metabolic markers; moreover, adiposity factors could mediate (to a varied extent) the association between serum 25(OH)D and inflammatory and glucose/insulin metabolic parameters.
Our finding was in line with prior studies(Reference Scragg, Holdaway and Singh47–Reference Baynes, Boucher and Feskens49). The co-existence of low levels of 25(OH)D and abnormal glucose metabolism has also been reported in patients with type 2 diabetes mellitus compared with healthy controls(Reference Scragg, Holdaway and Singh47). Also, a positive association between 25(OH)D and insulin secretion has been reported in both glucose-intolerant Asian women(Reference Boucher, Mannan and Noonan48) and healthy Caucasian elderly men(Reference Baynes, Boucher and Feskens49). However, these studies were performed using an oral glucose tolerance test and findings have been supported by other studies using hyperglycaemic clamp technique(Reference Chiu, Chu and Go50,Reference Kamycheva, Jorde and Figenschau51) . A negative association between serum concentrations of 25(OH)D and future risk for hyperglycaemia and IR was found in a prospective study conducted over a 10-year follow-up period(Reference Forouhi, Luan and Cooper52). However, Orwoll et al. reported in a cross-sectional study a lack of association between serum 25(OH)D concentrations with fasting or post-challenge glucose and insulin secretion(Reference Orwoll, Riddle and Prince53). A number of randomised controlled trials also reported non-significant effects of 25(OH)D supplementation on the risk of developing diabetes(Reference Jorde, Sollid and Svartberg54) and a recent meta-analysis demonstrated that 25(OH)D supplementation was not associated with improved glucose control, β-cell secretion or insulin sensitivity in patients with type 2 diabetes (Reference Nigil Haroon, Anton and John55). Our group has recently conducted a meta-analysis of randomised controlled trials showing that 25(OH)D supplementation significantly increased serum IL-6 concentrations but had no significant effect on serum CRP, IL-10 and TNF-α (Reference Mazidi56). Possible explanations for this contrasting results include differences in study design, subject characteristics, baseline levels of serum 25(OH)D, seasonality, geographical place, study population, confounders and techniques used to assess glucose homoeostasis and β-cell function.
Several biological mechanisms have been suggested by which 25(OH)D may contribute to the development of type 2 diabetes mellitus. 25(OH)D acts on multiple pathways that regulate insulin and glucose homoeostasis including (1) insulin synthesis, (2) insulin signaling, (3) systemic and adipose inflammation and (4) adipose tissue homoeostasis. This evidence includes the presence of vitamin D receptors (VDR) and the expression of 1α-hydroxylase enzymes in the pancreatic β-cell along with the existence of a 25(OH)D response element in the human insulin gene promoter(Reference Bland, Markovic and Hills57,Reference Johnson, Grande and Roche58) . In this regard, a significant reduction in the insulin secretion in VDR mutant mice (VDR null mice) has been observed(Reference Zeitz, Weber and Soegiarto59) and the human insulin gene has been shown to be transcriptionally activated by 1,25(OH) D3(Reference Maestro, Molero and Bajo60). Pancreatic β-cells express CYP27B1 (the gene encoding the enzyme 25(OH)D3-1a-hydroxylase), giving these cells the ability to synthesise active 1,25-dihydroxyvitamin D (1,25(OH)2D) from circulating 25(OH)D, which can then act locally in a paracrine fashion within the islets to regulate target genes(Reference Bland, Markovic and Hills61). 1,25(OH)2D has also been shown to regulate insulin receptors in target cells(Reference Calle, Maestro and Garcia-Arencibia62). Thus, activated vitamin D (25(OH)D) exhibits the ability to stimulate both insulin synthesis and insulin signalling. Another possible mechanism explaining the involvement of 25(OH)D in the pathogenesis of type 2 diabetes mellitus is the role of hypovitaminosis D in enhancing IR in target tissues(Reference Kawashima and Castro63,Reference Zhou, Hou and Guo64) . The presence of the VDR in extra skeletal target sites, such as skeletal muscle, together with the upregulation of insulin receptors (INS-R) after 1,25-hydroxyvitamin D3 treatment appears to support this hypothesis(Reference Maestro, Campión and Dávila65).
We have found that there is an inverse association between serum 25(OH)D and CRP levels in analyses adjusted for demographic, education and lifestyle factors; however, previous observational studies that investigated the relationship between 25(OH)D and inflammatory markers, such as CRP, have shown mixed results. In line with our results, Amer et al. found a significant inverse association between 25(OH)D and CRP in a cross-sectional setting in a population of 15 167 adults with a mean age of 46 years from the USA(Reference Amer and Qayyum66). Ngo et al. studied 253 adults (aged 51-77 years) with mean CRP level of 3·6 (se 4·0) mg/ml and found that serum 25(OH)D was inversely associated with CRP level(Reference Ngo, Sverdlov and McNeil67). This inverse association was also seen in 147 morbidly obese participants whose CRP levels ranged from 1·88 to 4·01 mg/l(Reference Bellia, Garcovich and D’Adamo68). In contrast, no significant association was found between 25(OH)D and CRP in the Framingham Offspring Study cohort (n 1381)(Reference Shea, Booth and Massaro69) and Multi-Ethnic Study of Atherosclerosis(Reference Blondon, Cushman and Jenny70–Reference Michos, Streeten and Ryan72). This heterogeneity of findings may be due to baseline CRP level, supplemental dose of 25(OH)D, seasonal change or geographical location and intervention duration.
There are several possible mechanisms through which 25(OH)D may influence serum CRP. VDR are involved in the decreased activation of the pro-inflammatory transcription factor NF-κB(Reference Wu, Liao and Xia73,Reference Chen, Zhang and Ge74) . This suggests that VDR plays an intrinsic inhibitory role in inflammation(Reference Wu, Liao and Xia73,Reference Chen, Zhang and Ge74) . One important target of 25(OH)D is NF-κB, which is inhibited by 25(OH)D, and via NF-κβ downstream release of the pro-inflammatory cytokines. It is known that NF-κB activation participates in the endogenous induction of CRP(Reference Agrawal, Cha-Molstad and Samols75). Studies have shown the active form of vitamin D (1,25-dihydroxyvitamin D3 (1,25(OH)2D) inhibits NF-κB activation by upregulating the inhibitor of NF-κB (IκB-α) and reducing IkB-α phosphorylation in lipopolysaccharide-stimulated murine macrophage cells(Reference Cohen-Lahav, Shany and Tobvin76,Reference Song, Hong and Liu77) . 25(OH)D also inhibits synthesis of IL-6 by monocytes, which is the primary stimulant of CRP production in the liver(Reference Zhang, Leung and Richers19,Reference Dickie, Church and Coulthard78) .
We also found an inverse association between 25(OH)D levels and adiposity factors after adjustment for demographic, socioeconomic status (SES) and lifestyle factors including physical activity. This inverse association between serum 25(OH)D concentration and adiposity could be explained by the increased storage of 25(OH)D in the adipose tissue of obese participants(Reference McCarty and Thomas79). Low 25(OH)D levels are associated with increased adiposity, possibly due to enhanced uptake by adipose tissue, thus decreasing the bioavailability of vitamin D3 from cutaneous and dietary sources because of its deposition in body fat compartments(Reference Wortsman, Matsuoka and Chen8). Furthermore, evidence suggests that 1,25-hydroxyvitamin D modulates adipogenesis through 25(OH)D receptor-dependent inhibition of critical molecular components of adipogenesis, such as PPAR-γ and C/EBP (enhancer binding protein) α (Reference Wood80). Therefore, depletion of 25(OH)D stores may lead to excess differentiation of pre-adipocytes to adipocytes. However, it has been reported that serum concentrations and the expression of vitamin D dependent enzymes are not necessarily linked, especially in obese subjects(Reference Carlberg81).
The main strength of the present study was that we examined for potential mediator effects using a variety of markers of adiposity - BMI, apVAT and VAI - in the associations between serum 25(OH)D and markers of glucose/insulin metabolism and inflammation using causal mediation analyses. The analyses were conducted in a large sample size and nationally representative of population and were adjusted for key confounding variables.
Limitations of our study include the cross-sectional study design and inability to ascertain a causal and temporal relation between a serum 25(OH)D, adiposity and markers of glucose/insulin homoeostasis and inflammation. Hence, prospective studies with long-term follow-up are warranted to confirm our results. The mediated effect of WC may be affected by BMI, or vice versa, because of the high correlation between WC and BMI. This could be addressed by adding the two mediators (BMI and WC) simultaneously in the model(Reference Preacher and Hayes45). However, this was not feasible in the conventional or causal mediation models with the use of the complex survey design in the present study. To address this point, we have applied on another validated adiposity factors that are apVAT and VAI. Lastly, although BMI and WC are commonly used to estimate obesity, these indicators can be inaccurate and lead to bias in measuring adiposity. For example, BMI, an indirect measure of adiposity, is traditionally weaker than direct measures of adiposity such as DEXA, because it does not take age, sex, bone structure, fat distribution or muscle mass into consideration(Reference Rothman82). Thus, the association between serum 25(OH)D and overall adiposity can be underestimated when BMI is used as an estimate of adiposity. To overcome, we have applied for apVAT which is sensitive to age and sex and also for VAI which, given its calculations and parameters, is not only an index of adiposity but also more representative of both adiposity and lipid profile at the same time. The apVAT equation was derived using data collected in a White, European population and therefore estimates of visceral adiposity may be confounded by ethnicity. However, ethnicity was added to the models to account for the potential confounding effects on the association between vitamin D status, adiposity and markers of metabolic health.
In conclusion, greater serum 25(OH)D is associated with favourable plasma concentrations of inflammatory and glucose/insulin metabolic biomarkers. Adiposity statistically accounted for a significant proportion of the associations between serum 25(OH) D and glucose and insulin metabolism suggesting a key role of adiposity in modulating the metabolic effects of 25(OH)D. These findings support the importance of optimising 25(OH)D status in conditions with abnormal adiposity (i.e. obesity) and treatments for the prevention of cardiometabolic diseases affecting adipose tissue metabolism (i.e. weight loss).
Acknowledgements
The NHANES data are publicly available at https://wwwn.cdc.gov/Nchs/Nhanes.
This research received no specific grant from any funding agency, commercial or not-for-profit sectors.
The authors state that there is no conflict of interest.