


Minimising the measurement error in nutrient epidemiology is a vital component in determining diet–disease relationships. The accuracy of assessing nutrient intakes relies on a number of factors which include the accurate assessment of food portion sizes. However, the assessment of portion sizes is not a simple and straightforward process. Although many researchers consider weighed food diaries as the ‘gold standard’, it is not always convenient or possible to ask participants to weigh and record all food and drink items consumed. The alternative to a weighed food diary is the use of three-dimensional food models, food photographs or household measures.
The Manchester Asthma and Allergy Study (MAAS) is a population-based birth cohort studying risk factors for the development of asthma and allergic diseases in children. In that study we used a semi-quantitative FFQ to determine the relationships between dietary intake and disease. However, accurate portion sizes are required to reliably calculate nutrient intake from an FFQ. At the time of data collection no such age-specific portion sizes were available and therefore we set out to collect portion size data for our study population. Subsequently, we saw the publication by Wrieden et al.(Reference Wrieden, Longbottom and Adamson1, Reference Wrieden, Longbottom and Barton2) of typical portion sizes consumed by children of different ages (1–3 years, 4–6 years, 7–10 years, 11–14 years and 15–18 years). To our knowledge this was the first comprehensive assessment of portion sizes among children of different ages in the UK using data derived from weighed food diaries, a method requiring motivated participants to complete. These portion sizes were derived from the National Diet and Nutrition Survey (1997)(Reference Gregory, Lowe and Bates3), a survey carried out 10 years before the MAAS. There are data to suggest that some portion sizes have changed over time(Reference Nielsen and Popkin4). In addition, childhood obesity levels have risen dramatically in the UK over the last 10 years, perhaps indicating that food intake has increased in parallel(5). Therefore it is reasonable to consider if these published portion sizes are still applicable today.
The aims of the present study were: (i) to produce study-specific portion sizes for 11-year-old children using data from the MAAS; and (ii) to compare these study-specific portion sizes with recently published children's portion sizes, to assess their relevance today.
Methods
Population studied
A random sample of children from MAAS, a population-based birth cohort, was selected to participate during the study's age 11 year follow-up (April 2007–August 2008). A full description of the recruitment of the MAAS cohort has been given previously(Reference Custovic, Simpson and Murray6).
24 h Dietary recalls
Two 24 h dietary recalls (24HDR) were taken from the participants based on the multiple-pass method described by Conway et al.(Reference Conway, Ingwersen and Vinyard7). Questions were directed to the parent or carer in the presence of the child using the following procedure.
1. The participant was asked to provide a quick list (uninterrupted by the interviewer) of all foods and drinks that were consumed from waking until bedtime the day before.
2. The list of foods was repeated back to the participant for accuracy of recording.
3. Foods such as sweets, confectionery, chewing gum and snacks, which may be forgotten, were enquired about specifically.
4. The time each food and beverage was consumed and what the eating occasion was called, was enquired about specifically.
5. Then a detailed description of each food and beverage was taken, such as cooking method, type of food and quantity.
6. The recall was reviewed and the participant asked for a final time about any forgotten foods and/or beverages consumed.
7. The child was asked about any gaps in the recall (such as school meals) and the recall was repeated back to the child to ensure accuracy and that foods were not forgotten especially confectionery, school meals, drinks and after-school snacks.
The first 24HDR was conducted face-to-face while the parent and child attended a clinical follow-up for the main study; the second 24HDR was conducted by telephone within a 2-week period.
Portion size quantification
The Food Standard Agency's food portion atlas(Reference Nelson, Atkinson and Meyer8) was used to quantify intakes. Where portion data were difficult to estimate, parents were asked to identify how much of a 10 inch plate was made up of particular food, or brand names and shops where purchases were made were requested and the weight of these products taken from packaging. Recipe information was sought when meals had been cooked at home. Where food portion sizes were unavailable the equivalent food portion size was taken from the Food Standard Agency's food portion sizes book(9). For the telephone 24HDR, quantification was carried out by using (or comparing) measures supplied at the initial recall, using household measures such as number of tablespoons including ‘level’ or ‘heaped’ or amounts on the plate (e.g. quarter, third of the plate, referring to the 10 inch plate from the clinic 24HDR). Where quantification was difficult due to pre-packaged products, brand names were taken and the weight of these products taken from packaging. Recipe information was requested where necessary.
Portion size calculation
The WISP nutritional analysis program version 3·1 (Tinuviel Software, Anglesey, UK) was used to produce a food file which detailed each food and beverage item consumed. All data were extracted using Visual Basics version 6 (Microsoft Corporation, Redmond, WA, USA). An average portion size for each food type was calculated first for each individual participant and then across all individuals. This was to avoid the portion sizes being skewed by individuals who frequently consumed small or large portions. Portion sizes were calculated for all participants and then separately for boys and girls to allow for comparison. All food and beverage items consumed by at least five individuals were included. Similar foods were grouped together; this ensured that the highest number of food portion sizes was calculated, therefore avoiding food items being excluded due to fewer than five children consuming the food or beverage item. Foods similar by type and composition were grouped together (e.g. baked potato products such as croquettes, wedges and waffles were grouped together) and coded.
All statistical analysis was completed using the SPSS statistical software package version 15 (SPSS Inc., Chicago, IL, USA). The distribution for each food item was explored by examining histograms. The mean, median and interquartile range for each food was calculated. Parametric and non-parametric t tests were conducted to explore if different portion sizes needed to be produced for boys and girls.
Comparison of portion sizes
A random sample of approximately 20 % of participants was selected (n 63) and their nutrient intake from the two 24HDR was then analysed using WISP: first using the study-specific portion sizes and second using the published portion sizes produced by Wrieden et al.(Reference Wrieden, Longbottom and Adamson1, Reference Wrieden, Longbottom and Barton2) for children aged 11–14 years including estimated portion sizes using linear predicted portion weights. Pearson's correlation coefficient (r) was used to summarise the relationship between the 24HDR analysed with the study-specific and published portion sizes for each individual participant for energy and selected macro- and micronutrients. The nutrients were selected on the basis of interest to the main study which is looking at the environmental and genetic causes of asthma and allergic diseases. Further to this, the intra-class correlation coefficients (ICC) were determined to measure reliability between the two sets of portion sizes. Bland–Altman plots were used to calculate the mean bias and limits of agreement(Reference Bland and Altman10).
Results
Study population
A total of 292 participants were invited to participate in the study. Of these, 264 children completed two 24HDR and were included in the analysis; the twenty-eight who failed to complete the second 24HDR were excluded from the analysis. There were no differences in gender, age or socio-economic position between those included and excluded, but those excluded had a slightly lower BMI Z-score. Data on a random 20 % sample was analysed for nutrient intake. This sample also did not differ in gender, age, socio-economic position or BMI status from the other participants. Descriptive statistics of all participants and those included for the determination of portion sizes and nutrient intake are presented in Table 1.
Table 1 Descriptive statistics of the participants: 11-year-old children and their parents in the Manchester Asthma and Allergy Study, a UK population-based birth cohort (April 2007–August 2008)
Comparison of food portion sizes
A total of 298 foods were identified from the 24HDR and foods that were similar by type or composition were grouped together (e.g. types of beef products were combined), leaving a total of 172 items. Of these, 124 foods were eaten by at least five participants and weights of these food and drink items were obtained separately for boys and girls. Differences in portion weights between boys and girls were seen for only seven food items (differences were observed for bacon, baked beans, meat pies, Cheerios, Corn Flakes, melon and crumpets) and thus the results have not been presented separately. Table 2 presents the calculated portion sizes (mean, standard deviation, median and interquartile range) for the food and beverage items calculated from the 24HDR. Variation in portion sizes consumed was greatest for pizza, porridge and fizzy drinks (sd 115 g, 92·4 g and 91·7 g, respectively) and the smallest variation was seen for sugar added to drinks and cereals, corn snacks and brown bread (sd 3·4 g, 4·4 g and 5·4 g, respectively). The percentage differences between the two sets of portion sizes varied from 0·3 % for peaches and nectarines up to −80·0 % for croquettes, wedges and waffles. This may reflect the great variation in the intake of some foods.
Table 2 Study-specific portion sizes (g; mean, standard deviation, median and interquartile range) of 124 food and beverage items and percentage difference compared with published portion sizes
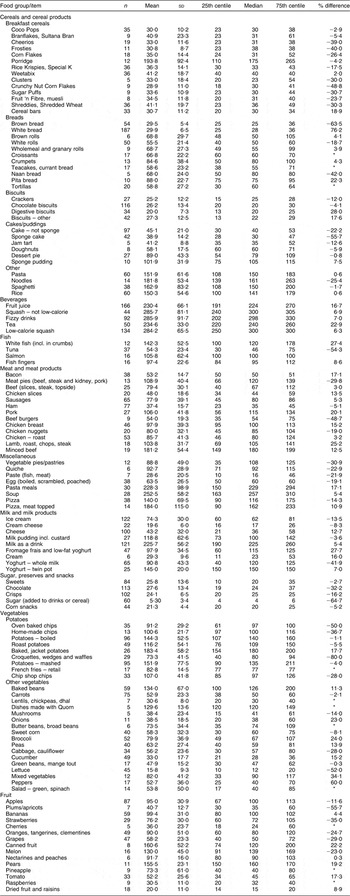
Study-specific portion sizes derived from two 24 h dietary recalls conducted among 11-year-old children (n 264) in the Manchester Asthma and Allergy Study, a UK population-based birth cohort (April 2007–August 2008); published portion sizes by Wrieden et al.(Reference Wrieden, Longbottom and Adamson1, Reference Wrieden, Longbottom and Barton2) for children aged 11–14 years.
*No comparative portion size available.
Comparison of nutrient intakes
Table 3 presents the mean intakes of selected nutrients as determined by the study-specific and published portion sizes. In general all nutrient intakes were higher using the published portion sizes except for carbohydrate and vitamin C, which were higher using the study-specific portion sizes.
Table 3 Intakes of energy and nutrients (mean and 95 % confidence interval) calculated from study-specific portion sizes and published portion sizes, and percentage difference compared with published portion sizes, in a sub-sample of the study population (n 63)
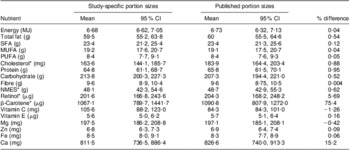
NMES, non-milk extrinsic sugars.
Study-specific portion sizes derived from two 24 h dietary recalls conducted among 11-year-old children (n 264) in the Manchester Asthma and Allergy Study, a UK population-based birth cohort (April 2007–August 2008); published portion sizes by Wrieden et al.(Reference Wrieden, Longbottom and Adamson1, Reference Wrieden, Longbottom and Barton2) for children aged 11–14 years.
*Geometric mean and range.
Comparisons were then made between the average intakes of selected nutrients for each participant using the study-specific portion sizes and the published portion sizes. There was a significant positive relationship (P < 0·001) between each nutrient as determined by the two sets of portion sizes (Table 4). The correlation coefficients ranged from r = 0·77 (protein) to r = 0·98 (β-carotene), suggesting a strong linear association between the two methods. The ICC showed good agreement between nutrient intakes determined by the study-specific and published portion sizes (P < 0·001; Table 4).
Table 4 Pearson correlation coefficients, intra-class correlation coefficients (ICC) with 95 % confidence intervals and their significance, comparing intakes of energy and selected nutrients calculated from study-specific portion sizes with those calculated from published portion sizes in a sub-sample of the study population (n 63)
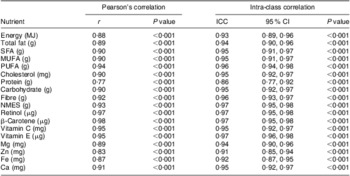
NMES, non-milk extrinsic sugars.
Study-specific portion sizes derived from two 24 h dietary recalls conducted among 11-year-old children (n 264) in the Manchester Asthma and Allergy Study, a UK population-based birth cohort (April 2007–August 2008); published portion sizes by Wrieden et al.(Reference Wrieden, Longbottom and Adamson1, Reference Wrieden, Longbottom and Barton2) for children aged 11–14 years.
In addition, to assess if the nutrient intakes produced by the two sets of portion sizes were similar, Bland–Altman plots were used. Figure 1(a) to (d) shows the Bland–Altman plot for energy, protein, fat and carbohydrate, respectively. For energy the mean difference between the two sets of portion sizes was 0·04 (95 % CI −0·16, 0·24) MJ, with a lower limit of agreement (LOA) of −1·50 (95 % CI −1·84, −1·16) MJ and an upper LOA of 1·58 (95 % CI 1·22, 1·90) MJ. For protein the mean difference was 0·95 (95 % CI 1·87, 3·78) g, with the lower LOA being −21·5 (95 % CI −26·4, −16·6) g and the upper LOA being 23·4 (95 % CI 18·5, 28·3) g. For total fat the mean difference was 0·54 (95 % CI −1·56, 2·64) g, with the lower LOA of −16·1 (95 % CI −19·7, −12·5) g and the upper LOA of 17·1 (95 % CI 13·5, 20·7) g. For carbohydrate the mean difference was 0·52 (95 % CI −5·54, 6·58) g with the lower LOA being −47·4 (95 % CI −57·9, −36·9) g and the upper LOA being 48·7 (95 % CI 38·2, 59·2) g. The Bland–Altman plots demonstrate that the mean differences are very close to zero and show no evidence of bias between the two methods.

Fig. 1 Bland–Altman plots showing agreement between intakes of energy and macronutrients calculated from study-specific portion sizes and published portion sizes in a sub-sample of the study population (n 63): (a) energy, mean difference = 0.04 MJ, limits of agreement (LOA) −1·50, 1·58 MJ; (b) protein, mean difference = 0·95 g, LOA −21·5, 23·4 g; (c) fat, mean difference = 0·54 g, LOA −16·1, 17·1 g; (d) carbohydrate, mean difference = 0·52 g, LOA −47·7, 48·7 g. Study-specific portion sizes derived from two 24 h dietary recalls conducted among 11-year-old children (n 264) in the Manchester Asthma and Allergy Study, a UK population-based birth cohort (April 2007–August 2008); published portion sizes by Wrieden et al.(Reference Wrieden, Longbottom and Adamson1, Reference Wrieden, Longbottom and Barton2) for children aged 11–14 years
Discussion
In the present study we calculated portion sizes for 124 food and drink items from two 24HDR for children taking part in a long-term cohort study. We demonstrated that our study-specific portion sizes are comparable to the published food portion sizes produced by Wrieden et al.(Reference Wrieden, Longbottom and Adamson1, Reference Wrieden, Longbottom and Barton2) in children aged 11–14 years. Mean differences in nutrient intakes calculated using the two portion sizes were very close to zero, with significantly high correlations and good reliability between the two portion sizes.
Although there have been data available regarding the typical portion sizes for adults in the UK(9) for a number of years, no such data were available for children when the current follow-up was started and therefore it was necessary to collect this information. The publication by Wrieden et al.(Reference Wrieden, Longbottom and Adamson1, Reference Wrieden, Longbottom and Barton2) provides information on typical food portion sizes for children of various ages derived from a large national survey. The availability of these data is invaluable, especially in a research setting, as estimated portion sizes are required to improve the accuracy of nutrient intake estimation. This is particularly important when using dietary assessment tools where detailed food portion size data are not collected, such as FFQ.
Although the published portion sizes that have become available were published in 2008, they are derived from data that are now almost 13 years old(Reference Wrieden, Longbottom and Adamson1, Reference Wrieden, Longbottom and Barton2). Wrieden et al. (Reference Wrieden, Longbottom and Adamson1, Reference Wrieden, Longbottom and Barton2) compared the published portion sizes with actual portion sizes recorded by weighed food diaries in fifty children aged 11–13 years(Reference Lietz, Barton and Longbottom11) and demonstrated good agreement. However, the weighed food diaries were collected approximately 10 years ago and not only is there some evidence that portion sizes are increasing(Reference Nielsen and Popkin4, Reference Young and Nestle12), but also adolescent obesity rates are reported to have doubled between 1994 and 2004, perhaps indicating that among other things diet has changed(5). Moreover, the importance of accurate dietary assessment is paramount and therefore the most up-to-date information on food composition and portion sizes is required as these cannot be considered static. Our results do, however, compare favourably with those of both Wrieden et al.(Reference Wrieden, Longbottom and Adamson1, Reference Wrieden, Longbottom and Barton2) and Lietz(Reference Young and Nestle12) despite the data being collected a decade later and also similarly show few differences between boys and girls, thus suggesting that the previously published data remains valid for this age group.
Strengths and limitations of the study
The published portion sizes were calculated from a large national dietary survey (National Diet and Nutrition Survey; 475 children aged 11–14 years) where food intake was assessed by weighed food diaries of actual food eaten (i.e. weight served minus weight of leftovers). However, motivated participants with good numeracy and literacy skills are required to complete weighed food diaries, as acknowledged by Wrieden et al.(Reference Wrieden, Longbottom and Adamson1, Reference Wrieden, Longbottom and Barton2). In our study we used two 24HDR in a relatively large population (n 264) and food portion sizes were assessed using a photographic food atlas(Reference Nelson, Atkinson and Meyer8).
There are a number of methods of assessing food portion sizes. The most obvious one is the weighing of all foods served and left over. This is often considered the ‘gold standard’ (although no method is error free); however, it can be a huge burden for the participant and may also lead to under-reporting. Other methods include use of three-dimensional food models, food photographs and household measures. The cognitive aspect of estimating portion sizes visually is complex(Reference Livingstone, Robson and Wallace13) and may be a difficult undertaking for a child(Reference Baranowski and Domel14). It requires the participant to have a good memory and the ability to think of his/her food intake abstractly in order to describe it in terms of proportions or household units(Reference Livingstone, Robson and Wallace13). In our study we used food photographs that were originally developed for use in adults(Reference Nelson, Atkinson and Darbyshire15, Reference Nelson, Atkinson and Darbyshire16) and have been demonstrated to be useful in estimating portion sizes in adult populations. A number of studies have shown that children can use food photographs to adequately describe food portion sizes(Reference Lillegaard, Overby and Andersen17, Reference Turconi, Guarcello and Berzolari18). Foster et al.(Reference Foster, Matthews and Nelson19) showed that children reporting portion sizes using adult food photographs overestimated their intake compared with using age-appropriate tools being developed by researchers. However, such tools are not yet available. In our study both parent and child were present at the time of both 24HDR in order to maximise accuracy in recalling foods and estimating intake. In addition, in the present study the second 24HDR was not carried out face-to-face but with the parent (and child present) on the telephone and thus food photographs were not used. Food quantification was undertaken by comparing to foods consumed in the previous 24HDR or alternatively using household measures. The designs of all studies are constrained by cost and asking participants to return to complete a face-face interview may increase the dropout rate as participants become less cooperative. In our study, one also has to take into consideration the burden of the main study and the need in a birth cohort to maintain long-term follow-up. Although variation between them is expected, the ICC for a selected number of nutrients between the first and second 24HDR ranged from 0·37 to 0·66, showing good agreement. This is an indication of the repeatability of the 24HDR and the ability of the method described in our study to be conducted via the telephone for participants aged 11 years and their parents.
In separate analysis, we also modelled the two 24HDR on an unknown (latent) ‘true’ diet. In this type of model structure or structural equation model it is possible to define an unmeasured variable. In our instance we considered this to be the ‘true’ dietary intake that the 24HDR are aiming to measure and therefore this technique can be used to look at the ability of an instrument to measure the ‘true’ diet. This analysis suggested a possible training effect indicating that accuracy was improved for the second 24HDR, which is a consequence of repeated self-reported measures. This provides further evidence of the ability to use the 24HDR method over the telephone and suggests it provides reasonable quantitative information following a face-to-face interview.
In our study we calculated portion size information from all participants who completed two 24HDR. We did not exclude 24HDR for under- or over-reporting. Therefore all participants who completed two 24HDR were included in an attempt to include a range of portion sizes. This is similar to the method used by Wrieden et al.(Reference Wrieden, Longbottom and Adamson1, Reference Wrieden, Longbottom and Barton2).
Portion sizes were derived for 124 food and drink types in the present study. Wrieden et al.(Reference Wrieden, Longbottom and Adamson1, Reference Wrieden, Longbottom and Barton2) gave actual portion sizes for 127 foods for this age group (consumed by more than 10 % of participants) and a further 127 estimated portion sizes for foods (consumed by 2–9 % of participants). This may be a reflection of the fact that in the published portion sizes foods were calculated from 3374 weighed food diaries, which may have captured greater variability in foods consumed. We have presented the mean, standard deviation, median and 25th and 75th centiles for the portion weights in order to show the variability of intakes, which in turn may reflect the small numbers of participants from whom the portion sizes have been derived.
The method of calculating portion sizes is similar to that presented by Wrieden et al.(Reference Wrieden, Longbottom and Adamson1, Reference Wrieden, Longbottom and Barton2) and ensures that portion sizes for foods are calculated at the individual level; therefore the results have not become skewed by children with high or low intakes due to high frequency of consumption. Furthermore, in an attempt to ensure that the highest number of food portion sizes was calculated, similar foods were grouped together and thereby avoided items being excluded due to fewer than five children consuming the food or beverage item.
Conclusions
Nutrient intakes calculated using portion sizes from our population were similar to those calculated from portion size data collected in a national survey, despite being collected over a decade later. The present study adds to the small amount of evidence regarding portion sizes in UK children and provides agreement for the previously published paediatric portion sizes. However, replication of this work is necessary and in particular more data on estimated portion sizes are required, not just for child populations but in adult populations as well.
Acknowledgements
MAAS was supported by Asthma UK Grant No. 04/014 and Moulton Charitable Trust, and is currently supported by MRC Grant No. G0601361. The authors report no conflicts of interest. S.P. carried out data collection and statistical analysis. All authors were involved in the production of the manuscript. The authors would like to acknowledge the hard work of the MAAS team and also would like to thank the MAAS families and children for their continued support and involvement.


