


A rich literature in political science explores Americans’ opposition to welfare programs. The most common explanations for such opposition deal with stereotypes about welfare recipients. One prominent body of work argues that opposition to welfare is rooted in the United States’ history of racial animus; in other words, white Americans oppose welfare because they stereotype welfare recipients as being Black (Gilens, Reference Gilens1999; Brown-Iannuzzi et al., Reference Brown-Iannuzzi, Cooley, McKee and Hyden2019). But other work argues that opposition to welfare is rooted in a universal tendency to oppose help for free-riders; in other words, Americans oppose welfare because they stereotype welfare recipients as being unwilling to work and thus undeserving of help (Petersen, Reference Petersen2012; Aarøe and Petersen, Reference Aarøe and Petersen2014). Part of the difficulty in adjudicating between these claims is the difficulty in measuring the content of individuals’ stereotypes and thus their impact on attitudes toward welfare. Since race and deservingness stereotypes are likely intertwined (Gilens, Reference Gilens1999), it is difficult to establish how much welfare attitudes are impacted by deservingness stereotypes vs. purely racial ones.
In a recent study, Myers et al. (Reference Myers, Zhirkov and Lunz Trujillo2022; henceforth MZLT) used a conjoint experiment to measure the content of stereotypes about welfare recipients. The advantage of this method is its ability to isolate and compare the relative importance of race and deservingness to stereotypes of welfare recipients. This is achieved by independently randomizing these characteristics in descriptions of hypothetical welfare recipients and then asking respondents to rate how much the person is “typical” of welfare recipients in general. MZLT then use this measure to predict support for welfare. They find that stereotyping welfare recipients as undeserving is significantly associated with opposition to welfare, whereas stereotyping welfare recipients as Black predicts such opposition weakly and inconsistently. This weak to null association between stereotyping welfare recipients as African Americans and welfare attitudes challenges work in the discipline documenting the link between perceiving welfare recipients as being Black and opposing welfare among whites.
We suggest that MZLT’s finding is an artifact of their measurement of welfare attitudes. MZLT use a common measure of welfare support (Gilens, Reference Gilens1999; Levy, Reference Levy2021), which asks about attitudes toward both welfare policies and welfare recipients. However, some of the questions indirectly implicate the deservingness of welfare recipients.Footnote 1 We hypothesize that the strong association MZLT find between stereotypes of welfare recipients as undeserving and welfare attitudes is a result of using a dependent variable that is itself partly a measure of perceptions of welfare recipients’ deservingness.
In this note, we implement a conceptual replication of the MZLT’s study using a different measure of welfare opinions that asks respondents about their spending preferences, both on welfare generally and on specific programs. We show that with this new measure stereotypes about race significantly and consistently predict welfare opinions. We also demonstrate that an intuitive interactive effect – that is, stereotyping welfare recipients as Black suppresses support for welfare only among whites harboring negative racial attitudes – is found with the spending measures but not with the attitude measure. Our findings have important implications for the debate about the roots of Americans’ opposition to welfare, as well as for the measurement of welfare opinions and best practices in survey design.
Research design
In the online survey study fielded in August 22–25, 2022, we implemented a conceptual replication of the of MZLT’s conjoint experiment (fielded in January 2021).Footnote 2 Our data collection and design exactly followed theirs. Like MZLT, we recruited a sample of non-Hispanic white U.S. adult respondents on the Lucid platform (N = 1,271).Footnote 3 Briefly, the experiment presents survey respondents with profiles that describe individuals in terms of seven attributes, including race and “deservingness,” operationalized as whether they are employed, unemployed but seeking a job, or unemployed and not seeking a job.Footnote 4 It asks respondents to rate 30 profiles total on how typical the person described in the profile is of welfare recipients using a 0–10 scale.Footnote 5 Since the value of each attribute in each profile is independently drawn, the results produce a measure of each attribute’s importance to the welfare recipient stereotype.Footnote 6
MZLT estimate the content of each individual respondent’s stereotype of welfare recipients as individual marginal component effects (IMCEs; Zhirkov, Reference Zhirkov2022), and then use these individual estimates in a regression model to predict support for welfare. IMCEs provide an individual-level analog to average marginal component effects (AMCEs), the most common estimand in conjoint experiments. While AMCEs measure the average effects of different attribute values across all individuals, IMCEs estimate the corresponding effects for each individual using all conjoint profiles rated by that individual. Potential IMCE range is linked to the conjoint rating scale; in this case, it is from −10 to 10. Substantively, IMCEs measure the direction and strength (centrality) of each attribute to the corresponding individual’s stereotypes. For instance, higher values of IMCE for the “Black” attribute value indicate that a respondent thinks that Blacks (rather than Whites, the baseline value) are more typical of welfare recipients.
The sole difference between the studies concerned the measurement of support for welfare (Table 1). In the original study, MZLT measured it using respondents’ agreement with four statements about welfare recipients and welfare policies (four-item attitude measure); they justified this choice by noting its use in other prominent studies. In a robustness check, MZLT also used a two-item version of the scale excluding items that, on their face, most directly implicate deservingness (two-item attitude measure).Footnote 7 Our survey used two different measures based on spending preferences. First, we asked respondents a general question on whether spending on welfare should be decreased or increased (one-item spending measure). Second, our survey also included four questions regarding spending on specific welfare programs: TANF (Temporary Assistance for Needy Families), Medicaid, SNAP (Supplemental Nutrition Assistance Program), and housing assistance (four-item spending measure). Since some respondents could be unfamiliar with the legal names of the programs, the questions also clarified their specific purposes. The four items were combined into an additive index.Footnote 8
Table 1. Measures of welfare opinions
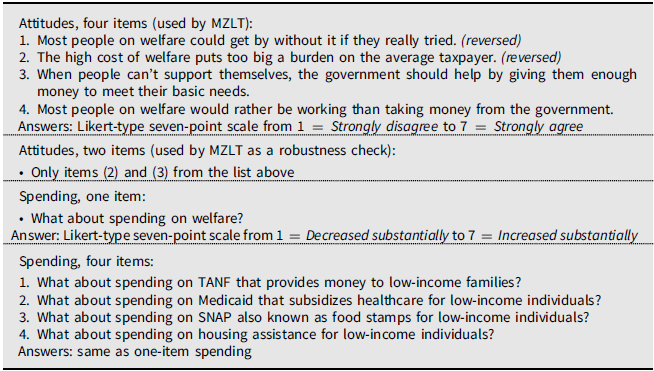
Note. Spending items included a preamble about “ways of spending tax money” (see Section A of Online Appendix for the full text).
In our regression models, we control for the same factors as those in MZLT’s original paper: individualism and racial attitudes (see Section A of Online Appendix for the survey questions), as well as respondent age, gender, income level, education level, and partisanship.
Results
We estimate four OLS regression models that predict welfare opinions using the conjoint measure of individuals’ stereotype content and control variables.Footnote 9 The general format of the regression equation is as follows:
 $${y_i} = \alpha + \sum\nolimits_{j = 1}^J {{\beta _j}} {\hat \pi _{ji}} + \sum\nolimits_{k = 1}^K {{\gamma _k}} {x_{ki}} + {\varepsilon _i}$$
where ${y_i}$
is individual’s welfare opinion,
${y_i}$
is individual’s welfare opinion, ${\hat \pi _{ji}}$
is estimated IMCE for attribute value j, and
${\hat \pi _{ji}}$
is estimated IMCE for attribute value j, and ${x_{ki}}$
is kth control variable. In the first two models, we replicate MZLT’s results with the four- and two-item attitude measures using their data. In the other two models, we estimate the same regression specification but use one- and four-item spending measures using our original data. Results are presented in Fig. 1 (for space considerations, it includes only regression coefficients for stereotypes about race and deservingness; the latter are used as a benchmark).Footnote
10
They show that when the attitude measures are used, stereotyping welfare recipients as being nonwhite does not significantly predict welfare opinions. However, models that use the spending measures find stereotyping welfare recipients as Black to significantly suppress support for welfare among non-Hispanic whites. Coefficient estimates for IMCE: Black are not reliably different across the four models (see Table A6 in Section G of Online Appendix for the test statistics and p-values), but an analyst relying solely on statistical significances would make opposite conclusions depending on what measures of support for welfare are used.
${x_{ki}}$
is kth control variable. In the first two models, we replicate MZLT’s results with the four- and two-item attitude measures using their data. In the other two models, we estimate the same regression specification but use one- and four-item spending measures using our original data. Results are presented in Fig. 1 (for space considerations, it includes only regression coefficients for stereotypes about race and deservingness; the latter are used as a benchmark).Footnote
10
They show that when the attitude measures are used, stereotyping welfare recipients as being nonwhite does not significantly predict welfare opinions. However, models that use the spending measures find stereotyping welfare recipients as Black to significantly suppress support for welfare among non-Hispanic whites. Coefficient estimates for IMCE: Black are not reliably different across the four models (see Table A6 in Section G of Online Appendix for the test statistics and p-values), but an analyst relying solely on statistical significances would make opposite conclusions depending on what measures of support for welfare are used.

Figure 1. Effects of race and deservingness stereotypes on support for welfare.
Note. Controls: other stereotype dimensions (gender, marital status, having children, immigration status, criminal record), demographics, partisanship, racial conservatism, and individualism. 95% confidence intervals shown. For full results, see Table A5 in Section G of Online Appendix.
Given the results of the replication, we implement another analysis that extends MZLT. Specifically, the effect of race stereotypes on support for welfare is likely conditional on racial attitudes: if someone thinks of welfare recipients as African Americans, it should suppress support for welfare only when that person also harbors anti-Black prejudice. To test this conjecture, we estimate interactive models using the four measures of support for welfare. Similar to MZLT, racial attitudes are measured using the FIRE scale (DeSante and Smith, Reference DeSante and Smith2020). Results presented in Fig. 2 show significant interactive effects in the expected direction – stereotyping welfare recipients as Black leads to lower support for welfare only among racially conservative whites – when the spending measures are used. The four-item attitude measure that includes items implicating deservingness, in turn, shows null effects of race stereotypes on support for welfare across all FIRE scale scores with no interactive effect.Footnote 11

Figure 2. Interactive effects of race stereotypes and racial attitudes on support for welfare.
Note. Controls: other stereotype dimensions (gender, marital status, having children, immigration status, criminal record), demographics, partisanship, and individualism. 95% confidence intervals shown. For full results, see Table A6 in Section G of Online Appendix.
Conclusion
In this note, we have implemented a conceptual replication of the study by Myers et al. (Reference Myers, Zhirkov and Lunz Trujillo2022; MZLT) that explores how white Americans’ stereotypes about welfare recipients predict policy attitudes. In our replication, we use different outcome measures that directly ask respondents about welfare spending. We demonstrate that the negative effect of stereotyping welfare recipients as Black on support for welfare is statistically significant on the conventional confidence level when the direct spending measures are used, while being insignificant when one uses a measure based on attitudes – thus leading analysts and readers to different substantive conclusions. Using the spending measures, we also find an interactive effect of race stereotypes and racial conservatism on welfare opinions, which is not present when the attitude measure is used.
These results have two important implications. First, when the spending measures of welfare attitudes are used as the outcome variable, MZLT’s conjoint measure of stereotype content supports both race- and deservingness-based explanations of Americans’ opposition to welfare. Therefore, previous research on the relationship between stereotypes about welfare recipients and welfare policy opinions that use what we refer to as the attitude measure may have underestimated the effect of race.Footnote 12 Second, questions directly asking about actions, such as spending, may be a better measure of policy opinions than questions dealing with more ambiguous attitudes, such as general positivity or negativity toward the policy itself or its beneficiaries. Among the two variants of the spending measure, the more general one-item version (spending on “welfare”) seems to exhibit somewhat better results than the four-item one (spending on specific welfare programs).
Overall, our results demonstrate how measurement choices impact judgments about statistical significance – and thus substantive interpretations of empirical results. It once again highlights both the importance of measurement choices in political research and the limitations of focusing on statistical significances of single coefficients in regression models. Notably, while our results challenge some of MZLT’s findings, our analysis with a face-valid measure of support for welfare spending provides support for their more general claim that conjoint experiments are a good measure of stereotype content.
Supplementary material
The supplementary material for this article can be found at https://doi.org/10.1017/XPS.2023.31
Data availability
The data, code, and any additional materials required to replicate all analyses in this article are available at the Journal of Experimental Political Science Dataverse within the Harvard Dataverse Network, at: https://doi.org/10.7910/DVN/6SHF3S
Funding
Data collection for this study was supported by the LAPOP Lab at Vanderbilt University.
Competing interests
The authors have no conflicts of interest to declare.
Ethics statement
This study was reviewed by the Institutional Review Board for the Social and Behavioral Sciences at the University of Virginia (protocol number 5147). This study adheres to APSA’s Principles and Guidance for Human Subjects Research. See Section H of Online Appendix for further details.


 Open access