


Dietary guidelines around the world recommend that fruit and vegetables form a large part of a healthy diet( 1 – 3 ). In Australia, less than 50 % of adults consume the recommended two servings of fruit and less than 10 % consume the recommended five servings of vegetables each day( 4 ). Increasing consumption of fruit and vegetables has been a public health priority for more than 20 years in Australia( 5 ). Some processed food products carry claims on their labels highlighting the number of servings of fruit or vegetables that they contribute to daily intake; however, the prevalence of these claims in Australian supermarkets has not been previously studied.
Claims on food packages are marketing tools that food manufacturers use to inform consumers of certain content of food substances, health benefits or other nutritional characteristics of the products( 6 ). Claims on food packages are regulated under the Australia and New Zealand Food Standards Code (hereafter referred to as ‘the Code’)( 7 ). The regulatory body responsible for food labelling standards is Food Standards Australia New Zealand (FSANZ).
Fruit and vegetable claims are those stating the presence of fruit or vegetables (e.g. ‘made with real fruit’), the fruit or vegetable content (e.g. ‘80 % real fruit’) and/or the number of servings of fruit or vegetables they contain (e.g. ‘one cup contains three serves of vegetables’). These products can be marketed as convenient substitutes for fruits and vegetables. Claims on food products can create a ‘health halo’, meaning that consumers perceive products carrying claims to be healthier than those that do not carry claims( Reference Kozup, Creyer and Burton 8 ).
Health claims state, suggest or imply a relationship between a food or a constituent of that food and health; for example, ‘contains calcium for strong bones’( 7 ). In Australia, products can only carry health claims if they contain minimum levels of the claimed nutrient and there is substantial evidence of the nutrient–health relationship( 9 ). Additionally, products carrying health claims must meet minimum nutrient criteria defined by FSANZ nutrient profiling. The Nutrient Profiling Scoring Criterion (NPSC) is a system that assesses the overall healthiness of a product based on the contents of energy, saturated fat, sugars and sodium, as well as the amounts of fruit, vegetables, nuts, legumes, dietary fibre and protein( 10 ), and is based on the UK Food Standards Agency nutrient profiling system( Reference Rayner, Scarborough and Lobstein 11 ).
Nutrition content claims are claims that describe the presence of a nutrient in a food, such as ‘high in calcium’( 12 ). Under the Code, products carrying nutrition content claims must also meet minimum levels of the claimed nutrient before these claims can be made( 12 ). Under the Code, nutrition content claims are not required to meet nutrient profiling( 12 ). Currently, most nutrition content claims can be made on food packages regardless of the product’s nutrient profile, as long as the food meets the qualifying criteria for the claimed nutrient( 12 ). This means that nutrition content claims can and do appear on unhealthy products that do not meet nutrient profiling criteria( Reference Hughes, Wellard and Lin 13 ). For instance, confectionery products can carry the claim ‘99 % fat free’, despite being high in sugar. Consumers with poorer nutrition knowledge may perceive products carrying nutrition content claims to be healthier based on these claims( Reference Williams 14 , Reference Ni Mhurchu and Gorton 15 ).
Fruit and vegetable claims are currently not regulated under the Code as they refer to claims about ingredients rather than specific nutrients. While a recent study has investigated the healthiness of products carrying nutrition content claims( Reference Hughes, Wellard and Lin 13 ), to the authors’ knowledge there has been no research conducted on the nutrient profile of products carrying fruit and vegetable claims or the extent that these claims are being made in Australia or elsewhere.
The present study aimed to fill this research gap by describing the prevalence of food products carrying these claims in major Australian supermarket chains, assessing their healthiness according to nutrient profiling and comparing the nutrition composition of those products with that of fresh fruit and vegetables in terms of energy, total sugars, saturated fat, sodium and fibre contents.
Methods
Initial product scanning during study scoping showed that four food categories carried many fruit and vegetable claims and therefore were included in this study. These categories were: (i) fruit snacks, including bars, straps and leathers; (ii) soups, including ready-to-eat and dry mixes; (iii) fruit and/or vegetable juices, including fresh and shelf-stable; and (iv) fruit and/or vegetable nectars, including fresh and shelf-stable, herein referred to as ‘fruit and/or vegetable drinks’ as this is the terminology used in the Code( 16 ). Definitions of the products included in these categories were derived from Codex Alimentarius( 17 ) to ensure all relevant products were included. A content analysis of all the fruit and vegetable claims present on the product labels in the four categories was conducted in April 2013. The study was conducted in the five largest Australian supermarket chains( 18 ) in Sydney, the capital city of Australia’s most populous state. Data were collected by photographing all available product packages to obtain the largest possible sample size. All pack sizes and flavour variants were included; however, products present in multiple stores were surveyed once only.
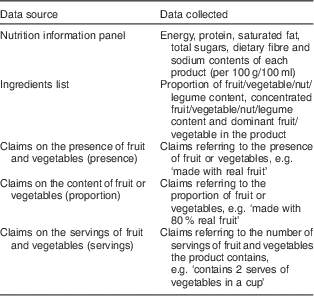
All claims appearing on food packages were recorded verbatim. The claims found could be grouped into three categories: (i) claims on the presence of fruit and vegetables (presence claims); (ii) claims on the quantified fruit and vegetable content (proportion claims); and (iii) claims on the servings of fruit and vegetables the product contains (servings claims). Additionally, data from the nutrition information panel and the ingredients list were collected to allow nutrient profiling, as shown in Table 1. As food manufacturers are not required to list dietary fibre on the nutrition information panel in Australia, missing data on dietary fibre content were collected by contacting manufacturers. When the manufacturers could not provide the information, the content was estimated from a comparable product (n 36). To avoid underestimating the fibre content, the highest fibre contents within the estimated range were assumed.
Table 1 Data collected from food packages
The web-based FSANZ Nutrient Profiling Calculator( 10 ) was used to assess the healthiness of the products surveyed. For every product, the energy (kJ), saturated fat (g), total sugars (g), sodium (mg), protein (g), dietary fibre (g) and fruit, vegetable, nuts and legume content were entered into the calculator and a score was generated. Products that did not meet the criteria were deemed less healthy as they would be ineligible to carry health claims under the Code( 10 , 12 ).
Reliability
All data were cross-checked by two different researchers to ensure the reliability of the results.
Data analysis
Data were entered into a Microsoft® Excel spreadsheet and the statistical software package SPSS version 15 for Windows. P values of ≤0·05 were considered statistically significant. Data were analysed to determine the proportion of products carrying fruit and vegetable claims and the proportion of products that met nutrient profiling.
Fisher’s exact tests were conducted to determine whether discretionary or non-discretionary products were more likely to carry claims and whether products carrying claims or those without claims were more likely to meet nutrient profiling.
Differences in median fruit and vegetable contents between products carrying claims and those without were determined using a Mann–Whitney U test. This test was chosen as the data were not normally distributed.
For products carrying claims referencing the number of servings of fruit and vegetables, for example, ‘a 250 ml glass is equal to one serve of fruit’, the nutrient composition of each product was compared with the nutrient composition of the equivalent servings of fresh fruit and vegetables. For example, if a claim stated that a serving of the product provided one serving of fruit, each serving would be compared with a serving of the dominant fruit. On Australian food labels, ingredients must be listed in descending order by weight( 19 ). The dominant fruit and/or vegetable in the product was obtained from the ingredients list and used as the comparison, to ensure consistency of results. As most vegetable juices were a mixture of fruit and vegetable juices, the dominant vegetable component and the dominant fruit component were included. For each product, the dominant fruit and/or vegetable was present at a level of at least 5 % more than the second fruit or vegetable in the ingredients list. Comparisons between fresh fruit and/or vegetables and the products surveyed were made in terms of energy, total sugars, sodium, saturated fat and fibre contents. Nutrition composition of fresh fruit and vegetables was obtained from the two government food and nutrient databases in Australia: AUSNUT 2007 and NUTTAB 2010( 20 , 21 ). Serving sizes for fruit and vegetables were analysed based on the standard serving sizes (75 g and 150 g, respectively) in the Australian Dietary Guidelines( 1 ).
To determine differences in energy, saturated fat, sugar, sodium and fibre contents between products and their equivalent fruit and vegetable serving, Mann–Whitney U tests were conducted for each food category. Non-parametric tests were chosen as the data were not normally distributed.
Results
Sample size and total number of claims
Overall, 762 products were surveyed across the four categories. This included sixty-three fruit snacks (8 %), 273 soups (36 %), 303 fruit and/or vegetable juices (40 %) and 123 fruit and/or vegetable drinks (16 %). Of these, 366 (48 %) carried at least one claim. The proportion of products carrying claims varied between categories, from 30 % (n 81) of soups to 87 % (n 55) of fruit snacks, as shown in Table 2. Discretionary products (n 186) were more likely to carry claims (78 %) than non-discretionary products (39 %, P<0·001).
Table 2 Number and proportion of products carrying at least one fruit and vegetable claim, by food category; content analysis of all fruit and vegetable claims present on product labels in four food categories in the five largest Australian supermarket chains in Sydney, Australia, April 2013
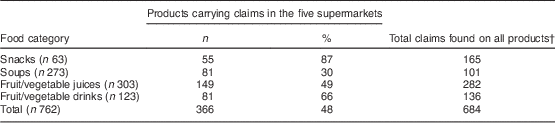
† Note: some products carried more than one claim.
Healthiness of foods carrying claims
Among the products carrying claims, 34 % (n 124) did not meet the NPSC. This included forty-three fruit snacks (78 % of fruit snacks carrying claims), eight soups (10 % of soups carrying claims), one fruit and/or vegetable juice (1 % of juices carrying claims) and seventy-four fruit and/or vegetable drinks (82 % of drinks carrying claims). A larger proportion of products carrying fruit and vegetable proportion claims did not meet the NPSC (52 %, n 101) compared with presence and servings claims. The proportion of each type of claim in each category that did not meet NPSC is shown in Table 3.
Table 3 Number of products carrying fruit and vegetable claims in each food category and the number and proportion of products carrying claims that did not meet nutrient profiling; content analysis of all fruit and vegetable claims present on product labels in four food categories in the five largest Australian supermarket chains in Sydney, Australia, April 2013
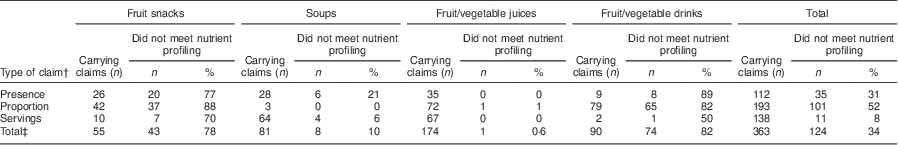
† Presence=claims referring to the presence of fruit and vegetables; proportion=claims referring to the content of fruit or vegetables; servings=claims referring to the number of servings of fruit and vegetables the product contains.
‡ Some products carried more than one type of claim, therefore total is not an addition of each claim type.
Differences in fruit and vegetable content between products carrying claims and those without
There were differences in the median fruit and vegetable content of products carrying claims and those without in the snack and soup categories, as shown in Table 4. Snacks (U=274, z=2·7, P=0·008) and soups (U=9395, z=5·8, P<0·001) carrying claims had higher median fruit and vegetable contents than those without claims.
Table 4 Median and range of fruit and vegetable contents by food category; content analysis of all fruit and vegetable claims present on product labels in four food categories in the five largest Australian supermarket chains in Sydney, Australia, April 2013
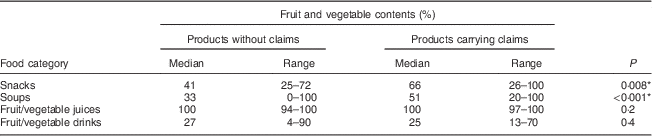
* Denotes significant results, P≤0·05.
Comparison between products carrying servings claims and fresh fruit and vegetables
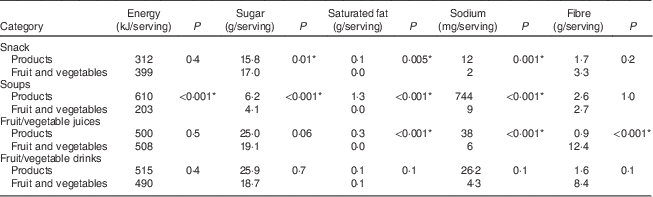
Fruit and/or vegetable juices that carried claims on the servings of fruit and vegetables were significantly higher in saturated fat (U=937, z=−6·8, P<0·001) and sodium (U=350, z=−8·4, P<0·001), and lower in fibre (U=4218, z=8·8, P<0·001), than the equivalent fruit and vegetable servings. Although the median energy, saturated fat, sugar and sodium contents of fruit and/or vegetable drinks were higher and the fibre content was lower than the equivalent fruit and vegetable servings, no statistical differences were shown (P=0·4 for energy; P=0·7 for saturated fat; P=0·1 each for sugar, sodium and fibre) due to the small sample size of products with servings claims (n 4). Soups that carried these claims were significantly higher in energy (U=360, z=−8·0, P<0·001), saturated fat (U=315, z=−8·7, P<0·001), sugar (U=1279, z=−3·7, P<0·001) and sodium (U=25, z=−9·6, P<0·001) than the equivalent fruit and vegetable servings; however, there was no difference in fibre content (P=1·0). Fruit snacks that carried the claims were significantly higher in saturated fat (U=20, z=−2·8, P=0·05) and sodium (U=5, z=−3·5, P=0·001) and significantly lower in sugar (U=94, z=3·4, P=0·01). There were no differences in energy (P=0·4) or fibre (P=0·2) content between fruit snacks that carried claims and the equivalent fruit and vegetable servings. The median nutrient composition of products carrying claims on the servings of fruit and vegetables can be seen in Table 5.
Table 5 Median nutrient composition of products carrying claims on the servings of fruit and/or vegetables and fresh fruit and vegetables; content analysis of all fruit and vegetable claims present on product labels in four food categories in the five largest Australian supermarket chains in Sydney, Australia, April 2013
*Denotes significant results, P≤0·05.
Discussion
Our results found that just over one-third of fruit and/or vegetable juices and drinks, fruit snacks and soups carrying fruit and vegetable claims did not meet NPSC. These products would not be eligible to carry health claims under Australian food standards and could be considered less healthy. However, as fruit and vegetable claims are not currently regulated under the Code, they can continue to appear on food packages regardless of their nutrient profile. This means that products can carry claims about fruit and vegetables, despite being less healthy and over-emphasising their nutritional benefit as a source of fruit and/or vegetables.
Previous Australian research has been conducted to investigate the extent of food products carrying health or nutrition claims in certain food categories( Reference Hughes, Wellard and Lin 13 , Reference Williams, Yeatman and Ridges 22 , Reference Williams, Yeatman and Zakrzewski 23 ). Nutrition content claims on unhealthy foods are concerning due to their potential to mislead consumers to perceive the product is healthy( Reference Gorton, Ni Mhurchu and Chen 24 ) and the presence of nutrition content claims increases the likelihood that consumers will purchase a product( Reference Roe, Levy and Derby 25 ). Similarly, the presence of ingredient claims, such as fruit and vegetable claims, on unhealthy products is likely to mislead consumers about the healthiness of the products.
Products classified as ‘discretionary choices’ are not essential or necessary in the diet and may be high in energy, saturated fat, sugars and/or salt( 1 ). For most people, these are foods best limited or avoided( 1 ). Two of the categories included in the present study (fruit snacks and fruit and/or vegetable drinks) are classified as discretionary choices. These two categories had higher proportions of products carrying claims and were less likely to meet nutrient profiling. In these categories, the use of fruit and vegetable claims on unhealthy foods can potentially mislead consumers to perceive they are healthy. Marketing products with claims referencing the presence or number of servings of fruit and vegetable may increase consumers’ purchase of these products( Reference Kozup, Creyer and Burton 8 ) and the present study justifies the expansion of the definition of nutrition content claims to include ingredients such as fruit and vegetable contents.
Recently an industry-defined Code of Practice for Whole Grain Ingredient Content Claims was introduced to provide consistent messages on the grain content of foods. This Code of Practice defines the minimum wholegrain content required for products to carry these claims and sets out some nutrition quality requirements for the use of ‘high in whole grain’ and ‘very high in whole grain’ claims( 26 ). Although the effectiveness of the whole grain ingredient Code of Practice is unknown, its development highlights the need for consistent regulation of ingredient claims.
With the exception of fruit and vegetable juices, the products surveyed in the present study had relatively low median fruit and vegetable contents, making them poor substitutes for fruit and vegetables. Consumers who expect to achieve some or all of their two servings of fruit and five servings of vegetables through these products may consume much less dietary fibre and much more energy, saturated fat, sugar and sodium than if they were consuming fresh fruit and vegetables. Excess consumption of these nutrients is linked to other health concerns such as weight gain and hypertension( Reference Te Morenga, Mallard and Mann 27 , 28 ). Further, processed fruit and vegetable products may not have the combination of antioxidants and other nutrients present in fresh fruit and vegetables that protect against chronic diseases( Reference Liu 29 ). Therefore marketing claims that imply or suggest that nutritionally poorer products are equivalent to fresh fruit and vegetables are inaccurate and potentially misleading to consumers. Further research is required to identify how often consumers eat these products and in what quantities, whether they use these products as substitutes to fruit and vegetables based on the claims and whether consumers are misled by these claims.
Extending the application of nutrient profiling to products carrying nutrition content claims would enhance consumers’ ability to make healthy choices by eliminating the use of these claims on unhealthy foods that could potentially mislead them about the overall healthiness of the food. In Europe, nutrient profiling will be applied to assess both nutrition content and health claims( Reference Asp and Bryngelsson 30 , Reference Buttriss and Benelam 31 ). It has been suggested that nutrient profiling should be implemented to assess the eligibility for products to carry nutrition content claims in Australia( Reference Hughes, Wellard and Lin 13 ). As neither European nor Australian food standards regulate fruit and vegetable claims, the present study shows that food labelling legislation should be extended to these types of claims, especially as the population has been recommended to eat more fruit and vegetables( 1 ).
There were some limitations of the present study. Not all product categories that carry fruit and vegetable claims were surveyed; however, initial scoping was conducted to ensure the food categories selected were the categories where a large number of products carried fruit and vegetable claims. Products carrying servings claims were compared only with the dominant fruit and vegetable ingredients. As different fruit and vegetables have varying nutrient compositions, the calculations provide only estimations. Only a limited range of nutrients were compared. Including other nutrients would allow a more complete comparison of the nutrient composition; however, as food manufacturers are not required to list these on the nutrition information panel unless a claim is made regarding specific vitamins and/or minerals( 32 ), it is not possible to determine the complete nutrition content without a laboratory analysis.
The present study assessed the extent that supermarket products were carrying fruit and vegetable claims after the new Australian health claims standard was implemented early in 2013. Due to a lack of published research, it is unknown whether other countries have a similar prevalence of fruit and vegetable claims on food labels. Therefore more research is required to determine if the research is generalisable to other countries. To the authors’ knowledge, fruit and vegetable claims have not been the subject of previous research and therefore the present study fills a gap in the literature.
Conclusion
Overall, the products surveyed were poor substitutes for fresh fruit and vegetables as many were high in sugar, saturated fat and/or sodium and low in dietary fibre. Should these products be consumed as substitutes to fresh fruit and vegetables, they could reduce the nutritional quality of the diet overall. In this respect, fruit and vegetable claims on less healthy foods have the potential to mislead consumers and therefore should be defined and regulated under the Code. Products carrying fruit and vegetable claims should be subject to nutrient profiling to determine their eligibility to carry these claims. By implementing this recommendation, the government can ensure that food labelling provides consumers with consistent and accurate information to allow them to make informed choices and that they are not misled by claims on unhealthy food products.
Acknowledgements
Acknowledgements: Initial food composition data were extracted with permission from The George Institute for Global Health’s Food Composition Database. Financial support: This study was funded by Cancer Council NSW. Conflict of interest: None. Author contributions: L.W. conceived the study, supervised the data collection, checked the data, conducted the final analyses and prepared the manuscript. C.H. conceived the study, supervised the data collection and contributed substantially to the manuscript. Y.W.T. conducted data collection, checked the data, conducted and interpreted the preliminary analyses and contributed substantially to the manuscript. W.W. supervised the data collection and contributed substantially to the manuscript. K.C. contributed substantially to the manuscript. Ethical approval: As this study was an observational study with no human subjects, no ethical approval was necessary.


