


Economic improvement and reduction in poverty, both in developed and developing countries, have been observed within the last couple of decades; however, the pace is not sufficient to meet Millennium Development Goal 1 (‘eradicate extreme poverty and hunger’)( 1 ). Improvement has also occurred in meeting basic health needs such as the prevention and treatment of infectious and communicable diseases( Reference Bhutta, Ahmed and Black 2 ), and efforts have been made to ensure provision of safe drinking-water and improved sanitation practices to reduce diarrhoeal episodes( Reference Bhutta, Ahmed and Black 2 , Reference Brown 3 ). According to WHO, globally about 27 % of children are stunted( Reference De Onis, Blossner and Borghi 4 ) and 17 % are underweight( Reference De Onis, Blossner and Borghi 5 ). The scenario is even worse in the Asian subcontinent and sub-Saharan Africa( Reference Bhutta, Ahmed and Black 2 ). Despite efforts to reduce childhood malnutrition through various interventions, it remains a great public health challenge( Reference Bhutta, Ahmed and Black 2 ).
The other components of malnutrition, such as overweight and obesity, are emerging public health concerns( Reference De Onis, Blossner and Borghi 6 , Reference Wang and Lim 7 ). In 2011, WHO reported that over 40 million children under the age of 5 years (under-5s) were overweight globally, of whom 75 % were from developing countries( 8 ). Childhood obesity is associated with premature deaths, adulthood disabilities, future respiratory problems, fractures, hypertension, CVD, insulin resistance and psychological disharmony( 8 ).
According to the Bangladesh Health and Demographic Survey (BDHS) 2000, the prevalence of underweight, stunting and wasting among under-5s was 48 %, 45 % and 10 %, respectively( 9 ), which decreased to 41 %, 43 % and 17 %, respectively, in 2007( 10 ). However, 39 %, 43 % and 14 % of rural children were still underweight, stunted and wasted, compared with 28 %, 36 % and 16 % of children in urban areas, respectively, as reported by the BDHS 2011 survey( 11 ). These surveys neither reported childhood obesity nor clearly documented the shifting of childhood malnutrition over time. The International Centre for Diarrhoeal Disease Research, Bangladesh (icddr,b) has two diarrhoeal disease treatment facilities: one in urban Dhaka (Dhaka Hospital) and the other in rural Matlab (Matlab Hospital). These are the largest diarrhoeal disease hospitals in Bangladesh that provide care and treatment to about 140 000 and 20 000 patients, respectively, each year( Reference Das, Chisti and Huq 12 ). icddr,b established a Diarrhoeal Disease Surveillance System (DDSS) at the Dhaka Hospital in 1979, and at the Matlab Hospital in 2000, which systematically collects information such as age, sex and sociodemographic status, and clinical characteristics and aetiology of diarrhoea, among presenting patients. While attending children may be representative of children admitted for care anywhere in Bangladesh because there is lack of population diversity and they have almost similar geographical patterns, they are not a random sample from any child population but children who were admitted for care and thus suffered from some illnesses.
Both of these hospitals receive large numbers of diarrheal children, of whom significant numbers (>25 %) are malnourished( Reference Nahar, Hamadani and Ahmed 13 ); Dhaka Hospital has a Nutrition Rehabilitation Unit in which severely malnourished children receive protocol-based management and treatment after the acute-phase management that includes appropriate feeding of low-cost culturally acceptable foods and treatment for co-morbidities( Reference Nahar, Hamadani and Ahmed 13 ). The problem of overweight and obesity among under-5 children has not been systematically studied or reported from these hospitals; however, DDSS has the needed information on nutritional status of these children that allows analysis of trends over the decades. This paved the way to observe trends in nutritional status among children under 5 years of age in both urban and rural areas of Bangladesh.
Materials and methods
Study sites, period and data
The two diarrhoeal disease hospitals of icddr,b are: (i) Dhaka Hospital in urban Dhaka; and (ii) Matlab Hospital in rural Matlab. For the present analysis, we extracted relevant information for all under-5 children from the electronic database of the DDSS. The study period for Dhaka and Matlab (the DDSS in Matlab was established in 2000) hospitals was 1993 to 2012 and 2000 to 2012, respectively. Under-5 children were enrolled in the DDSS irrespective of their age, sex, socio-economic status (SES) and severity of disease in both hospitals.
Diarrhoeal Disease Surveillance System
The DDSS of icddr,b in Dhaka systematically sampled 4 % of all patients from 1979 through 1995, and since 1996 samples 2 % of the patients. The adjusted sample size was based on an increased number of patients (more than double) assuming no major changes in the prevalence of different aetiologies of diarrhoea, which enabled the system to invest money for the detection of additional pathogens of interest. In Matlab, all patients with diarrhoea who resided in the Health and Demographic Surveillance System (HDSS) area and attended Matlab Hospital were enrolled since 2000. The DDSS collects information on the patients’ clinical, epidemiological and demographic characteristics and use of drug and fluid therapy at home by administering a structured questionnaire with the assistance of trained research assistants.
Ethics
At the time of enrolment, verbal consent was taken from the parents or the attending caregivers of each child. icddr,b’s DDSS is a routine ongoing activity of the Dhaka Hospital and Matlab Hospital, which has the approval of the institutional Research Review Committee and Ethical Review Committee based on ‘no more than minimal risk’ to the participants, the voluntary participation and the maintenance of the rights, privacy and confidentiality of the participants.
Assessment of nutritional status
Anthropometric measurements of the children (weight and length/height) were recorded. Weight was measured to the nearest 100 g using a digital scale and length/height was measured using a locally constructed length board with a precision of 0·1 cm. All anthropometric measurements were performed by trained and experienced research assistants following standard procedures( Reference Onyango and De Onis 14 ). All measurements were subsequently compared with the WHO 2006 growth standards and nutritional status was assessed by Z-scores.
Definitions
The definitions of malnutrition, severe malnutrition, overweight and obese used, which are based on the WHO guidelines( Reference Onyango and De Onis 14 ), are outlined in Table 1.
Table 1 Definitions used in the present study
WAZ, weight-for-age Z-score; HAZ, height-for-age Z-score; WHZ, weight-for-height Z-score; BAZ, BMI-for-age Z-score.
Data analysis
Data were analysed using the statistical software packages SPSS for Windows version 15·2 and Epi Info version 6·0. We performed the χ 2 test for trend to test for statistical significance in changing trends. Overall and site-specific sociodemographic differences were assessed. Percentage reduction was calculated by subtracting the first observation point from last one, divided by the first observation point and multiplied by 100. Logistic regression analyses were performed for all indicators of undernutrition separately for urban and rural areas at different time points assuming that there might be substantial changes of the predictors of undernutrition over the period. Analysis was done at every 10-year interval, which was considered to be an ideal approach instead of year-wise observations owing to the assumption that a 10-year interval would be sufficient to evaluate any potential changes. Thus, determinants of undernutrition were assessed in 1993, 2002 and 2012 for Dhaka, and in 2002 and 2012 for Matlab, where a subset of the total sample for each time period was considered separately.
In addition, principal component analysis (factor analysis) was performed to determine wealth quintiles (by using household assets) for each time point separately for each site, assuming that factor loadings for certain household assets may vary through the years, in ascertaining the overall trend and association with malnutrition at different points of observation. Variables included were: construction material of the wall, roof and floor of the house; and household assets (radio, television, cell phone, table, cupboard, local motorized vehicle, animal-drawn cart, refrigerator, motor boat, rickshaw and sanitary toilet). The wealth index was used as a measure of SES using information on household possessions. A weight was attached to each item from the first principal component. The households were classified into quintiles of SES based on the wealth index: quintile 1=poor, 2=lower middle, 3=middle, 4=upper middle and quintile 5=rich. Moreover, annual inflation rate of $US was used to estimate the monthly family income.
Results
A total of 28 816 under-5 children were enrolled in the DDSS of urban Dhaka Hospital during 1993–2012. Of them, 13 210 (46 %) were underweight, 11 197 (39 %) were stunted and 8031 (28 %) were wasted. Among 11 533 under-5 children in rural Matlab, 4505 (40 %) were underweight, 3606 (31 %) were stunted and 2975 (26 %) were wasted during 2000–2012. In Dhaka, 6277 (22 %) were severely underweight, 5125 (18 %) were severely stunted and 2839 (10 %) were severely wasted. In Matlab, the corresponding numbers were 1594 (14 %), 1223 (11 %) and 921 (8 %), respectively. In Dhaka, 158 (0·5 %) children fulfilled the criteria for overweight and obese as assessed by weight-for-age Z-score (WAZ) >+2·00, 409 (1·4 %) by weight-for-height Z-score (WHZ) >+2·00 and 402 (1·4 %) by BMI-for-age Z-score (BAZ) >+2·00; the corresponding numbers for Matlab were fifty-five (0·5 %), 154 (1·4 %) and 160 (1·4 %), respectively.
In Dhaka, the proportion of underweight, stunted and wasted children decreased from 59 %, 54 % and 33 %, respectively, in 1993 to 28 % (a 53 % reduction), 22 % (59 % reduction) and 21 % (36 % reduction), respectively, in 2012. Similarly, the proportion of severe underweight, severe stunting and severe wasting decreased significantly from 32 %, 28 % and 13 %, respectively, in 1993 to 10 % (a 69 % reduction), 8 % (71 % reduction) and 8 % (38 % reduction), respectively, in 2012. In 2000, the proportions of underweight, stunted and wasted children were 51 %, 36 % and 34 %, respectively, in Matlab. The corresponding figures were 27 %, 25 % and 14 %, respectively, in 2012, representing a significant reduction by 47 %, 31 % and 59 %, respectively, from 2000 (Fig. 1). Severe underweight, severe stunting and severe wasting were reduced by 62 % (from 21 % to 8 %), 33 % (from 12 % to 8 %) and 67 % (from 12 % to 4 %), respectively, over the study period in Matlab. In Dhaka, the proportion of overweight and obese children, as defined by WAZ, WHZ and BAZ, increased from 0·1 % to 1·4 %, from 0·6 % to 2·5 % and from 0·6 % to 2·6 %, respectively, between 1993 and 2012 (Fig. 1). In Matlab, the proportions of overweight and obese using the same criteria increased from 0·3 % to 0·8 %, from 0·8 % to 2·1 % and from 0·8 % to 2·2 %, respectively, between 2000 and 2012 (Fig. 1).
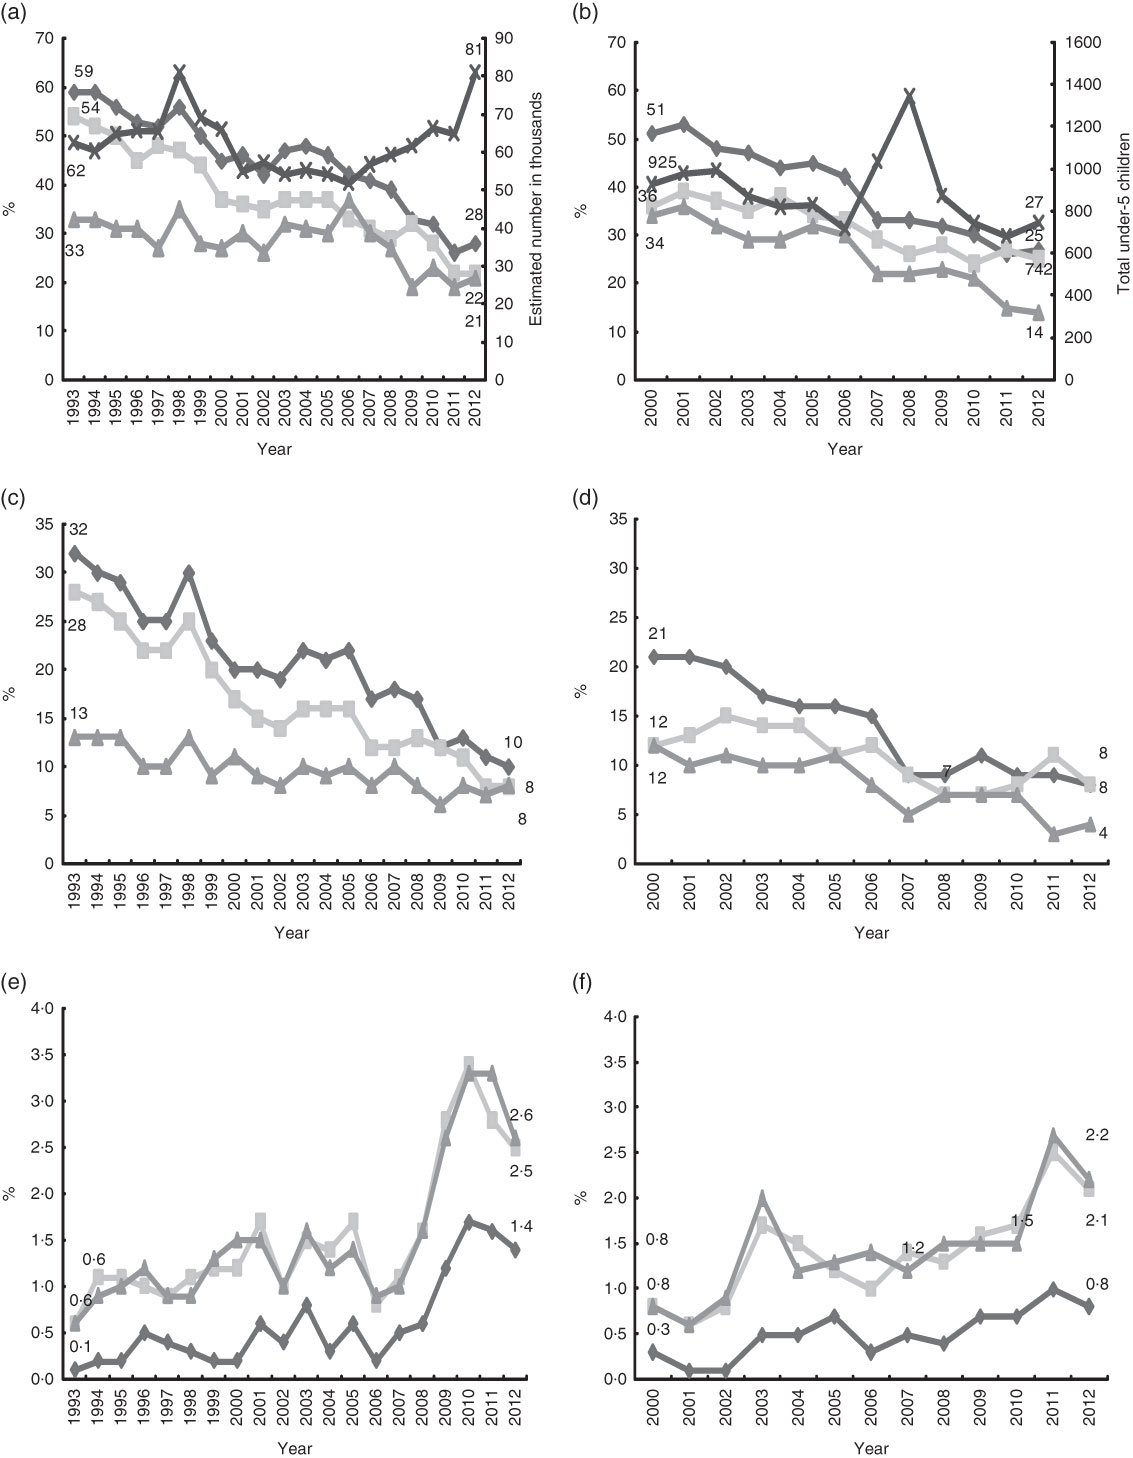
Fig. 1 Changing trend of malnutrition among under-5 children in (a, c, e) Dhaka (urban; 1993–2012) and (b, d, f) Matlab (rural; 2000–2012), Bangladesh: (a, b) malnutrition (![]() , underweight (WAZ <–2·00);
, underweight (WAZ <–2·00); ![]() , stunting (HAZ <–2·00);
, stunting (HAZ <–2·00); ![]() , wasting (HAZ <–2·00);
, wasting (HAZ <–2·00); ![]() , total under-5 children†); (b, d) severe malnutrition (
, total under-5 children†); (b, d) severe malnutrition (![]() , severe underweight (WAZ <–3·00);
, severe underweight (WAZ <–3·00); ![]() , severe stunting (HAZ <–3·00);
, severe stunting (HAZ <–3·00); ![]() , severe wasting (HAZ <–3·00)); (e, f) overweight and obese (
, severe wasting (HAZ <–3·00)); (e, f) overweight and obese (![]() , WAZ >+2·00;
, WAZ >+2·00; ![]() , WHZ >+2·00;
, WHZ >+2·00; ![]() , BAZ >+2·00); χ
2 test for trend P<0·001 for all indicators. †Estimated number was calculated as total number of under-5 children enrolled annually multiplied by 25 for 1993–1995 and by 50 for 1996–2012 (WAZ, weight-for-age Z-score; HAZ, height-for-age Z-score; WHZ, weight-for-height Z-score; BAZ, BMI-for-age Z-score)
, BAZ >+2·00); χ
2 test for trend P<0·001 for all indicators. †Estimated number was calculated as total number of under-5 children enrolled annually multiplied by 25 for 1993–1995 and by 50 for 1996–2012 (WAZ, weight-for-age Z-score; HAZ, height-for-age Z-score; WHZ, weight-for-height Z-score; BAZ, BMI-for-age Z-score)
In urban Dhaka Hospital, the proportion of illiterate mothers of the under-5 children decreased from 53 % in 1993 to 13 % in 2012, and paternal illiteracy decreased from 39 % to 17 % during the study period (Fig. 2). In Maltab, maternal and paternal illiteracy reduced from 33 % to 4 % and from 34 % to 9 %, respectively, between 2000 and 2012 (Fig. 2). In 1993, only 29 % of the children’s families in Dhaka had a monthly income greater than $US 100, which increased to 81 % in 2012. In Matlab, 32 % of the children’s families had monthly income greater than $US 100 in 2000 which increased to 67 % in 2012 (Fig. 2). The proportions of households with more than five members decreased in both urban (from 41 % to 31 %) and rural areas (from 56 % to 40 %) during the respective study periods. Significant increase in measles immunization coverage (among children ≥9 months old) was observed in both study areas. The proportion of urban households using a non-sanitary toilet decreased from 59 % in 1993 to 14 % in 2012; among households in the rural area, this proportion decreased from 90 % to 79 %. During the study period, the urban area observed significant reductions in the proportion of slum dwellers and the proportion of families drinking untreated water (Fig. 2).

Fig. 2 Changing trend of sociodemographic indicators among under-5 children in (a, c, e, g, i, k, l) Dhaka (urban; 1993–2012) and (b, d, f, h, j) Matlab (rural; 2000–2012), Bangladesh. (a, b) illiteracy rate (![]() , maternal illiteracy;
, maternal illiteracy; ![]() , paternal illiteracy); (c, d) better economic status (monthly family income greater than $US 100); (e, f) family size (more than five members); (g, h) use of non-sanitary toilet; (i, j) measles immunization (among children ≥9 months old); (k) slum residence; (l) drinking untreated water; χ
2 test for trend P<0·001 for all indicators
, paternal illiteracy); (c, d) better economic status (monthly family income greater than $US 100); (e, f) family size (more than five members); (g, h) use of non-sanitary toilet; (i, j) measles immunization (among children ≥9 months old); (k) slum residence; (l) drinking untreated water; χ
2 test for trend P<0·001 for all indicators
In the urban area in 1993, underweight was significantly positively associated with children aged 12 months and older, maternal and paternal illiteracy, slum residence, all SES categories (defined by wealth quintile and considering rich as the reference category) and the use of untreated drinking-water. In 2002, such positive associations were only found for children aged 12 months and older, paternal illiteracy and all SES categories. In 2012, underweight was positively associated with child’s age 24–59 months, maternal illiteracy and poor SES in the urban area (Table 2).
Table 2 Changing risk factors for malnutrition among under-5 children in Dhaka (urban; 1993–2012), Bangladesh
aOR, adjusted odds ratio.
Dependent variable: underweight=1, stunted=1, wasted=1 and well-nourished=0 for each point (year) of observation.
Reference categories: child’s age 0–11 months; male sex; maternal and paternal literacy; family size less than or equal to the mean; non-slum residence; monthly income >$US 100; wealth quintile=rich; drinking treated (boiled) water.
*P<0·05.
Stunting was noted beyond infancy in both study areas (Tables 2 and 3). Among children from the urban area, in 1993 stunting had a positive association with maternal and paternal illiteracy, slum residence, lower monthly family income, all SES categories and use of untreated drinking-water and a negative association with female sex; but in 2002, the association of stunting with child’s age 12–23 months, female child, maternal and paternal illiteracy, slum residence, upper middle SES and drinking untreated water dropped from the multivariate analysis model. Findings in 2012 were almost the same as those in 2002, except that maternal illiteracy and all SES categories reappeared with positive association (Table 2).
In the urban area in 1993, the factors that had a significant positive association with wasting included child’s age 12–23 months, maternal illiteracy, larger family size (more than five members), slum residence, lower monthly income ($US 100 or less), lower middle and poor SES and drinking untreated water. Child’s age 12 months and above, paternal illiteracy and middle, lower middle and poor SES had significantly positive associations with wasting in 2002; but, in 2012, only child’s age 24–59 months and maternal illiteracy had a positive association with wasting (Table 2).
The changing predictors for childhood malnutrition (underweight, stunting and wasting) in rural Matlab were mostly similar with few exceptions, as described in Table 3.
Table 3 Changing risk factors for malnutrition among under-5 children in Matlab (rural; 2002–2012), Bangladesh
aOR, adjusted odds ratio.
Dependent variable: underweight=1, stunted=1, wasted=1 and well-nourished=0 for each point (year) of observation.
Reference categories: child’s age 0–11 months; male sex; maternal and paternal literacy; family size less than or equal to the mean; monthly income >$US 100; wealth quintile=rich.
*P<0·05.
Discussion
Substantial improvements in nutritional status (reduced undernutrition) and increasing overweight and obesity have been observed globally over the last two decades and similar trends have also been reported from Bangladesh( Reference Bhutta, Ahmed and Black 2 , Reference De Onis, Blossner and Borghi 4 , Reference De Onis, Blossner and Borghi 5 ), which strengthen our present findings. Simultaneous changes have also been observed in the risk factors for malnutrition( Reference Bhutta, Ahmed and Black 2 , Reference Nahar, Ahmed and Brown 15 , Reference Chisti, Hossain and Malek 16 ). We found a high baseline prevalence for stunting and underweight in Dhaka, which might be due to the longer period of observation in Dhaka (20 years, 1993–2012) as compared with Matlab (13 years, 2000–2012).
In our analysis, we noted significant reductions in childhood malnutrition (undernutrition); however, the rates remain high and fall behind the target of Millennium Development Goals 1 and 4( 1 ). However, expected sociodemographic differences between urban and rural Bangladesh might have influenced the changing trends at different time points. Understanding potential risk factors and their appropriate response may have greater impact. Our observation of increasing childhood overweight and obesity is similar to that reported earlier( Reference De Onis, Blossner and Borghi 6 – 8 ). The combination of undernutrition and overweight and obesity is a growing burden in many developing countries including Bangladesh, which is indicative of a shifting of childhood malnutrition.
Several factors might explain the reduction in malnutrition observed in our study. For example, according to the Word Bank, the poverty headcount ratio at the national poverty line of Bangladesh (percentage of the population) was 57 % in 1992 and reduced gradually to 32 % in 2010( 17 , 18 ). In our analysis, significant reductions in the proportion of malnourished children belonging to the upper middle and middle SES quintiles were observed over the study period( Reference Chisti, Hossain and Malek 16 ). This was a risk factor in 1993 and 2002, but not in 2012. Over this period families have likely benefited from microcredit programmes that were introduced to create substantial opportunities for self-employment, liberating poor families and especially women (who are the main beneficiaries) from the clutches of poverty by bringing the poor into income streams( Reference Ahshanullah, Karim and Haq 19 ). Increased literacy rate, particularly of girls, is a major achievement of recent years in Bangladesh, which has resulted from development programmes of the Government of Bangladesh and non-government organizations( 20 , 21 ). Maternal illiteracy among malnourished children, especially in the urban area, remained a risk factor in the present study, signifying the importance of education for better child care including feeding practices( Reference Meshram, Kodavanti and Chitty 22 ); at the same time, women who are illiterate are less able to increase their knowledge/acquire specific information and are also likely to have a lower income when they are employed. Earlier, maternal illiteracy was significantly associated with malnutrition at the rural Matlab site but that did not persist in 2012. The other factors that may have contributed to the changes reported here include improved knowledge about childhood malnutrition, better maternal and childhood feeding practices including exclusive breast-feeding of infants and young children, and high immunization coverage( Reference Benakappa and Shivamurthy 23 – Reference Cruz Agudo, Jones and Berti 28 ). Like those in high-income countries, children in low- and middle-income countries consume foods that contain high amounts of fat, sugar and salt, with high energy density but lower micronutrient content; although these foods tend to be cheaper, they are low in nutrient quality( 8 ). In addition, unplanned urbanization with reduced open spaces in the urban areas and less outdoor exposure leads to reduced physical activity. Together, both of these factors result in a sharp increase in childhood overweight and obesity( Reference De Onis, Blossner and Borghi 6 – 8 , Reference Plachta-Danielzik, Kehden and Landsberg 29 ). However, in our study we lacked data on dietary habits and physical activities to examine their role in our observed results as reported elsewhere( Reference Bloem, de Pee and Hop le 30 ).
Expectedly, risk for malnutrition was greater beyond infancy, which might be an effect of less breast-feeding among older children, as breast-feeding protects children from malnutrition( Reference Dong, Qian and Liu 31 – Reference Dey, Chisti and Das 33 ). However, in late infancy, when children start to receive complementary foods, improper and inadequate feeding with a lack of dietary balance makes them vulnerable and they become malnourished( Reference Kramer and Kakuma 34 ). A few studies have reported that female children are at higher risk( Reference Choudhury, Hanifi and Rasheed 35 ), which was also observed in the early 1990s in the present study but did not remain so in 2012. We do not have a ready explanation and we did not determine the underlying social predictors; however, mass campaigning against gender discrepancy with overall increased awareness might potentially have played a role( Reference Mahmud 36 , Reference Hubbard 37 ).
Over the period, remarkable improvement occurred in the use of sanitary toilets( 38 , Reference Zheng, Hakim and Nahar 39 ). Proper disposal of faecal matter reduces faecal contamination of water and food, and ultimately helps in reducing the transmission of enteric infections including diarrhoeal disease( Reference Thapar and Sanderson 40 ). In the early 1990s, drinking untreated (non-boiled) water was a potential predictor of malnutrition in urban areas, which gradually disappeared in the year 2000 and persisted onward. Increased awareness about the benefits of drinking boiled water as a part of healthy lifestyle practices has substantial impact on reducing childhood mortality and morbidity( Reference Thapar and Sanderson 40 ). On the other hand, in rural areas, tube-wells are used as a safe source of drinking-water and thus this variable was not included in the model.
Food security is directly related to malnutrition. There has been much improvement in food security although it is still under great debate( 41 – 43 ). Bangladesh has achieved significant improvement in the production of staple foods( Reference Begum and D’Haese 44 ); to improve food security nationally, its sustainability is now of a great concern( 42 , Reference Rudolph 45 ). Natural disasters like heavy monsoons, draught, flooding, cyclones and river erosion often make inhabitants food insecure when merged with unemployment( 46 ). All of these factors contribute significantly to the existing high burden of malnutrition in Bangladesh and have been reported by several studies( 42 , 46 ). However, due to the lack of relevant information, we could not determine these as underlying predictors except for slum dwelling and poor SES of families who are constantly facing food insecurity.
Several nutritional interventions such as supplementation with fortified food, micronutrient powder distribution, home gardening, Food and Cash programmes etc. by the Government and non-governmental organizations in both urban and rural areas of Bangladesh, along with easy and non-conditional soft loans, greater childhood immunization coverage and self-employment generation, might have contributed in reducing malnutrition( 47 – Reference Ahmed, Mahfuz and Ireen 49 ). Primary health care at grassroots level through community clinics as well as strengthening of the community health-care networks is another initiative by the Government of Bangladesh. The services include antenatal check-ups, safe delivery, early resuscitation of newborns, exclusive breast-feeding and introduction of appropriate complementary foods in a timely manner; all have reduced maternal and child death rates as well as morbidities, again impacting on the reduction of malnutrition.
Limitations
The study children included in the DDSS presented with diarrhoea, which is a known risk factor for adverse nutritional status including malnutrition( Reference Brown 3 , Reference Rodriguez, Cervantes and Ortiz 50 ). The likelihood of infectious diseases is higher in malnourished children, including more severe diarrhoea, and thus the children in our study may not be truly representative of the general population. Moreover, repeated or multiple measurements on each child during the study period to determine nutritional consequences were not determined due to lack of a DDSS in the catchment population. icddr,b hospitals provide cost-free treatment to all individuals irrespective of their SES. This, along with systematic collection of data and large sample size, were among the strengths of our analysis.
Conclusion
A significant improvement in childhood nutritional status has been observed in over the past two decades in both urban and rural areas in Bangladesh. However, the study also identified malnutrition as an enduring problem. Significant increasing trends for overweight and obesity were also observed, which indicates a shifting of childhood malnutrition. Finally, we have identified changes in risk factors that may prove useful to the Government of Bangladesh and non-governmental organizations in developing their policies and programmes for effectively addressing the public health threat of childhood malnutrition.
Acknowledgements
Financial support: Hospital surveillance was funded by icddr,b and the Government of the People’s Republic of Bangladesh through IHP-HNPRP. icddr,b acknowledges with gratitude the commitment of the Government of the People’s Republic of Bangladesh to icddr,b’s research efforts. icddr,b also gratefully acknowledges the following donors who provided unrestricted support to its research efforts during the project’s life: the Australian Agency for International Development (AusAID); the Government of the People’s Republic of Bangladesh; the Canadian International Development Agency (CIDA); the Embassy of the Kingdom of the Netherlands (EKN); the Swedish International Development Cooperation Agency (Sida); the Swiss Agency for Development and Cooperation (SDC); and the Department for International Development, UK (DFID). The sponsors of the study had no role in study design, data collection, data analysis, data interpretation, or writing of the report. Conflict of interest: None. Authorship: S.K.D., A.A.M. and A.S.G.F. designed the research (project conception, development of overall research plan, study oversight). M.A.M., M.A.S. and A.S.G.F. conducted the research (hands-on conduct of the experiments and data collection). M.A.M. and A.S.G.F. provided essential materials (databases). M.A.M., S.K.D., J.D., M.A.S. and A.A.M. analysed the data or performed statistical analyses. S.K.D., M.J.C., J.D., T.A. and A.S.G.F. wrote the paper (only authors who made a major contribution). T.A. and A.S.G.F. had primary responsibility for final content. All authors reviewed the paper. S.K.D. had full access to all the data in the study and had final responsibility for the decision to submit for publication. Ethics of human subject participation: Verbal consent was taken from the parents or the attending caregivers of each child at the time of enrolment. icddr,b’s DDSS is a routine ongoing activity of the Dhaka Hospital and Matlab Hospital, which has the approval of the institutional Research Review Committee) and Ethical Review Committee.


