


It is universally accepted that populations with high-salt( Reference Gardener, Rundek and Wright 1 – Reference He and MacGregor 4 ) and indigent-K( Reference D’Elia, Barba and Cappuccio 5 – Reference Fang, Mu and He 7 ) diet are more predisposed to developing CVD. In addition, it is well known that insulin resistance has been recognised as a cornerstone of CVD occurrence and development( Reference Ginsberg 8 , Reference Bonora, Kiechl and Willeit 9 ). In fact, excess salt intake contributes to insulin resistance( Reference Ogihara, Asano and Ando 10 – Reference Ogihara, Asano and Ando 14 ) and K supplementation exerts a protective effect against insulin resistance( Reference Teramoto, Kawamori and Miyazaki 15 – Reference Chatterjee, Colangelo and Yeh 17 ). However, the mechanism underlying the completely inverse impacts of Na and K on insulin resistance remains poorly understood.
IL-1β not only interferes with the signalling of insulin target tissues such as liver, muscle and adipose tissues( Reference Wen, Gris and Lei 18 – Reference Stienstra, Joosten and Koenen 20 ), but also directly promotes pancreas islet beta-cell dysfunction and cell death( Reference Mandrup-Poulsen, Pickersgill and Donath 21 ). Therefore, NLRP3 inflammasome, serving as the key platform for IL-1β maturation and secretion, plays a central role in the initiation and progress of insulin resistance and diabetes( Reference Stienstra, van Diepen and Tack 22 , Reference Vandanmagsar, Youm and Ravussin 23 ).
Various danger signals and environmental irritants activate NLRP3 inflammasome through triggering reactive oxygen species (ROS) generation( Reference Tschopp and Schroder 24 – Reference Dostert, Petrilli and Van Bruggen 26 ). It is worth noting that an increased oxidative stress occurs in rats with high-salt diet( Reference Di Castro, Scarpino and Marchitti 27 – Reference Wang, Chen and Wang 30 ), whereas high-K diets decrease oxidative stress in rats( Reference Ishimitsu, Tobian and Sugimoto 31 ) and K can inhibit ROS generation of human white blood cells in vitro ( Reference McCabe, Bakarich and Srivastava 32 ). Therefore, we hypothesised that Na could activate NLRP3 inflammasome by enhancing oxidative stress and further result in insulin resistance, whereas K could moderate the effect. In the present study, fifty normotensive subjects were recruited and received an intervention trial with three phases, including low-salt diet for 7 d, high-salt diet for 7 d and high-salt diet with K supplementation for another 7 d in normotensive subjects, and THP cells were cultured in different levels of Na and K to determine whether NLRP3 inflammasome is involved in the impacts of Na and K on insulin resistance.
Methods
Subjects
We enrolled fifty subjects, aged 29 to 65 years, from a rural community of northern China. One of them was excluded because the subject failed to finish whole intervention procedures and so the data of forty-nine subjects were analysed finally. Main demographic data, such as age, sex, weight and waist circumference, were collected. The criterion for hypertension was a resting blood pressure (BP) of over 140/90 mmHg at two different visits or on medication. Exclusion criteria were as follows: advanced liver disease, renal failure, cancer, valvular heart disease, heart failure, stroke, atrial fibrillation, peripheral arterial disease and other vascular diseases. The investigation conformed to the Declaration of Helsinki. The study protocol was approved by the Institutional Ethics Committee of Xi’an Jiaotong University Medical School and written informed consent was obtained from all the subjects.
The protocol of population intervention
As described previously( Reference Fang, Mu and He 7 , Reference Chen, Gu and Huang 33 , Reference Gu, Zhao and Chen 34 ), the protocol included a questionnaire survey and physical examination for 3 d, 7 d on a low-salt diet (3 g of NaCl/d), 7 d on a high-salt diet (18 g of NaCl/d) and a high-salt diet with K supplementation (4·5 g of KCl/d) for another 7 d. Before the investigation, all subjects were given detailed instructions to avoid cooking salt, table salt and salty snacks during the entire intervention period. All of the meals were cooked in research kitchens and consumed onsite under the supervision of the study staff.
Blood pressure measurement and definition of salt sensitivity
Three BP measurements were performed every morning with a Hawksley random-zero sphygmomanometer during the 3-d baseline observation period and on days 2, 5, 6 and 7 of each intervention period. BP was measured by trained and certified members according to a standard procedure recommended by the American Heart Association. BP was measured after 5 min of rest. In addition, all subjects were warned to avoid cigarette, alcohol, coffee/tea and exercise for at least 30 min before BP measurement. Salt sensitivity was defined as a mean arterial BP (MAP) increase of more than 5 mmHg from a low- to a high-salt diet intervention( Reference Chen, Gu and Huang 33 , Reference Sullivan 35 ).
ELISA
Fasting venous blood samples were drawn by trained phlebotomists in the morning of day 7 of each intervention period and were collected in EDTA-vacutainer tubes. The plasma samples were centrifuged at 3000 rpm for 20 min at 4°C and were then kept frozen at −80°C until analysis. The supernatants were collected and stored at −80°C. Plasma and the supernatant level of IL-1β was detected by ELISA with Human IL-1β ELISA Kit (Biolegend and R&D, respectively).
Assessment of insulin resistance
Plasma insulin and plasma C-peptide were detected by radioimmunoassay (125I Insulin Radioimmunoassay Kit or 125I C-peptide Radioimmunoassay Kit; Beijing North Institute of Biological Technology). Plasma glucose was assayed by our hospital’s clinical laboratory. Homeostatic model assessment for insulin resistance index (HOMA-IR) was calculated using HOMA Calculator version 2.2.3 software.
Oxidative stress assay
Plasma superoxide dismutase (SOD; NanJing JianCheng Bioengineering Institute) and malondialdehyde (MDA, NanJing JianCheng Bioengineering Institute) were determined by colorimetry.
Isolation of peripheral blood mononuclear cells
Peripheral blood mononuclear cells (PBMC) were isolated by Ficoll standard density gradient centrifugation. The upper layer containing PBMC was harvested and washed with Hank’s balanced salt solution and then with PBS.
Cell culture
THP-1 cells were cultured in Roswell Park Memorial Institute (RPMI) 1640 medium supplemented with 10 % FCS, 2 mm l-glutamine, 100 units/ml penicillin, 100 μg/ml streptomycin and 50 μm 2-mercaptoethanol. Before intervention, cells were cultured in serum-free 1640 medium for 24 h, so that the cell were synchronised. Pre-treated for 3 h with lipopolysaccharide (LPS, 200 ng/ml; Sigma), THP-1 cells were then cultured with different concentrations of sodium chloride with or without potassium chloride. To assess the role of oxidative stress in the activation of NLRP3 inflammasome, THP-1 cells were pre-treated for 20 min with antioxidant N-acetyl-l-cysteine (NAC, 25 mM; Sigma) and then cultured with sodium chloride. In addition, to evaluate the role of oxidative stress in the inhibition of NLRP3 inflammasome by potassium chloride, THP-1 cells were pre-treated for 24 h with potassium chloride (60 mm) and then cultured with oxidant Rosup (50 μg/ml; Fanbo Biochemicals). The supernatants were collected for determination of IL-1β. Cell viability after treatment with indicated agents was evaluated by trypan blue exclusion and was consistently >90 %. All experiments were repeated three times.
Quantitative PCR and Western blot analysis
Total RNA was isolated by use of Trizol reagent (Invitrogen) and proteins were isolated by use of RIPA Cell Lysis Reagent (GENSHARE LOGICAL). The extracted RNA was reverse transcribed and analysed by quantitative PCR with use of the SYBR®PrimeScript TMRT-PCR Kit (TaKaRa). Glyceraldehyde-3-phosphate dehydrogenase (GAPDH) was a housekeeping gene. The primers used in quantitative PCR are as follows: NLRP3-F: 5'-CTGTAACATTCGGAGATTGTGGTT-3'; NLRP3-R: 5'-GACCAAGGAGATGT-CGAAGCA-3'.CASEPASE-1–F:5'-CCGCAAGGTTCGATTTTCA-3';CASEPASE-1–R:5'-ACTCTTTCAGTGGTGGGCATCT-3'.GAPDH–F:5'-GCACCGTCAAGGCTG AGAAC-3'; GAPDH–R:5'-TGGTGAAGACGCCAGTGGA-3'. For Western blot analysis, protein extracts were separated by SDS-PAGE and the transferred blots were incubated overnight at 4°C with caspase-1 antibody (Cell Signaling) or NLRP3 antibody (Cell Signaling), and then horseradish-peroxidase-conjugated anti-goat and anti-rat, or anti-rabbit secondary antibodies. The enhanced chemiluminescent substrate was used to detect protein bands.
Reactive oxygen species detection
The intracellular ROS was detected by use of Reactive Oxygen Species Assay Kit from Fanbo Biochemicals. The cell pellets were resuspended in 600 μl of ROS detection solution for incubaton for 20 min in the dark, and then determined by flow cytometry (FACSantoTMII; BD Biosciences) with excitation at 490 nm and emission at 525 nm. The data were obtained and analysed with the BD FACSDiva software (BD Biosciences).
Statistical analyses
Data were collected and analysed with SPSS 13.0 for Windows (SPSS Inc.). Quantitative variables were expressed as mean values and standard deviations. Categorical variables were expressed as frequency and percentage. The Kolmogorov–Smirnov test was used to assess normal distribution of quantitative variables. Independent-samples or paired t tests were performed to compare the parametric values between the two variables, and categorical variables were compared by the χ 2 test. Repeated-measures ANOVA was used for comparison of multiple variables. The degree of association between two continuous variables was analysed using Pearson’s correlation coefficients. All probability values were two-tailed. A value of P<0·05 was considered statistically significant.
Results
Profiles of studied subjects
In all, twenty-one of forty-nine subjects, experiencing an increase in MAP by more than 5 mmHg from a low- to a high-salt diet intervention, were defined as SS and the other twenty-eight, experiencing less change, were classified as SR( Reference Chen, Gu and Huang 33 ). Baseline systolic BP in SS subjects was significantly higher than that in SR (Table 1, P=0·044), and compared with SR subjects the SS subjects were older (Table 1, P=0·005). There was no significant difference between SS and SR subjects in BMI, diastolic , MAP and other biochemical markers (Table 1).
Table 1 Characteristics of salt-sensitive and salt-resistant subjects on baseline (Mean values and standard deviations)
SR, salt resistant; SS, salt-sensitive.
Potassium supplementation alleviated insulin resistance caused by salt loading in the subjects
Compared with low-salt diet, the levels of plasma glucose, insulin and C-peptide were significantly increased after high-salt loading (Table 2, P<0·01) and K supplementation lowered them in both SS and SR groups (Table 2, P<0·01). The levels of plasma glucose, insulin and C-peptide in SS subjects were notably higher than that in SR subjects on a high-salt diet (Table 2, P<0·05).
Table 2 Effects of salt loading and potassium supplementation on plasma glucose, insulin and C-peptide (Mean values and standard deviations)
LS, low salt; HS, high salt; HS+K, high salt with K supplementation; SS, salt-sensitive; SR, salt resistant.
* P<0·01 v. HS. † P<0·05 v. SR.
HOME-IR was considerably elevated from low-salt period to high-salt loading (SS: 1·5 (sd 0·21) v. 2·4 (sd 0·40), P<0·001; SR: 1·4 (sd 0·17) v. 1·9 (sd 0·19), P<0·001, respectively) and HOME-IR increase induced by a high-salt intake was markedly ameliorated by K supplementation in both SS and SR groups (SS: 2·4 (sd 0·40) v. 1·6 (sd 0·31), P<0·001; SR: 1·9 (sd 0·19) v. 1·4 (sd 0·17), P<0·001, respectively). In line with plasma glucose, insulin and C-peptide, HOME-IR was higher in SS subjects than that in SR subjects on a high-salt diet (2·4 (sd 0·40) v. 1·9 (sd 0·19), P<0·05).
Potassium supplementation reversed the active effects of salt loading on NLRP3 inflammasome in the subjects
As shown in Fig. 1, the protein and mRNA levels of NLRP3 (a, b) and Caspase-1 (c, d) in PBMC were significantly increased after high-salt intervention, and K supplementation reversed them. Moreover, plasma IL-1β, the index of NLRP3 inflammasome activation, was also significantly elevated after high-salt loading (e, SS, 8·8 (sd 3·0) v. 16·1 (sd 4·9) pg/ml, P<0·01; f, SR, 5·4 (sd 2·7) v. 10·5 (sd 4·0) pg/ml, P<0·01) and K supplementation alleviated them (e, SS, 16·1 (sd 4·9) v. 9·8 (sd 3·3) pg/ml, P<0·01; f, SR, 10·5 (sd 4·0) v. 5·4 (sd 3·3) pg/ml, P<0·01). Additionally, plasma IL-1β was considerably higher in SS subjects than that in SR subjects on a high-salt diet (SS, 16·1 (sd 4·9) v. SR, 10·5 (sd 4·0) pg/ml, P<0·05).
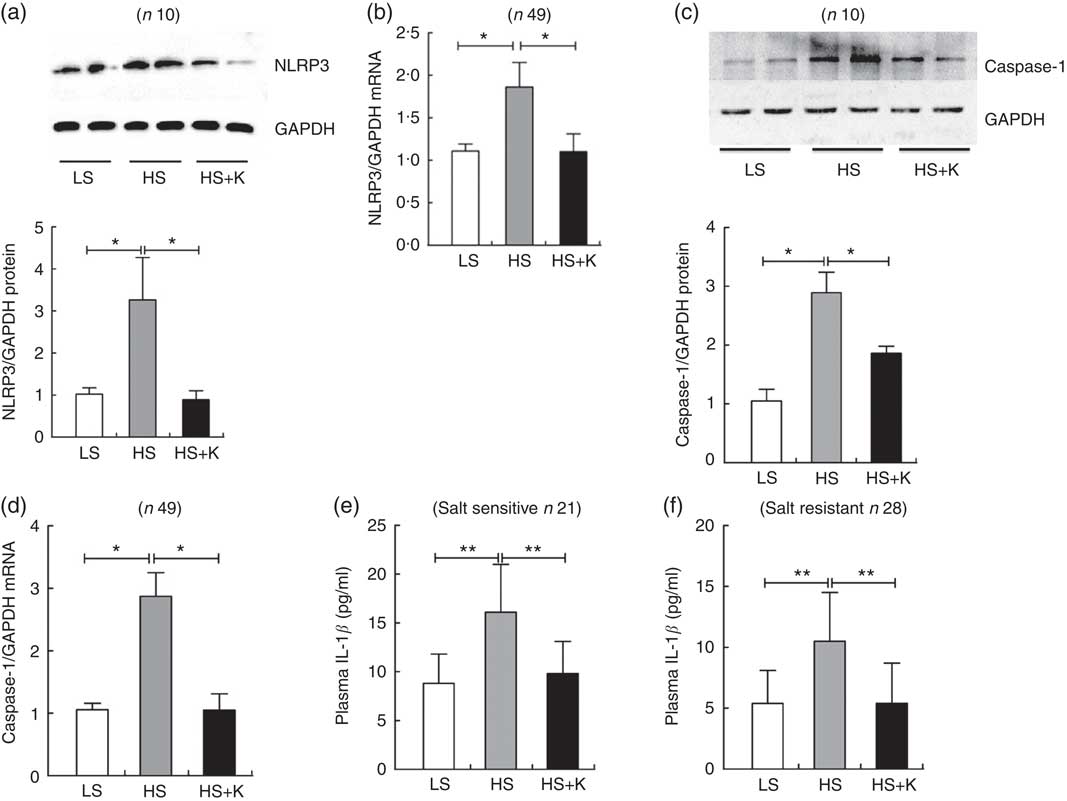
Fig. 1 The impacts of salt loading and potassium supplementation on NLRP3 inflammasome in peripheral blood mononuclear cells (PBMC) from the subjects. The PBMC of the subjects were isolated by Ficoll standard density gradient centrifugation. (a) Representative immunoblot for NLRP3 in PBMC from the subjects. (b) The mRNA level of NLRP3 in PBMC from the subjects by quantitative RT-PCR. (c) Representative immunoblot for caspase-1 in PBMC from the subjects. (d) The mRNA level of caspase-1 in PBMC from the subjects by quantitative RT-PCR. (e) ELISA to detect plasma IL-1β in salt-sensitive subjects. (f) ELISA to detect plasma IL-1β in salt-resistant subjects. Values are means, and standard deviations represented by vertical bars. LS, low salt; HS, high salt; HS+K, high salt with potassium supplementation. * P<0·05, ** P<0·01. GAPDH, glyceraldehyde-3-phosphate dehydrogenase.
The alteration of insulin resistance index considerably and positively correlated with the change of plasma IL-1β during intervention
As shown in Fig. 2, the net increase in insulin resistance strongly correlated with the net increase in plasma IL-1β after high-salt loading in both SS and SR subjects (a, SS, r 0·748, P<0·01; b, SR, r 0·575, P=0·01, respectively), and the extent of the reduction in insulin resistance was significantly related to the extent of the decrease in plasma IL-1β from high-salt diet to high-salt diet with K supplementation (c, SS, r 0·794, P<0·01; d, SR, r 0·492, P<0·01, respectively).
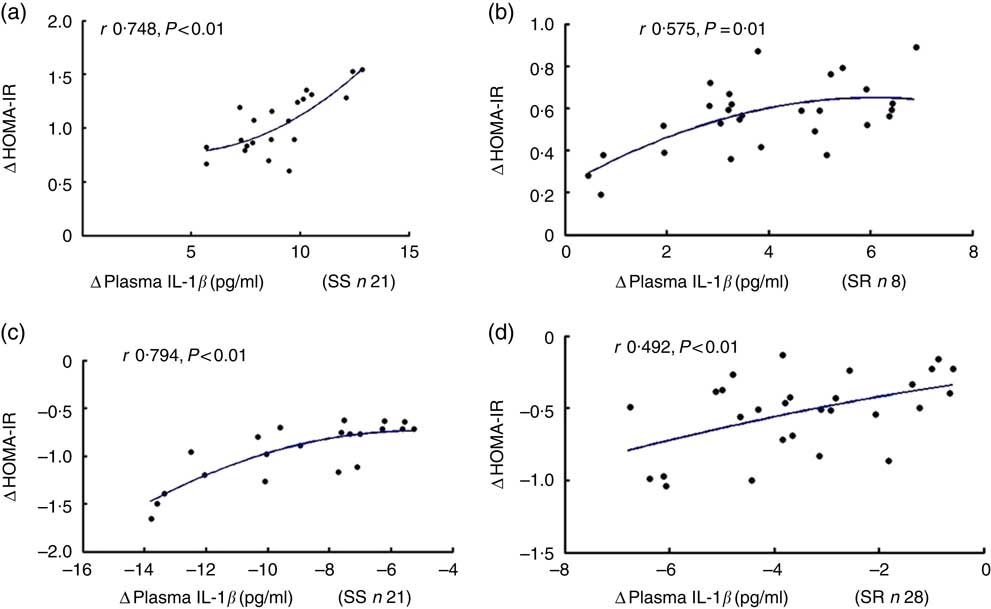
Fig. 2 The correlation between insulin resistance and plasma IL-1β. Plasma insulin was detected by radioimmunoassay. Plasma glucose was assayed by the hospital’s clinical laboratory. Homeostatic model assessment for insulin resistance index (HOMA-IR) was calculated using HOMA Calculator version 2.2.3 software. The relationship between HOMA-IR and plasma IL-1β after high-salt loading in both salt-sensitive (SS, a) and salt-resistant (SR, b) subjects. The relationship between HOMA-IR and plasma IL-1β in both SS (c) and SR (d) subjects after high-salt loading with potassium supplementation.
Potassium supplementation ameliorated salt-loading-induced oxidative stress in the subjects
Oxidative stress plays a key role in the activation of NLRP3 inflammasome( Reference Tschopp and Schroder 24–26 ). To interpret the mechanism by which both salt and K exert an effect on NLRP3 inflammasome, we further explored the impacts of salt loading and K supplementation on oxidative stress in the subjects.
As demonstrated in Fig. 3, plasma SOD was significantly decreased after high-salt loading (a, SS, 123·4 (sd 22·1) v. 97·5 (sd 20·7) μ/ml, P<0·01; SR, 154·6 (sd 34·4) v. 100·1 (sd 23·5) μ/ml, P<0·01) and it was elevated with K supplementation (a, SS, 97·5 (sd 20·7) v. 133·1 (sd 23·7) μ/ml, P<0·01; SR, 100·1 (sd 23·5) v.159·2 (sd 37·3) μ/ml, P<0·01). Moreover, high-salt diet elevated plasma MDA (b, SS, 3·4 (sd 0·61) v. 5·2 (sd 0·61) nmol/ml, P<0·01; SR, 3·4 (sd 0·31) v. 4·6 (sd 0·42) nmol/ml, P<0·01) and K supplementation lowered it (b, SS, 5·2 (sd 0·61) v. 3·7 (sd 0·53) nmol/ml, P<0·01; SR, 4·6 (sd 0·42) v. 3·5 (sd 0·37) nmol/ml, P<0·01). In addition, plasma SOD in SR subjects was higher than that in SS subjects on a low-salt diet (154·6 (sd 34·4) v. 123·4 (sd 22·1) μ/ml, P<0·05). Moreover, plasma MDA in SS subjects was higher than that in SR subjects on a high-salt diet (5·2 (sd 0·61) v. 4·6 (sd 0·42) nmol/ml, P<0·05).
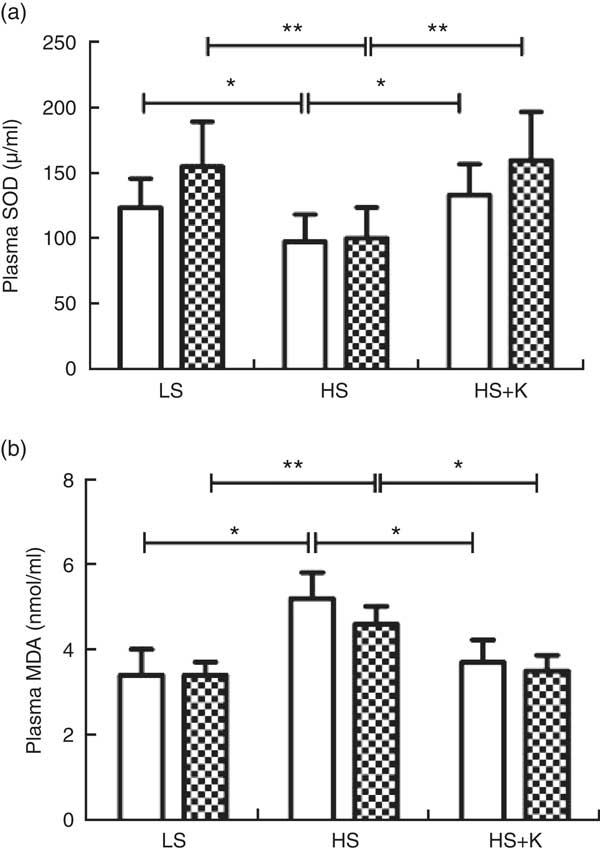
Fig. 3 Potassium supplementation reversed oxidative stress induced by salt loading. Plasma superoxide dismutase (SOD) (a) and plasma malondialdehyde (MDA) (b) were determined by colorimetry. Values are means, and standard deviations represented by vertical bars. ![]() , Salt sensitive;
, Salt sensitive; ![]() , salt resistant; LS, low salt; HS, high salt; HS+K, high salt with potassium supplementation. * P<0·05, ** P<0·01.
, salt resistant; LS, low salt; HS, high salt; HS+K, high salt with potassium supplementation. * P<0·05, ** P<0·01.
The change of oxidative stress biomarker significantly levelled with the alteration of plasma IL-1β during intervention
As shown in Fig. 4, the net increase in plasma IL-1β negatively correlated with the net decrease in plasma SOD after high-salt loading (a, SS, r −0·661, P=0·001; b, SR, r −0·699, P<0·01, respectively), and the net decrease in plasma IL-1β was negatively related to the net increase in plasma SOD on K supplementation (c, SS, r −0·698, P<0·01; d, SR, r −0·551, P=0·002, respectively).
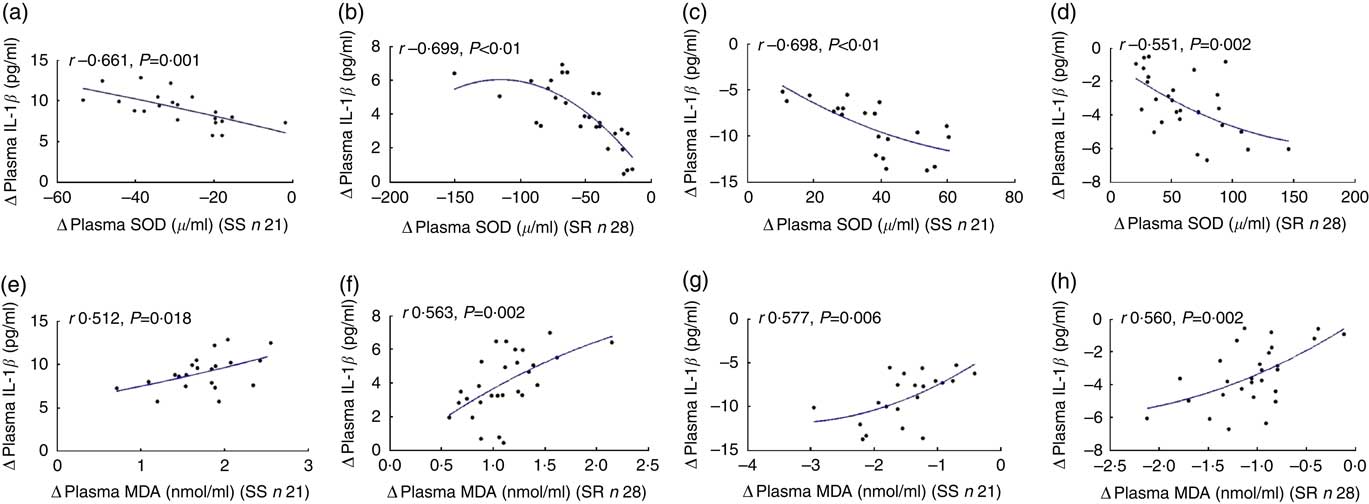
Fig. 4 The correlation between oxidative stress and plasma IL-1β. Plasma superoxide dismutase (SOD) and plasma malondialdehyde (MDA) were determined by colorimetry. The plasma IL-1β was assayed by ELISA. The relationship between plasma IL-1β with plasma SOD after high-salt loading (a, salt sensitive (SS); b, salt resistant) and high-salt loading with potassium supplementation (c, SS; d, SR). The relationship between plasma IL-1β with plasma MDA after high-salt loading in both SS (e) and SR (f) subjects, and high-salt loading with potassium supplementation in both SS (g) and SR (h) subjects.
Fig. 5 also displays that the extent of the increase in plasma IL-1β correlated notably with the extent of the increase in plasma MDA after high-salt loading (e, SS, r 0·512, P=0·018; f, SR, r 0·563, P=0·002, respectively), and the net increase in plasma IL-1β was significantly related to the net increase in plasma MDA on K supplementation (g, SS, r 0·577, P=0·006; h, SR, r 0·560, P=0·002, respectively).
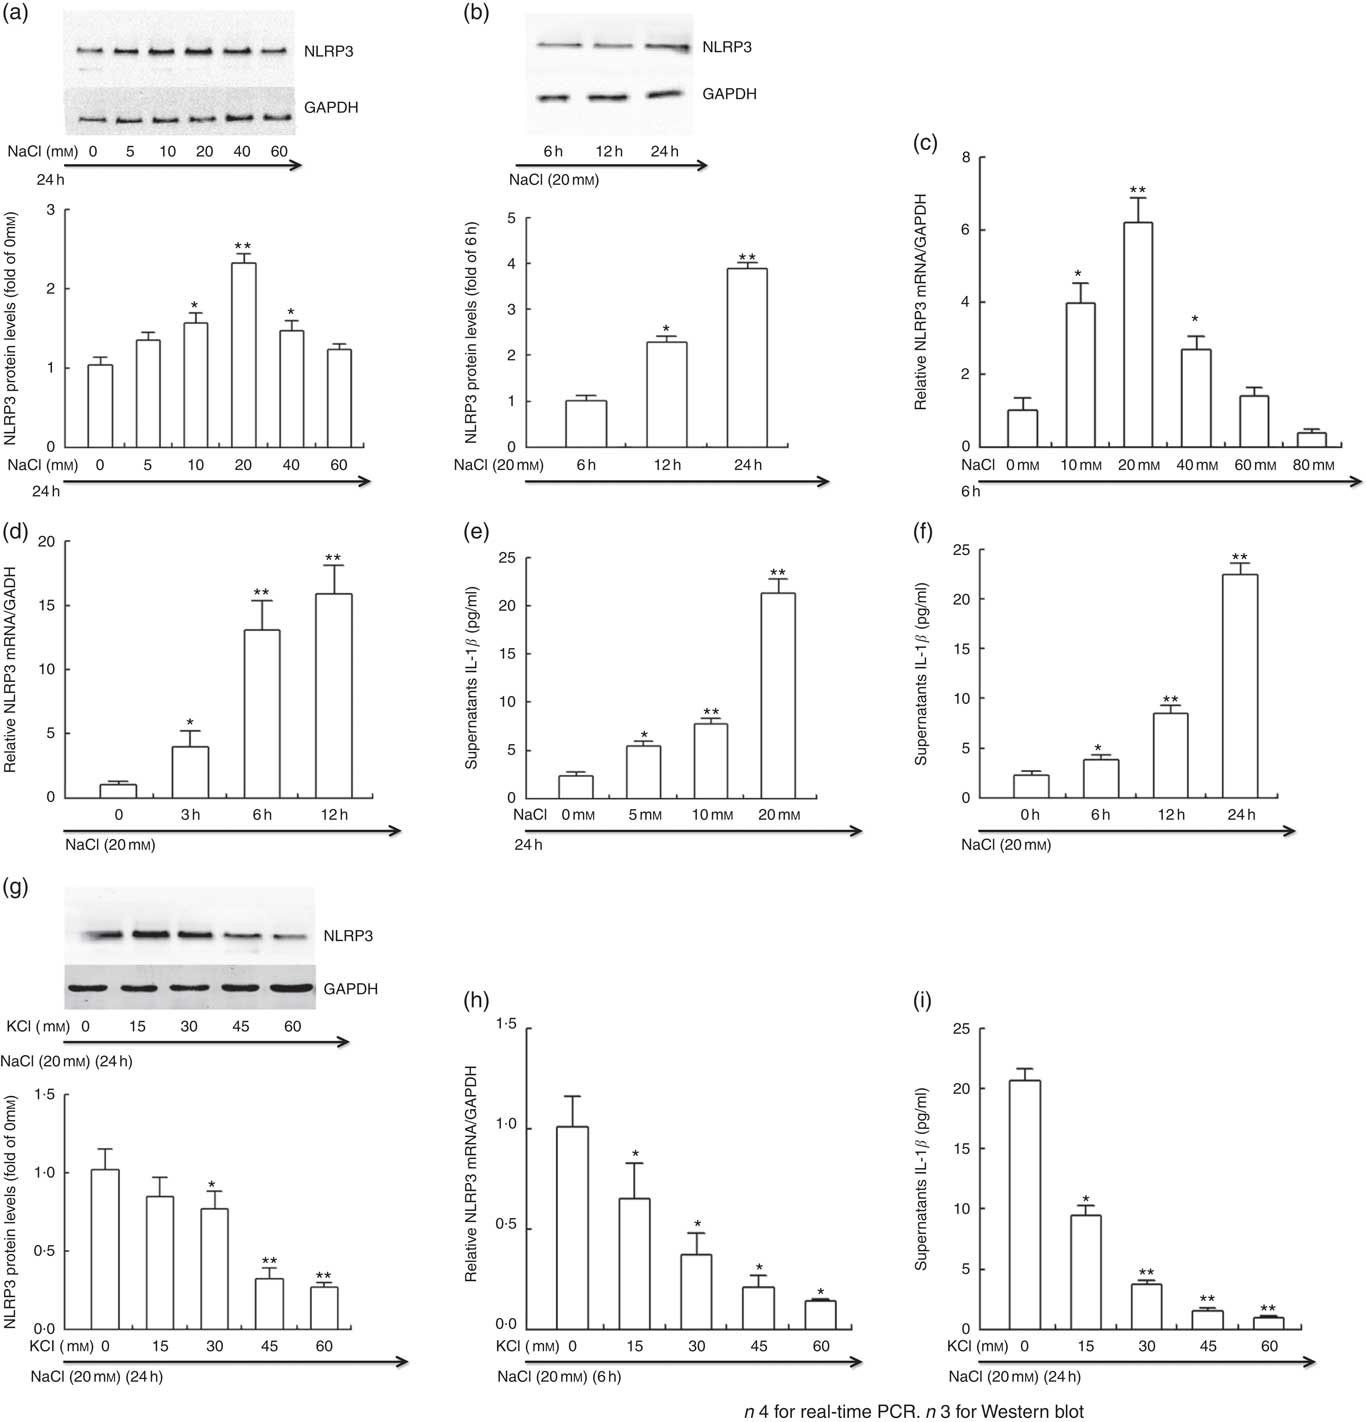
Fig. 5 Potassium reversed the active effects of sodium on NLRP3 inflammasome in vitro. THP-1 cells were incubated in Roswell Park Memorial Institute (RPMI) medium containing different levels of sodium chloride with or without potassium chloride. At the end of incubation, cells were lysed, and NLRP3 protein and mRNA expression were determined by Western blotting and real-time PCR, respectively. Culture supernatants were collected and IL-1β was analysed by ELISA. (a, b, g) Representative immunoblot for NLRP3. (c, d, h) The mRNA level of NLRP3 in cultured THP-1 cells by quantitative RT-PCR. (e, f, i) ELISA to detect culture supernatants IL-1β. Values are means, and standard deviations represented by vertical bars. * P<0·05, ** P<0·01. GAPDH, glyceraldehyde-3-phosphate dehydrogenase.
Potassium chloride inhibited the active effects of sodium chloride on NLRP3 inflammasome in vitro
The intervention study demonstrated that salt loading contributed to the activation of NLRP3 inflammasome, and K supplementation drastically blocked the activation of NLRP3 inflammasome induced by sodium chloride. To further evaluate the impacts of Na and K on NLRP3 inflammasome, we treated the THP-1 cells with different levels of sodium chloride with or without potassium chloride in vitro.
As displayed in Fig. 5, the protein (a and b) and mRNA expression (c and d) of NLRP3 and the level of culture supernatants IL-1β (e and f) was significantly enhanced by sodium chloride in a time- and dose-dependent manner. In line with the results in vivo, potassium chloride considerably prevented the increase in the protein (g) and mRNA expression (h) of NLRP3 and the culture supernatants IL-1β induced by high sodium chloride (i).
Oxidative stress mediated the effects of sodium chloride and potassium chloride on NLRP3 inflammasome in vitro
The present intervention study showed that salt loading caused the increase in plasma oxidative stress, and K supplementation radically reversed the effect. Moreover, the change of oxidative stress considerably related with the alteration of plasma IL-1β during intervention. This raises the possibility that oxidative stress is involved in the effects of Na and K on NLRP3 inflammasome. Therefore, to confirm the hypothesis, we further performed the experiments in vitro.
Fig. 6 demonstrated that intracellular ROS was enhanced by sodium chloride in a dose-dependent manner (a) and potassium chloride blocked it (b). Both antioxidant NAC and potassium chloride could significantly reduce the protein (c) and mRNA (d) expression of NLRP3 and the level of culture supernatants IL-1β (e) induced by high sodium chloride. Moreover, potassium chloride could considerably block the increase in the protein (f) and mRNA (g) expression of NLRP3 and the level of culture supernatants IL-1β (h) induced by high sodium chloride or oxidant Rosup. Taken together, these results demonstrated that oxidative stress was involved in the mechanism by which both Na and K exerted an effect on NLRP3 inflammasome.

Fig. 6 Oxidative stress mediated the effects of sodium and potassium on NLRP3 inflammasome. THP-1 cells were incubated in Roswell Park Memorial Institute (RPMI) with 0–20 mm sodium chloride (6A) or with 20 mm sodium chloride and 0–60 mm potassium chloride (b) for 6 h. THP-1 cells were incubated in RPMI containing 20 mm sodium chloride with or without 60 mm potassium chloride or 25 mm antioxidant N-acetyl-l-cysteine (NAC) (c–e). Moreover, pre-treated with 60 mm potassium chloride for 24 h, THP-1 cells were then cultured with oxidant Rosup (50 μg/ml) or additional 20 mm sodium chloride (f–h). At the end, cells were lysed, and NLRP3 protein and mRNA expression were assayed by Western blotting and real-time PCR, respectively. Culture supernatant IL-1β was analysed by ELISA. (a, b) Representative intracellular reactive oxygen species assayed by flow cytometry. (c, f) Representative immunoblot for NLRP3. (d, g) The mRNA level of NLRP3 in cultured THP-1 cells by quantitative RT-PCR. (e, h) ELISA to detect culture supernatants IL-1β. Values are means, and standard deviations represented by vertical bars. * P<0·05, ** P<0·01. GAPDH, glyceraldehyde-3-phosphate dehydrogenase.
Discussion
The present experiments involving normotensive Asians, as well as THP-1 cells, demonstrated that NLRP3 inflammasome was involved in the impacts of salt and K on insulin resistance. We found that salt loading contributed to intensive oxidative stress, and then induced the activation of NLRP3 inflammasome and consequent production and secretion of IL-1β, resulting in insulin resistance, whereas combination of additional K and salt loading markedly reversed them. On the basis of the crucial role of NLRP3 inflammasome in the induction and progress of insulin resistance( Reference Stienstra, van Diepen and Tack 22 ), we propose that NLRP3 inflammasome has the potential to be a mediator in the impacts of Na and K on insulin resistance.
Increasing evidence suggests that compared with prehistoric or primitive humans modern people with more Na and less K intake are more vulnerable to suffering from CVD( Reference Cook, Cutler and Obarzanek 2 ). Although the exact mechanism by which Na and K exert the impacts on CVD remains unclear, insulin resistance, a common cornerstone of CVD occurrence and development( Reference Saltiel and Olefsky 36 ), is recognised as a key player. High Na intake impairs insulin signalling and aggravates insulin resistance in Dahl salt-sensitive rats( Reference Ogihara, Asano and Ando 10 , Reference Ogihara, Asano and Ando 14 ), and K supplementation ameliorates insulin resistance( Reference Ogihara, Asano and Ando 14 ). Similarly, high-salt diet enhances insulin resistance in subjects with( Reference Vedovato, Lepore and Coracina 11 ) and without type 2 diabetes( Reference Millen, Norton and Majane 12 , Reference Baudrand, Campino and Carvajal 13 ), whereas K supplementation could improve insulin sensitivity and reduce the prevalence of the metabolic syndrome and type 2 diabetic( Reference Teramoto, Kawamori and Miyazaki 15 – Reference Chatterjee, Colangelo and Yeh 17 , Reference Shin, Joh and Kim 37 ). Reconciling previous literature with the present report, our result demonstrated that high-salt diet contributed to insulin resistance, whereas adding K to salt loading markedly reversed the process in the subjects. Thus, the impact of K supplementation and Na intake on insulin resistance is just like the yin and yang. It is notable that after high-salt intake, both SS group and SR groups exhibited elevated insulin resistance, whereas some previous experiments revealed that high-salt-induced insulin resistance only in SS individuals or rats. Indeed, our results showed that HOME-IR was higher in SS subjects than in SR subjects on a high-salt diet, indicating that the SS subjects may be more vulnerable to developing insulin resistance following high-salt loading.
With respect to the molecular mechanisms by which both Na and K exert an impact on insulin resistance, NLRP3 inflammasome, a large multimeric platform that mediates activation of caspase-1 and promotes the cleavage of pro-IL-1β into mature forms IL-1β ( Reference Schroder and Tschopp 38 , Reference Barker, Taxman and Ting 39 ), may get involved in the process. IL-1β contributes to insulin resistance by impairing insulin signal pathway of adipose, liver and muscle tissues( Reference Wen, Gris and Lei 18 – Reference Stienstra, Joosten and Koenen 20 ). Moreover, previous studies in mice with gene ablation have indicated that NLRP3 inflammasome is a central player in the initiation and development of insulin resistance( Reference Wen, Gris and Lei 18 , Reference Stienstra, Joosten and Koenen 20 , Reference Stienstra, van Diepen and Tack 22 , Reference Vandanmagsar, Youm and Ravussin 23 , Reference Zhou, Tardivel and Thorens 25 ). Genetic knockout of NLRP3 or its associated molecules relieves insulin resistance induced by a high-fat diet. Accordingly, the present study focused on assessing the effects of salt and K on NLRP3 inflammasome in vivo and in vitro. As expected, high salt significantly contributed to the activation of NLRP3 inflammasome and additional K markedly reversed the effect in both the subjects and THP-1 cells. Moreover, insulin resistance notably related with the activity of NLRP3 inflammasome in the subjects. Taken together, these results suggest that Na and K exert completely inverse effects on NLRP3 inflammasome activity.
Notably, high-salt diet causes increased oxidative stress( Reference Di Castro, Scarpino and Marchitti 27 – Reference Wang, Chen and Wang 30 ), whereas diets abundant in K lessens oxidative stress induced by salt loading( Reference Ishimitsu, Tobian and Sugimoto 31 ). Moreover, K can inhibit ROS generation of human white blood cells in vitro ( Reference McCabe, Bakarich and Srivastava 32 ). In line with previous reports, our results demonstrated that high salt significantly increased oxidative stress and additional K considerably reduced oxidative stress in both the subjects and THP-1 cells. Multiple signalling pathways of NLRP3 inflammasome activation converges on ROS production. NLRP3 inflammasome is a common sensor of cellular stress through its activation by ROS. Either various danger signals or environmental irritants activate NLRP3 inflammasome through promoting ROS production( Reference Tschopp and Schroder 24 – Reference Dostert, Petrilli and Van Bruggen 26 ). NAC, an ROS inhibitor, significantly prevents NLRP3 inflammasome activation and IL-1β secretion induced by LPS plus palmitate-free bovine serum albumin( Reference Wen, Gris and Lei 18 ). Similarly, the present experiment showed that either additional K or NAC significantly inhibited NLRP3 inflammasome activation induced by high salt or oxidant Rosup in vitro. Taken together, these results demonstrate that oxidative stress is involved in the modulation of NLRP3 inflammasome activity by Na and K.
Furthermore, recent report demonstrates that K efflux and Na influx can modulate NLRP3 inflammasome activation( Reference Munoz-Planillo, Kuffa and Martinez-Colon 40 ), and ROS production is often accompanied by K efflux( Reference Tschopp and Schroder 24 ). It is possible that ROS generation triggers intracellular K efflux or vice versa( Reference Kowaltowski, de Souza-Pinto and Castilho 41 ). Therefore, we cannot exclude the possibility that high salt activates NLRP3 inflammasome in part by promoting Na influx and/or K efflux and additional K inhibits NLRP3 inflammasome to some extent by blocking K efflux.
Conclusions
In summary, the present study demonstrated that high salt contributed to insulin resistance by oxidative stress activation of NLRP3 inflammasome, whereas additional K released high-salt-induced insulin resistance via the inhibition of oxidative stress and NLRP3 inflammasome. Thus, we propose that NLRP3 inflammasome may be a common mediator by which Na and K exert an impact on insulin resistance. In addition, K supplementation appears to help to improve insulin resistance via inhibiting NLRP3 inflammasome and reduce the occurrence and development of CVD in modern people with high-salt diets. K is abundant in fresh fruits and vegetables. Therefore, a greater fresh fruit and vegetable consumption and reasonable salt restriction could protect against the occurrence of insulin resistance and CVD.
Acknowledgements
This work was supported in part by the National Program on Key Basic Research Project of China (973 Program: 2012CB517804 to Z. Y.); the National Science Fund for Distinguished Young Scholars (nos 81025002 to Z. Y.); and NSFC (nos 81370357 and 81570381 to J. M.).
The authors’ contributions are as follows: Z. W. wrote the manuscript; Z. W., W. W., K. R., D. Z., J. L., Y. W. and J. Z. participated in the study design and performed all processes of the study; Z. Y. and J. M. provided supervision and revised the manuscript; D. Z., J. L., Y. W. and J. Z. assisted with the editing of the manuscript; Z. W., W. W. and K. R. were involved in data acquisition, recruited subjects and collected samples. All authors participated in the analytic discussion of the results and approved the final version of the manuscript.
None of the authors has any conflicts of interest to declare.


