


Vegetables are an outstanding source of vitamins and minerals that contribute numerous health benefits, including antioxidant and anti-inflammatory effects(Reference Slavin and Lloyd1). In addition, vegetables provide dietary fibre and phytochemicals that decrease the risk of diabetes, heart disease, stroke and different types of cancer(Reference Dias2). A systematic review and meta-analysis by Aune et al. (Reference Aune, Giovannucci and Boffetta3) observed that diet intakes of fruit and vegetables were associated with a reduction in cancer and CVD, as well as diminished risks of all-cause mortality. It is believed that intake of cruciferous vegetables decreases cancer risk through a variety of mechanisms, such as reducing carcinogen activation and protection from reactive oxygen species(Reference Keck and Finley4).
In South Korea, vegetable consumption is recommended as ≥2 servings (approximately 140 g) per meal, according to the Food Balance Wheels from the 2015 Dietary Reference Intakes for Koreans(5). Since the 1970s, South Korea has undergone a rapid economic and sociodemographic transition with changes in dietary patterns(Reference Kim, Moon and Popkin6). Previously, per capita vegetable consumption was reported as 271 g/d in 1969 and 286 g/d in 2009(Reference Lee, Duffey and Popkin7).
In the USA, recommendations for vegetables are from 1 to 3 cups daily and vegetable intake per capita has remained steady from 2001 to 2014, at approximately 1·5 cups/d(Reference Conrad, Chui and Jahns8,9) . According to the FAO of the UN, annual per capita consumption of vegetables was 118·37 kg in 1998 and 113·96 kg in 2013 in the USA, and 210·13 and 205·89 kg, respectively, in South Korea(10). Among Asian countries, intake in China was 180·11 kg in 1998 and 347·83 kg in 2013, and 110·26 and 102·29 kg in Japan, respectively. In European countries, values were considerably lower than South Korea between 1998 and 2013. In Germany and the UK, consumption was 84·10 and 92·91 kg, and 88·33 and 96·99 kg, for the respective time periods(10).
The goal of the present study is to investigate changes in the amount of total vegetable intake by preparation method and eating location over time from 1998 to 2017 for a representative Korean population.
Methods
Study design
This study was completed using the Korea National Health and Nutrition Examination Survey (KNHANES), a cross-sectional survey by the Korea Centers for Disease Control and Prevention(11). This survey was established to monitor the health and nutrition status of the country on a periodic basis. KNHANES includes a health interview regarding socio-economic information, smoking status and drinking behaviour; a health examination survey including anthropometrical, biochemical and clinical information; and a nutrition survey such as a 24-h dietary recall and FFQ. The first KNHANES data were surveyed in 1998 and then repeated in 2001 and 2005 during 2- or 3-month periods each year. In 2007, the data collection was changed to an annual basis throughout the year to improve time efficiency for distribution of the information in Korea and to decrease seasonal variations. This alternative method caused the sample size to be smaller for each year from 2007 than it was in 1998, 2001 and 2005. Thus, as guided by the Korea Centers for Disease Control and Prevention, KNHANES data sets were grouped as 3 years for one set starting from 2007; the latest report is 2017 KNHANES. This research assessed all existing KNHANES data sets from 1998 to 2017; KNHANES I (1998), KNHANES II (2001), KNHANES III (2005), KNHANES IV (2007–2009), KNHANES V (2010–2012), KNHANES VI (2013–2015) and KNHANES VII (2016–2017). Those who participated in the survey were offered written informed consent, and the Korea Centers for Disease Control and Prevention Institutional Review Board monitored the survey protocol in Korea from 2007 to 2015. However, the Institutional Review Board process has not been required since 2016 by law, as the survey was conducted by the government for the public welfare in Korea.
Research sample
All participants in this research were ≥1 years old who completed a 24-h dietary recall survey. Data were extracted from 109 220 individuals, including 49 069 men and 60 151 women, from 1998 to 2017. Participants were 10 400 in KNHANES I, 9968 in KNHANES II, 8930 in KNHANES III, 22 113 in KNHANES IV, 22 931 in KNHANES V, 20 671 in KNHANES VI and 14 207 in KNHANES VII. The Korean population was divided into eight age groups: 1–9, 10–18, 19–29, 30–39, 40–49, 50–59, 60–69 and ≥70 years.
Evaluation of vegetable intake by preparation method and eating locations
A 24-h dietary recall analysis was completed, utilising the 1998–2017 data set. Diet surveys were conducted by trained dietitians via in-person interviews at home. Young children had a proxy (guardian) that helped to record(12). Consumption information for the past 24 h was obtained, including type, quantities, volume, weight, brand name and cooking method of each food and ingredient. Vegetable intake was categorised into six groups based on typical preparation methods in Korea: raw, steamed, stir-fried, fried, salted vegetables and other. The sum of all six categories represented the total vegetable intake for each year. All possible vegetables included leafy, cruciferous, root, allium, marrow and stem vegetables. Selection of vegetables and categorisation were determined by reviewing each food item code. These codes were utilised for analyses for each year from 1998 to 2017. The categorisations considered both the food item itself and food groups; information from recipes was included in the data sets. For example, if spinach was consumed in uncooked dishes such as a salad, it was grouped as a raw vegetable. However, if spinach was used for stir-fried dishes, it was classified as a stir-fried vegetable. Salted vegetables consisted of both pickled and fermented versions. In addition, salted vegetables included processed and preserved vegetables such as those stored in cans. Other vegetables were composed of powder, paste and artificial vegetable beverages such as tomato juice. Pure vegetable juices were considered as raw vegetables. Dried vegetables were divided into different preparation methods based on recipes by food group information provided by KNHANES. For example, if a dried vegetable was prepared via stir-frying or steaming, then it was categorised by the method of cooking, that is, stir-fried or steamed, respectively.
Eating locations were divided into three representative places where the Korean population commonly eats food: (1) the home, (2) restaurants or outside the home and (3) school or work. Food consumed in the home were composed of home-cooked meals or a lunch box prepared at home; food consumed in restaurants or outside the home included delivery foods or a lunch box from outside stores; food service in school or work was included as well.
Statistical analysis
All statistical processes were performed with PROC SURVEY on SAS software version 9.4 (SAS Institute). Results were described as mean values with their standard errors for continuous variables (age, income, vegetable intake by preparation method and vegetable consumption from different eating locations) and as percentages with their standard errors for categorical variables (age groups and education). Means were illustrated as crude means and age-standardised means. Multivariate linear regression was performed for continuous variables, and logistic regression was completed for categorical variables to obtain P values for trend to show increase or decrease trends from 1998 to 2017. To identify changes in trends, the multivariate linear regression was performed, for example, with averages of total vegetable intake as the dependent variable and the midpoint of each yearly KNHANES set (I–VII, respectively) as the independent variable. The P for trends were defined as the significance of the regression coefficients to test the slope of the regression of 0 as a null hypothesis. Age-standardised means were calculated based on the 2005 Korea census. The P for trends of the standardised means were obtained with controlling by age. All analyses were completed with strata, cluster and sampling weight values for each year. To construct sampling weights that were representative of the Korean population, information on the inverse of selection probabilities, non-response rate and post-stratification were utilised, with adjusting demographic data on sex and age(Reference Kweon, Kim and Jang13). Statistical significance was defined as two-sided P for trends ≤0·05.
Results
Demographic characteristics
The characteristics of the participants are described in Table 1. Mean age of the total sample significantly increased over time, from 32·2 years in 1998 to 40·6 years in 2016–2017 (P for trends < 0·001). Furthermore, the portion of younger age groups, 1–9, 10–18, 19–29 and 30–39 years (P for trends < 0·001, respectively), declined. In contrast, there was an increase for older age groups, 40–49, 50–59, 60–69 and ≥70 years (P for trends < 0·001, respectively). Participants who attended ≤middle school and high school diminished (P for trends < 0·001), while those with ≥college education escalated (P for trends < 0·001). Moreover, household monthly income increased more than three times over time (P for trends < 0·001).
Table 1. Trends in demographic characteristics of participants during 20 years from 1998 to 2017 for the Korean population according to the Korea National Health and Nutrition Examination Survey (KNHANES)
(Mean values with their standard errors; percentages with their standard errors)

* P for trends calculated by multivariate linear regression or logistic regression.
† Age-standardised based on the 2005 Korea census, and P for trends adjusting for age.
‡ Age-standardised household monthly income in Korean won (approximately 1215 Korean won equal to 1 USA dollar), and P for trends adjusting for age.
Trends in vegetable intake by preparation method
The results of trends in vegetable intake by different preparation methods are presented in Table 2. First, the age-standardised mean for total daily vegetable intake significantly decreased over time from 289·1 g in 1998 to 270·3 g in 2016–2017 (P for trends < 0·001). For adolescents and younger adults of 10–18, 19–29, 30–39 and 40–49 years, vegetable consumption decreased (14·0, 21·8, 13·1 and 6·5 %, respectively), and for older adults, aged 50–59 and 60–69 years, intake escalated (7·1 and 15·9 %, respectively).
Table 2. Trends in daily vegetable intake by preparation method for the Korean population during 20 years from 1998 to 2017 according to the Korea National Health and Nutrition Examination Survey (KNHANES)
(Mean values with their standard errors)
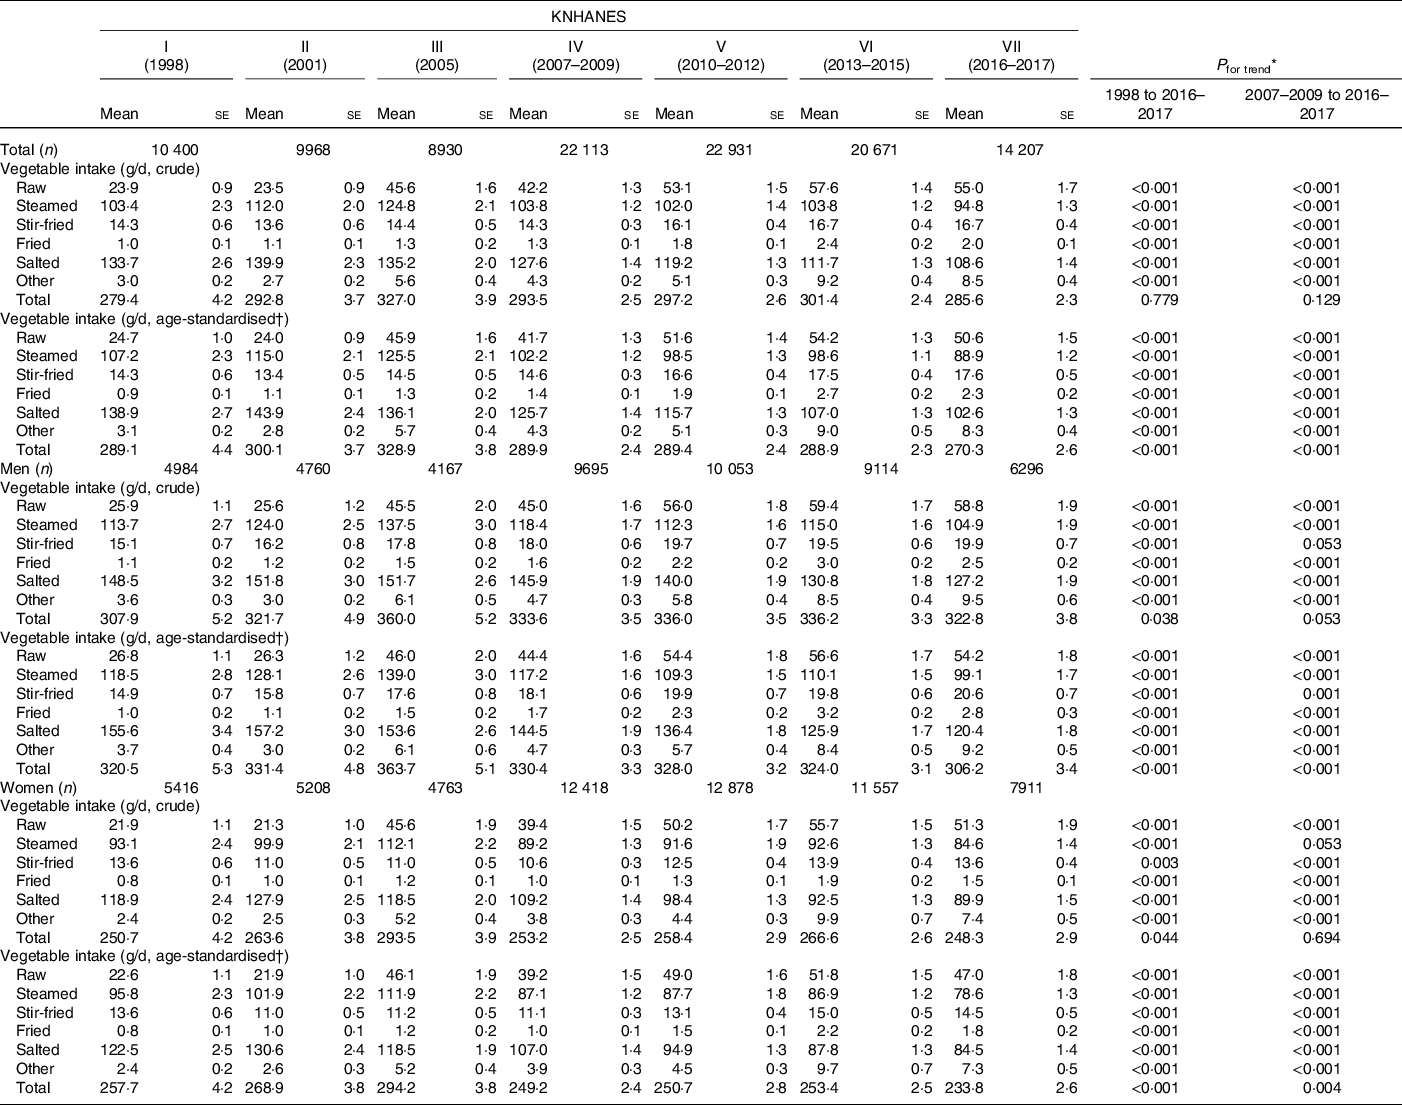
* P for trends calculated by multivariate linear regression.
† Age was standardised based on the 2005 Korean census, and P for trends adjusting for age.
For the same time period, participants consumed more than double the raw vegetables, 24·7–50·6 g (P for trends < 0·001). This increase occurred in all age groups, as illustrated in Fig. 1, with older groups consuming more raw vegetables. The increase in raw vegetable intake from 8·5 to 18·8 % of the total vegetable intake is shown in Fig. 2. In contrast, steamed vegetable consumption declined from 107·2 to 88·9 g (P for trends < 0·001) and stir-fried vegetable intake rose slightly, from 14·3 to 17·6 g (P for trends < 0·001).
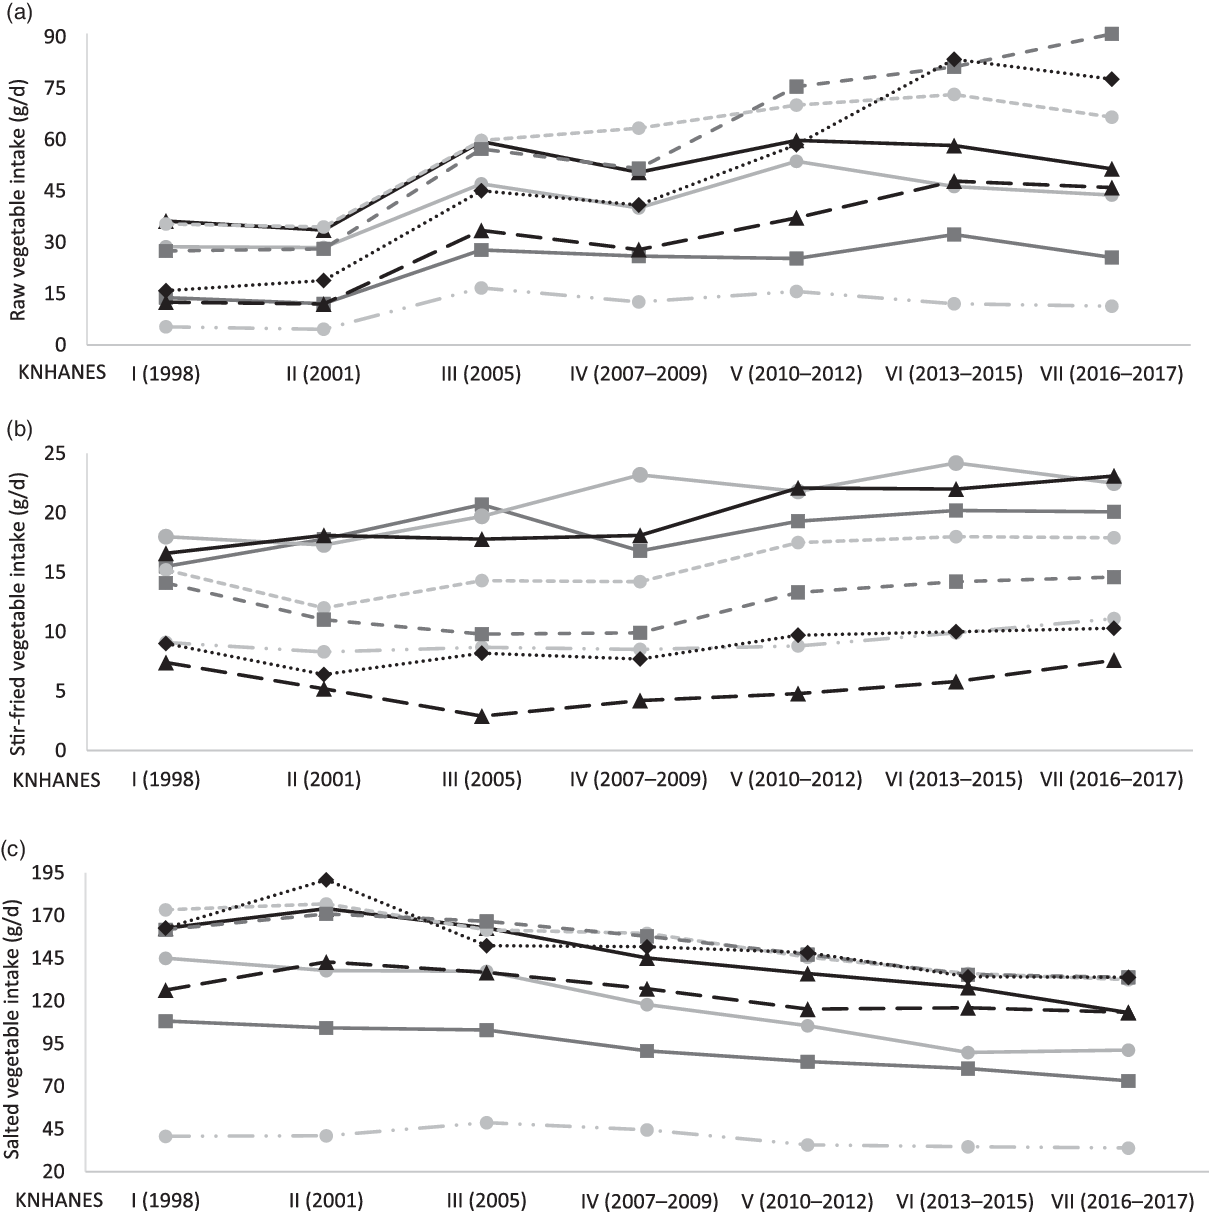
Fig. 1. Trends in vegetable intake by age based on preparation method: (a) raw, (b) stir-fried and (c) salted, for the Korean population according to the Korea National Health and Nutrition Examination Survey (KNHANES). Age (years): ![]() , 1–9;
, 1–9; ![]() , 10–18;
, 10–18; ![]() , 19–29;
, 19–29; ![]() , 30–39;
, 30–39; ![]() , 40–49;
, 40–49; ![]() , 50–59;
, 50–59; ![]() , 60–69;
, 60–69; ![]() , ≥70.
, ≥70.
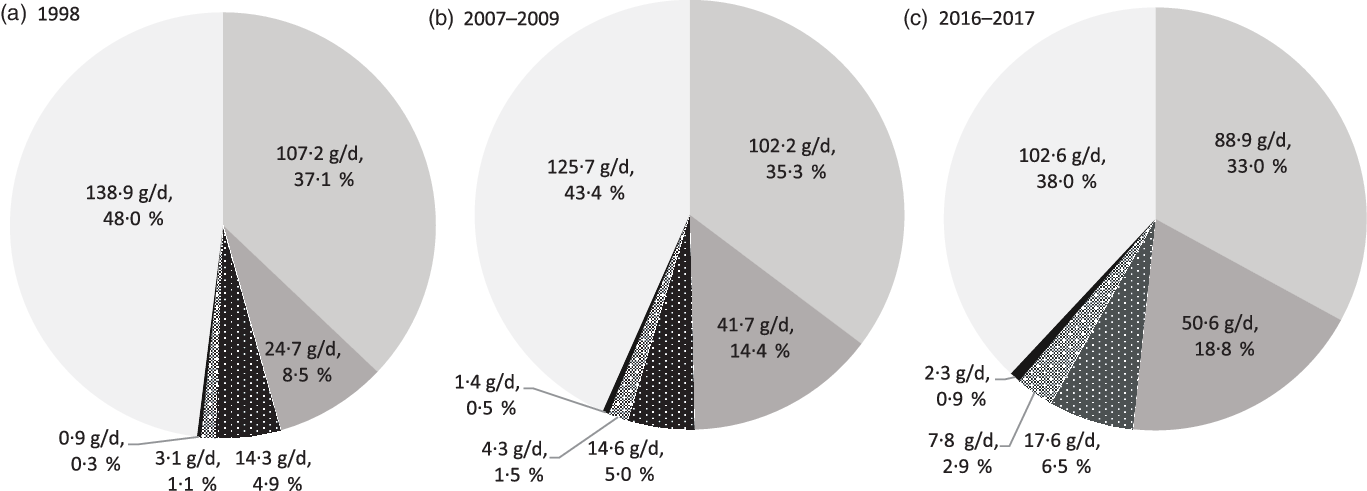
Fig. 2. Changes in age-standardised vegetable intake by preparation method over time for the Korean population according to the Korea National Health and Nutrition Examination Survey (KNHANES). ![]() , Salted;
, Salted; ![]() , steamed;
, steamed; ![]() , raw;
, raw; ![]() , stir-fried;
, stir-fried; ![]() , other;
, other; ![]() , fried.
, fried.
Individuals ingested more fried vegetables over time; however, the intake amount was relatively small compared with the other types of preparation methods. The increase was approximately 2·5 times from 0·9 g in 1998 to 2·3 g in 2016–2017 (P for trends < 0·001). Interestingly, salted vegetable intake diminished from 138·9 to 102·6 g (P for trends < 0·001) which consisted of a change from 48·0 to 38·0 % of the total vegetables over time. Finally, each age group consumed significantly less salted vegetables over time.
Moreover, total vegetable intake significantly differed according to education (P < 0·001) and income (P < 0·001), using the data from 2015 to 2017 in the present research (data not shown). Participants with some college education consumed 327·9 g of vegetables; this value was greater than those with a high school education, 307·3 g, followed by those with ≤a middle school education 244·4 g. In addition, the highest amount of vegetable consumption was among those in the high-income group (303·9 g), as compared with middle-high, middle-low and low-income groups (290·9, 289·5, and 273·0 g, respectively). In the 2017 KNHANES, the three vegetables consumed the most in each vegetable category in consecutive order were: raw – tomato, lettuce and cucumber; steamed – radish, onion and young pumpkin; stir-fried – onion, cabbage and welsh onion; fried – onion, lotus roots and hot pepper; and salted – Chinese cabbage kimchi, young leafy radish kimchi and cubed radish roots kimchi.
Trends in vegetable intake by preparation method and eating location
The trends in vegetable consumption according to eating locations are shown in Table 3. The total vegetable intake at home decreased from 210·4 g in 1998 to 136·6 g in 2016–2017 (P for trends < 0·001). Participants ate more vegetables at restaurants or outside over time, from 58·8 to 99·8 g (P for trends < 0·001). Nonetheless, the total vegetable intake at school or work remained steady over the same period (P for trends = 0·769). Consumption at school or work was the least, as compared with the home, restaurants or outside.
Table 3. Trends in daily vegetable intake from different eating places based on preparation method for the Korean population during 20 years from 1998 to 2017 according to the Korea National Health and Nutrition Examination Survey (KNHANES)
(Mean values with their standard errors)
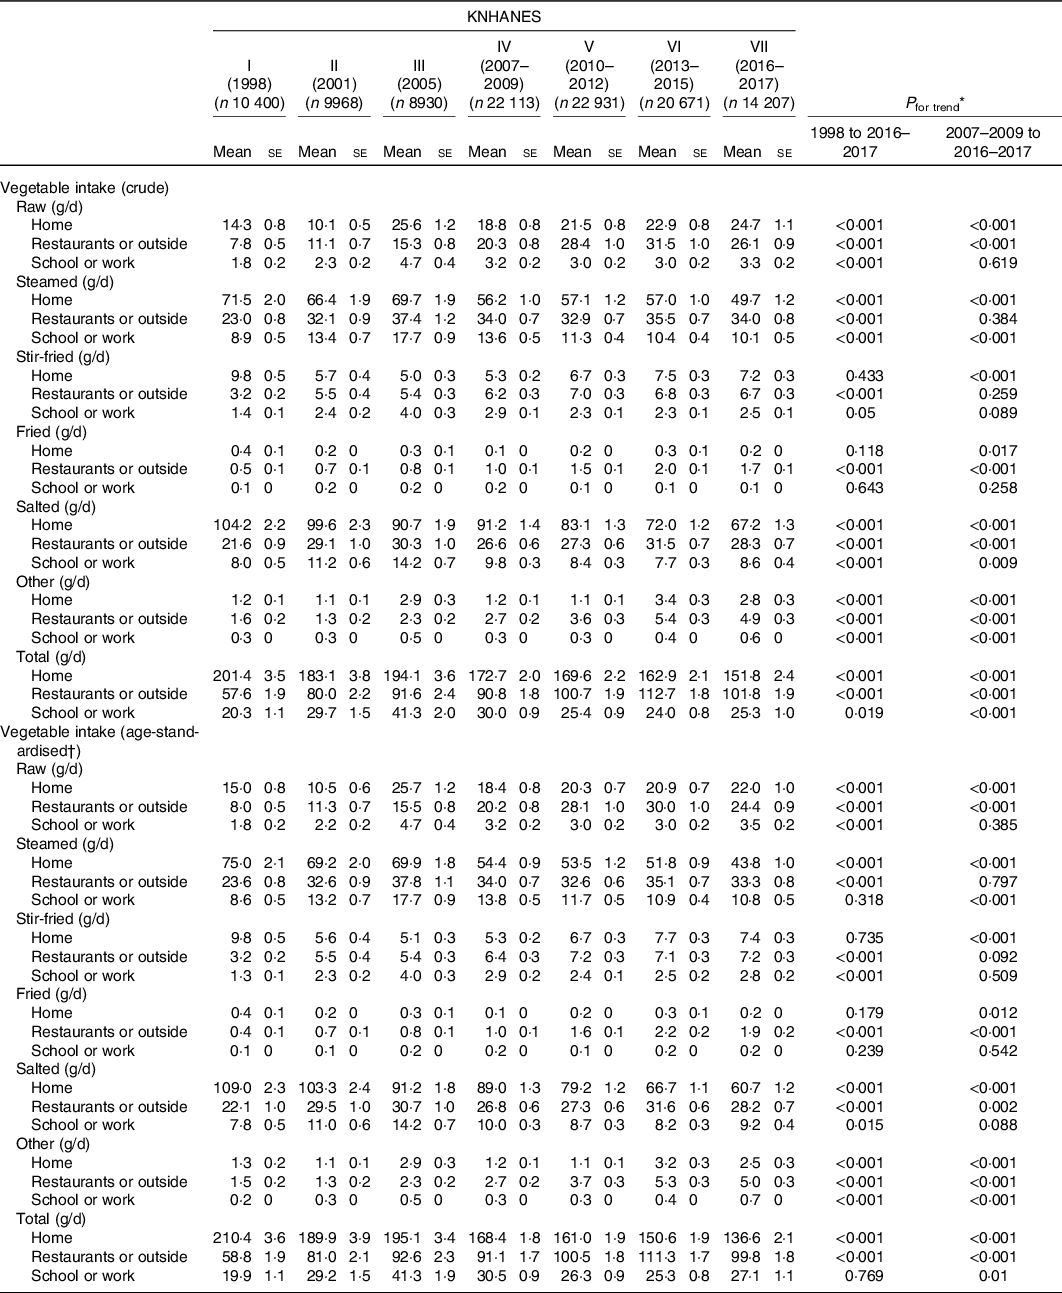
* P for trends calculated by multivariate linear regression.
† Age was standardised based on the 2005 Korean census, and P for trends adjusting for age.
Raw vegetable intake at all three places: home, restaurants or outside, and school or work, greatly increased over time. Raw vegetable intake at restaurants or outside escalated more than three times from 8·0 to 24·4 g (P for trends < 0·001), and at school or work, approximately two times (P for trends < 0·001). The sample ate more raw vegetables at home than at restaurants or outside in 1998. Throughout the duration of the study, more raw vegetables were consumed at restaurants or outside than at home.
Steamed vegetables were eaten the most at home over time (from 70·7 to 49·8 %), followed by restaurants or outside (from 22·0 to 37·9 %) and school or work (from 8·0 to 12·3 %). Although steamed vegetable consumption at restaurants or outside increased (P for trends < 0·001), intake at home significantly declined (P for trends < 0·001). However, steamed vegetable intake at school or work did not change (P for trends = 0·318).
Stir-fried and fried vegetables ingested at home were consistent over time. Yet, both vegetable intake at restaurants or outside increased considerably, more than double for stir-fried (P for trends < 0·001). It was more than four times for fried vegetables (P for trends < 0·001), but the fried vegetables consisted of only small quantities (from 0·4 to 1·9 g) and were less than other preparation methods. Unlike fried vegetables at school or work (which did not change significantly (P for trends = 0·239)), stir-fried vegetables increased more than two-fold (P for trends < 0·001).
Salted vegetable intake was the highest at home, followed by at restaurants or outside, then school or work. Notably, salted vegetable intake greatly decreased from 109·0 g in 1998 to 60·7 g in 2016–2017 (P for trends < 0·001). Although this degree of change was not comparable with consumption at home, salted vegetable intake escalated over time at restaurants or outside (P for trends < 0·001) and school or work (P for trends = 0·015). Finally, consumption declined 44·3 % at home, with an increase of 27·6 and 17·9 % at restaurants or outside and school or work, respectively.
Discussion
The traditional Korean diet is considered generally to be healthy, as it contains a great variety and quantity of vegetables(Reference Lee, Popkin and Kim14). Intake for adults (≥19 years) in 2009–2010 was above recommended amounts, but for those <19 years, the suggested servings of vegetables were not met(Reference Song, Jung and Shim15). The present research observed that total daily vegetable consumption has decreased over 20 years, from 1998 to 2017. One possibility is that this decline could be due to an ongoing shift in Korea to a more westernised diet(Reference Kim, Moon and Popkin6). Yet, the amount of decline was not large (6·5 %), and vegetables remain an important component of the Korean diet. In comparison, vegetable intake for adults decreased in the USA in the 1988–2002 time period(Reference Casagrande, Wang and Anderson16), as well as in Hong Kong from 2004 to 2016 (for ages 45–64 years old)(Reference Yip, Yip and Chan17). However, the decrease from 289·1 to 270·3 g/d in Korea is still greater in this research than the ≥240 g/d estimated globally(Reference Kalmpourtzidou, Eilander and Talsma18).
The most striking finding of this research is the large increase in raw vegetable consumption at the different locations over time. This escalation may be due, in part, to a greater awareness of the beneficial aspects of eating raw vegetables, as it is known that cooking vegetables can destroy critical nutrients. For example, the concentration of ascorbic acid, folic acid and Mg in a tomato is significantly diminished during cooking(Reference Alvi, Khan and Sheikh19). Furthermore, the amount of ascorbic acid in raw broccoli, spinach and lettuce is greater than that found in cooked vegetables, particularly in methods of steaming or microwaving(Reference Zeng20). The consumption of raw vegetables is critical for optimal health. For example, raw vegetable intake was related to reduced risk of bladder cancer in the USA; presumably, this is due to isothiocyanates that exhibit chemo-preventive characteristics(Reference Tang, Zirpoli and Guru21).
A second key trend observed is that consumption of vegetables at restaurants or outside the home increased dramatically (70·0 %). This trend mirrors overall changes in the rate of eating out ≥1 time/d in South Korea, which has increased significantly from 32·1 % in 2007 to 41·0 % in 2017 for men, and 16·0–23·8 % for women(22). Also, 21·7 % of participants ≥19 years consumed market-purchased food staples once per day from 2010 to 2014, according to KNHANES. The use of these market-purchased meals in the diet was even higher in younger adults, especially 19–29 and 30–49 years(Reference Han23). Frequent intake of food outside of the home has been reported to be linked to decreased fruit and vegetable consumption(Reference Seguin, Aggarwal and Vermeylen24). One pertinent life style factor is that average working hours per week in Korea were 48·0 h for men and 44·6 h for women in 2014(Reference Park, Kim and Han25). These long working hours of both men and women may lead workers to seek greater convenience in eating food outside of the home.
Stir-frying is a common method of cooking in Korea, and stir-fried vegetable intake has steadily increased over time. This rise corresponds to greater amounts ingested in restaurants or outside of the home, as well as school or work. Yet, stir-fried vegetable consumption at home did not change. In addition, the increase of eating fried vegetables at restaurants or outside of the home was unexpectedly high, more than four times over the 20 years observed. This trend might be related to the higher prevalence of street foods and eating out, as well as the inclusion of westernised foods in the South Korean diet.
The significant decline of salted vegetable intake may be related to a greater awareness of possible adverse health conditions associated with Na in Korea(Reference Kim, Freeland-Graves and Kim26). Salted vegetables still account for the highest proportion of dietary vegetables, as fermented foods such as kimchi remain a critical component of the diet. Over time, daily Na intake and Na consumption from fermented foods by South Koreans have significantly decreased, 15·4 % in men and 27·7 % in women, and 39·5 % in men and 47·5 % in women, respectively, from 1998 to 2016(Reference Kim, Freeland-Graves and Kim26). In Korea, fermented foods are regarded as healthy foods, especially, kimchi because of its probiotic and anticancer effects(Reference Patra, Das and Paramithiotis27).
Processed vegetables, including pickled foods, are a significant part of the Korean diet. Public health concerns are that Na of pickled vegetables might elevate the risk of cancers, such as gastric and breast(Reference Kim, Lim and Lee28,Reference Yu, Hwang and Ro29) . Also, higher Na intake, particularly with lower energy, has been established to be positively associated with higher blood pressure(Reference Murtaugh, Beasley and Appel30). It is plausible that continuing public health education efforts in South Korea regarding the risks of high dietary Na has contributed to the decline in salted vegetables at home.
The decreased dietary vegetables of both adolescents and younger adults may be influenced by the prevalence of westernised foods. Western diets are known to be high in fat and processed foods, with fewer vegetables. In contrast, the increased vegetable intake for older adults could be related to continuance of their traditional diets.
One recent purchase trend in South Korea has been prepared foods sold in smaller packages (including kimchi). Also, there has been a large increase in online food shopping, and a stronger emphasis on selecting foods for quality, rather than just price(Reference Kim31). Vegetables are consumed daily as food staples in Korea, and it is believed that consuming a wide variety and quantity of vegetables is important for nutrient density and health. Perhaps, restaurants and take-out establishments have become more cognizant regarding nutritious foods and added more vegetables as healthier menu choices due to consumer demand.
This present study is the first to examine vegetable intake grouped by different types of preparation methods based on the South Korean population via analysis of a 24-h dietary recall. A strength is that all existing KNHANES data currently available were utilised to maximise information to investigate the trends. Also, the results represent the Korean population since a sampling weight of each participant provided by KNHANES was used in all analyses for this research. Limitations are that the method used, the 24-h dietary recall, cannot always explain usual intakes of individuals. Yet, this method provides an estimate of the actual amount of intake for each food item, and interviewers were trained in the method. It is possible that recall bias might have occurred during the survey since it relied on the memory of each participant (which could have been a problem in older subjects). This would have resulted in misreporting or providing inaccurate data on the quantity of food consumed. Finally, the change in the survey systems starting from 2007 could be a shortcoming, such that, the P for trends were divided into two time periods, 1998 to 2017 and 2007–2009 to 2017.
Conclusion
This study assessed trends in common preparation methods and eating locations of vegetables in South Korea over time. Overall, vegetable intake decreased, while consumption of raw vegetables increased considerably, and salted vegetable intake declined. In sum, these changes may be representative of the overall shift in nutritional habits among Koreans that has occurred due to changing socio-economic conditions, consumption habits and a stronger emphasis on eating healthy, high-quality foods. It is conceivable that preparation methods for vegetables may be just as important for good health as total quantity. However, research on this topic is scarce. Future studies could explore vegetable intake according to location and how the method used for cooking vegetables is associated with variables such as diet quality or disease status.
Acknowledgements
This research received no specific grant from any funding agency, commercial or not-for-profit sectors.
All authors contributed to the design and implementation of the research. J. H. F.-G. supervised the work overall, and S. Y. K. and H. J. K. analysed the data. Also, S. Y. K. and J. H. F.-G. co-authored the manuscript. All authors discussed the results and reviewed and commented on subsequent drafts of the manuscript. All authors provided critical feedback and helped shape the research.
There are no conflicts of interest.


