


Vitamin D is a secosteroid hormone(Reference Verstuyf, Carmeliet and Bouillon1) with the essential role of maintaining Ca and phosphorus homoeostasis to support bone metabolism(Reference Bellavia, Costa and De Luca2). Furthermore, vitamin D also has important functions in the intestine(Reference Christakos, Dhawan and Porta3), kidney(Reference Li, Zheng and Li4), brain(Reference Anjum, Jaffery and Fayyaz5), lung(Reference Kiani, Abedini and Adcock6) and immune system(Reference Baeke, Korf and Overbergh7), due to the widespread distribution of the vitamin D receptor(Reference Holick8).
Vitamin D deficiency is becoming more common in developed countries, with 30–40 % of the general population in the UK being classed as vitamin D deficient during the winter(9). Currently, vitamin D sufficiency is classified as plasma 25(OH)D levels at 50–125 nmol/l, vitamin D insufficiency at 25–50 nmol/l and vitamin D deficiency at below 25 nmol/l(10). Vitamin D deficiency is the most common cause of rickets with hospitalisation in England at its highest in five decades(Reference Goldacre, Hall and Yeates11).
In 2016, the Scientific Advisory Committee on Nutrition proposed a reference nutrient intake for vitamin D of 10 µg/d (400 IU) in adults over 4 years old in the UK (including pregnant and lactating women)(10). The National Diet and Nutrition Survey (NDNS) Rolling Programme shows children between the ages of 4 and 18 have a mean vitamin D intake of 2 µg/d, and adults between the ages of 18–64 have a mean vitamin D intake of 2·7 µg/d(9). This alarmingly equates to only 20 and 27 % of the reference nutrient intake, respectively.
In humans, vitamin D can be sourced endogenously from sunlight and exogenously from dietary sources. Availability of UVB radiation affects skin synthesis of vitamin D(Reference Webb and Engelsen12); therefore, during the winter months in the UK, the availability of UVB sunlight is not sufficient to synthesise biologically relevant quantities of vitamin D(Reference Webb, Kline and Holick13,Reference Webb, DeCosta and Holick14) . Therefore, vitamin D synthesis is reliant on dietary sources with the main dietary sources being fish, eggs, meat and fortified foods(Reference McCance and Widdowson15).
Health and disease are intricately linked to diet and nutrition; therefore, assessing food intake is crucial(Reference Adamson and Mathers16). There are many methods available, including weighed and non-weighed food diaries, 24-h recalls and FFQ(Reference Dao, Subar and Warthon-Medina17). The gold standard recommendation is the weighed food record, which has the benefit of not relying on memory to record foods eaten. However, completion of such records is time-consuming, labour-intense and relies on participant motivation and written capabilities. A FFQ is designed to capture habitual food intake with a lower burden on the participant due to removal of the need to weigh or record food at the time of intake. Validation of a FFQ requires comparison of nutrient biomarkers with another method of dietary assessment to determine reliability of the FFQ(Reference Weir, Carson and Mulhern18,Reference Fallaize, Forster and Macready19) .
Although there have been previous vitamin D FFQ validation studies(Reference Weir, Carson and Mulhern18,Reference Taylor, Lamparello and Kruczek20-Reference Ganji, Abu-Dbaa and Othman22) , these have been carried out in countries including Northern Ireland, the USA, Canada and Qatar. The dietary habits of those populations are likely to differ from those of English participants. Therefore, the present questionnaire is the first to be validated in England.
The aim of the present study was to develop and validate a rapid vitamin D FFQ that can be used to accurately estimate vitamin D intake in adults in England, UK.
Experimental methods
Study sample
Fifty participants aged 18–64 years were recruited from the University of Chester (excluding students or academic staff in the Department of Clinical Sciences and Nutrition) and surrounding areas, Northern England, UK. The final study population included both students and non-students. A pre-test questionnaire was used to assess eligibility for the study. Those that had been on a sun holiday in the month previous to taking part in the study or during the study, those that use sun beds and those using medications were excluded from participation in the study.
Study design
Participants were randomly allocated to receive either the FFQ or a four-day food diary (4 d-FD) followed by a 30-d interval before completing the alternative method of dietary assessment (Fig. 1). All participants completed both methods of dietary assessment during the months of November–April. Participants were asked not to change their diet during the study. For the FFQ and 4 d-FD, both food sources and supplemental vitamin D were included in total vitamin D intakes.
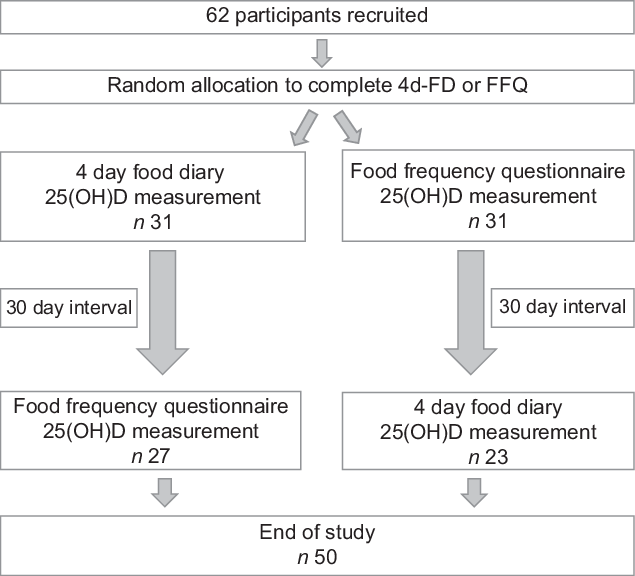
Fig. 1 Flow chart of the study protocol
Four-day food diary
Participants were provided with a 4 d-FD and asked to record all food and drinks consumed on three weekdays and one weekend day. Before completing the 4 d-FD, participants were provided with guidance on recording food and drink consumed along with portion sizes. Diet information obtained from the 4 d-FD was analysed using Nutritics dietary analysis software (Research Edition, v5.096, Dublin, Nutritics, 2019) to give an average vitamin D intake (µg/d).
Food frequency questionnaire
The FFQ (see Supplementary Material) was designed using information from McCance and Widdowson’s, ‘The composition of Foods’(Reference McCance and Widdowson15) and ‘Food Portion Sizes’(Reference Crawley, Mills and Patel23). Foods were grouped into sections within the questionnaire along with portion sizes. Frequency of consumption was measured using the following options: never/less than monthly, monthly, 1/week, 2/week, 3/week, 4–5/week, daily or 2/d. Participants were asked to indicate which frequency of consumption best fit each food according to their habitual dietary habits. Vitamin D intake (µg/d) was calculated by multiplying frequency of consumption by the amount of vitamin D in the specified portion size of each food.
Biomarker analysis
Before filling out both the 4 d-FD and FFQ, a fingerprick blood test was performed on all participants. Blood was collected into a blood collection tube treated with EDTA. Blood samples were centrifuged at 2680 × g for 10 min at 4˚C. The plasma was removed and stored at –80˚C. Concentrations of total 25(OH)D (D2 and D3) were analysed by an automated immunoanalyser (VIDAS®; Biomérieux) using the enzyme-linked fluorescent assay technique. Quality and accuracy of the method were monitored by participation in the Vitamin D External Quality Assessment Scheme, with intra- and inter-assay CV of 2·0 and 7·3 %, respectively. If samples were outside the range of detection (vitamin D concentration < 20·3 nmol/l) they were analysed by ELISA (ELISA; Calbiotech VD220B). The intra- and inter-assay CV for this ELISA is 11·3 and 3·6 %, respectively.
Sample size and statistical analysis
Sample sizes for validation studies are wide ranging from 3 to 3750 with a median of 110. A previous vitamin D FFQ validation study used a sample size of 50(Reference Weir, Carson and Mulhern18). For use of Bland–Altman method, the size of at least 50 is preferable to allow a large enough sample size to allow the limits of agreement to be estimated(Reference Cade, Thompson and Burley24). When using biomarkers as validation for FFQ, the gold standard is fifty participants(Reference Serra-Majem, Andersen and Henríque-Sánchez25); therefore, sixty-two participants were recruited to account for dropouts leading to a final number of fifty. A post hoc power calculation using G Power (3·1) based on the results of the present study with an effect size of 0·6 indicates a sample size of 25 is required for 95 % power (α = 0·05).
Statistical analysis was carried out using IBM SPSS version 26. Statistical significance was accepted at P < 0·05. Data were not normally distributed; therefore, nonparametric tests were used throughout. Mean plasma 25(OH)D concentrations were compared using Mann–Whitney tests. A Bland–Altman plot(Reference Bland and Altman26) provides a visual representation of the agreement between the FFQ and 4 d-FD. Spearman’s correlation coefficients were calculated between the FFQ, 4 d-FD and plasma 25(OH)D concentration.
Results
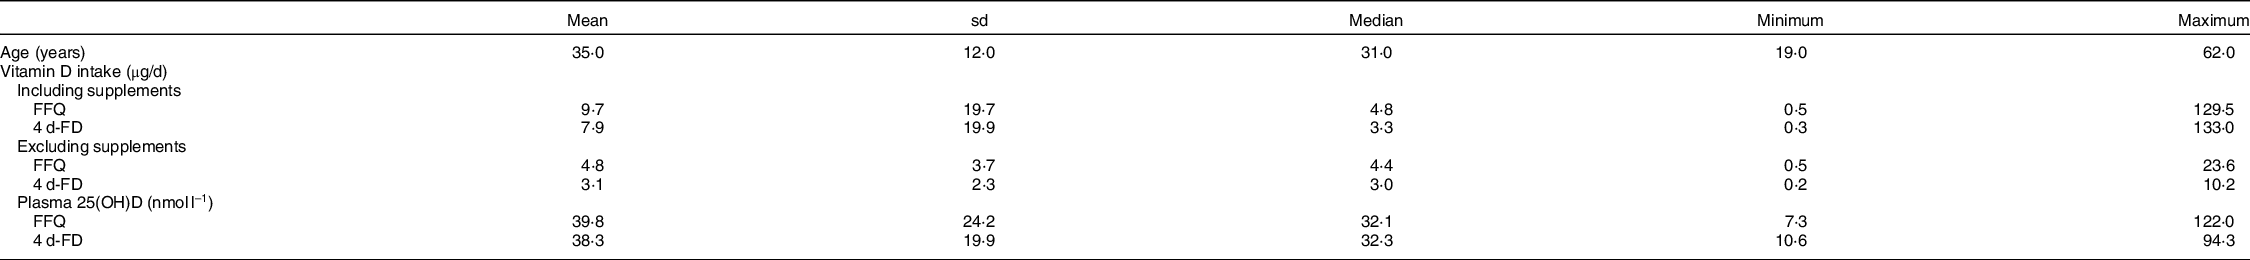
A total of sixty-two participants were recruited to the study with twelve dropouts resulting in a final sample number of fifty participants included in the analysis. General participant characteristics are detailed in Table 1; there was no significant difference in mean (sd) age between male and female participants (male; 31 ± 8 years, n 16, female; 37 ± 13 years, n 34, P = 0·212). There was no significant difference in plasma 25(OH)D concentration before the FFQ or 4 d-FD (FFQ; 39·8 ± 24·2 nmol/l, 4 d-FD; 38·3 ± 19·9 nmol/l, P = 0·668). Using the thresholds described by Scientific Advisory Committee on Nutrition(10), in the present study, twelve participants (24 %) were classed as vitamin D sufficient (50–125 nmol/l); twenty-five participants (50 %) were vitamin D insufficient (25–50 nmol/l) and thirteen participants (26 %) were vitamin D deficient (below 25 nmol/l).
Table 1 Participant characteristics (n 50)
FFQ v. four-day food diary
As shown in Table 2, a strong, significant correlation was observed between vitamin D intake recorded by the FFQ and the 4 d-FD (r = 0·609, n 50, P < 0·0001). When split by gender, there was a significant correlation between vitamin D intake recorded by the FFQ and 4 d-FD in males (r = 0·727, n 16, P = 0·001) and females (r = 0·538, n 34, P = 0·001).
Table 2 Summary of correlations for vitamin D intake recorded by the FFQ and 4 d-FD and plasma 25(OH)D and vitamin D intake

* Significance accepted at P < 0·05.
The Bland–Altman plot (Fig. 2) shows the difference in vitamin D intakes between the FFQ and 4 d-FD plotted against the mean, including 95 % limits of agreement (1·96 sd) of the mean difference. All but one of the differences fell within the limits of agreement. The mean (sd) difference between the 4 d-FD and FFQ was –1·8 (sd 3·8) (Fig. 2).
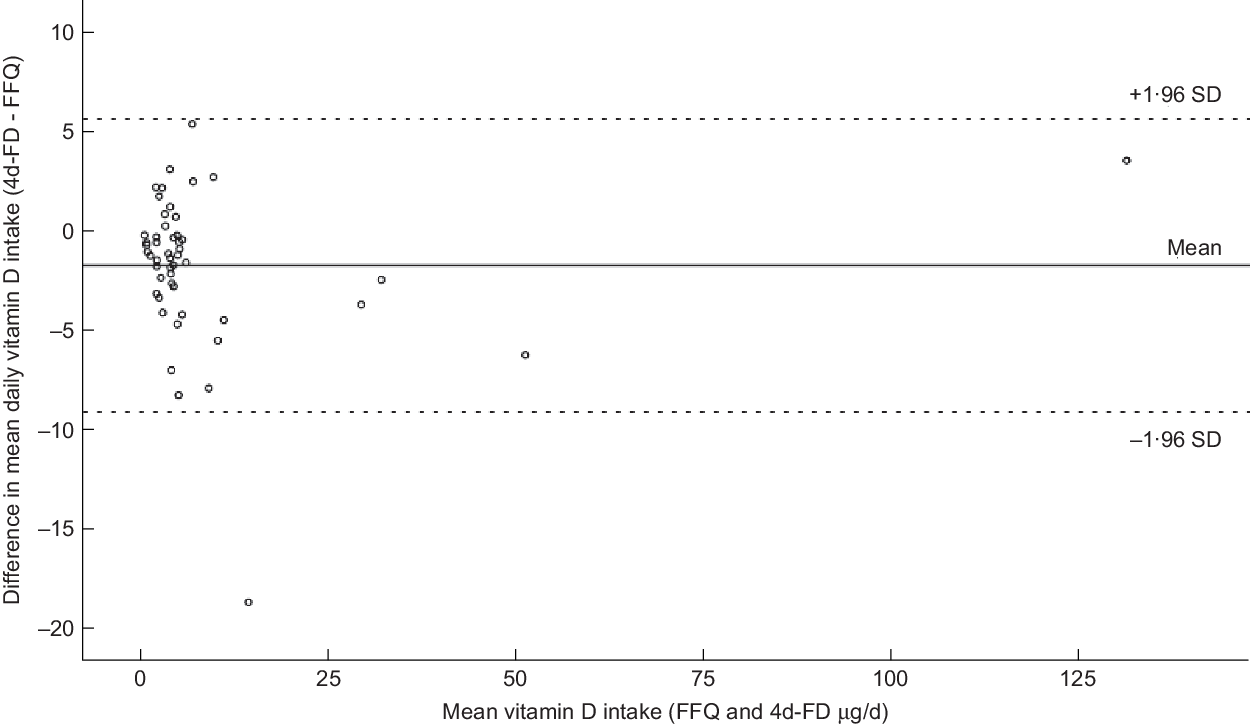
Fig. 2 Bland–Altman plot showing the difference in mean daily vitamin D intake between the four-day food diary (4 d-FD) and FFQ. The solid line represents the mean difference in daily vitamin D intake (–1·8 µg/d), the dashed lines show the 95 % limits of agreement (1·96 sd)
FFQ and four-day food diary v. 25(OH)D concentration
Additionally, a significant correlation was observed between plasma 25(OH)D concentrations and vitamin D intake measured by the FFQ (r = 0·290, n 50, P = 0·041) and the 4 d-FD (r = 0·360, n 50, P = 0·01).
The mean dietary intake of vitamin D recorded by the FFQ and 4 d-FD was 17·3 and 16·0 µg/d for males including supplements and 4·4 and 3·6 µg/d excluding supplements. For females mean dietary intake of vitamin D recorded by the FFQ and 4 d-FD was 6·1 and 4·1 µg/d including supplements and 4·96 and 2·9 µg/d excluding supplements. There was no significant difference in dietary intake of vitamin D between males and females when measured by the FFQ (P = 0·603) and 4 d-FD (P = 0·442).
Discussion
The aim of the present study was to develop and validate a FFQ to determine dietary intakes of vitamin D in healthy adults in England, UK. The significant correlation strongly suggests that this FFQ is an accurate tool to assess individual vitamin D dietary intakes. Furthermore, to our knowledge this is the first vitamin D FFQ to be validated based upon the diet in England, UK.
A significant correlation was shown between measuring dietary vitamin D intakes using the FFQ and the 4 d-FD. The results from the Bland–Altman plot further support the validity of the FFQ. All participants except one fell within the 95 % limits of agreement and clustering of participants around the mean was present. This shows agreement between the FFQ and 4 d-FD in assessing dietary intake of vitamin D.
The widely used biomarker for vitamin D status is plasma 25(OH)D concentration, which reflects both endogenous and exogenous production of vitamin D(Reference Chen, Turner and Holick27). However, due to sunlight being a major source of vitamin D for humans this presents a confounding factor. This confounding may explain the weak correlations found between plasma 25(OH)D concentrations and vitamin D intake measured by both the FFQ and 4 d-FD. Although both correlations were statistically significant, therefore the validity of the FFQ is not compromised. The vitamin D status of the participants in the present study was consistent with previously reported data, which classified 28 % of the study population as vitamin D sufficient, 45 % as vitamin D insufficient and 27 % as vitamin D deficient(Reference Weir, Carson and Mulhern18).
The mean vitamin D intake reported from the FFQ was 9·7 and 7·9 µg/d from the 4 d-FD. The NDNS reported a mean dietary vitamin D intake of 2·7 µg/d for adults aged 19–64 years(9). The difference in intakes from the NDNS compared with the current study is largely accounted for by participants being recruited from the university population which may therefore not be representative of the whole population. Furthermore, the mean vitamin D intake reported from the FFQ and 4 d-FD without including supplements is closer to the data recorded form the NDNS at 4·8 µg/d for the FFQ and 3·1 µg/d for the 4 d-FD. The mean vitamin D intakes reported in the present study are low compared with the reference nutrient intake for vitamin D of 10 µg/d(10). These findings are not entirely unexpected, as the mean UK dietary vitamin D intake for adults aged 19–64 is < 3 µg/d(9) as mentioned. Together these data show that both the study population and the wider population are not meeting recommended nutrient intakes for vitamin D. Due to this, Scientific Advisory Committee on Nutrition recommends that year-round supplementation with 10 µg/d of vitamin D is required to compensate for low dietary intakes(10). This is particularly important when considering the ongoing COVID19 pandemic and potentially limited sunlight exposure due to lockdown restrictions. The data on mean daily dietary intakes of vitamin D collected in the current study support previous findings that showed a mean intake of 7·36 µg/d as measured by a FFQ and 5·74 µg/d when measured using a four day weighed food record(Reference Weir, Carson and Mulhern18). However, Weir et al.(Reference Weir, Carson and Mulhern18) did not report data on vitamin D dietary intake excluding supplements.
A limitation of previous FFQ validation studies has included the lack of consideration of gender which could cause inaccuracy in dietary intake assessment(Reference Lee, Kang and Song28). In the present study, there was no difference in dietary intake of vitamin D between males and females. Furthermore, significant correlations were found between the FFQ and 4 d-FD in both men and women suggesting this FFQ is valid for use in both genders.
A potential improvement to the current FFQ would be the inclusion of photographs to aid participants with portion size estimation as used in the Food4Me FFQ(Reference Forster, Fallaize and Gallagher29). The strengths of the current study include the crossover study design and adequate sample size. The 4 d-FD is the method of dietary analysis utilised for the NDNS, which adds further validity. Although we believe the questionnaire is valid for age groups beyond those included in the present study, future studies could assess validation in those under 18 years and over 64 years. Additionally, there was a lack of ethnic minorities in the study population largely due to the local demographic, and future studies may be required to validate the study for ethnic minority populations. In the present study, data to calculate BMI were not collected. It is suggested that further studies assess the BMI of participants.
Additionally, all participants included in the analysis completed the FFQ and 4 d-FD within 1 month of the other to minimize any changes in dietary patterns. The nature of dietary assessment studies means that there is reliance on self-reporting; therefore, over- or under-estimation of vitamin D intake may be present. Further validation is required to determine the validity of the FFQ in children and older adults.
Conclusions
To our knowledge, this is the first FFQ that has been validated to assess dietary intake of vitamin D in healthy adults in England, UK. The FFQ shows strong agreement with a 4 d-FD for assessing dietary intake of vitamin D in healthy adults. While there is some difference between the two methods, FFQ are not commonly used to measure absolute intakes; therefore, the agreement with another method of dietary assessment and the ease of use make the vitamin D FFQ a rapid tool for assessment of dietary intake of vitamin D by healthcare professionals and researchers alike.
Acknowledgements
Acknowledgements: The authors would like to thank the participants for their time and effort in taking part in the study. Financial support: This research received no specific grant from any funding agency, commercial or not-for-profit sectors. Conflict of interest: None. Authorship: S.M. designed the study, E.F. carried out data collection, S.W. carried out data analysis and S.W. and S.M. prepared the manuscript. Ethics of human subject participation: The current study was conducted according to the guidelines laid down in the Declaration of Helsinki and all procedures involving human subjects were approved by the Faculty of Medicine, Dentistry and Life Sciences Research Ethics Committee, University of Chester; 1129/15/EF/CSN. Written informed consent was obtained from all subjects prior to enrolment on the study.
Supplementary material
For supplementary material accompanying this paper visit https://doi.org/10.1017/S136898002000453X


