


Background
Food policies supporting healthy habit formation early in life are critical, as obesity in childhood portends obesity and its accompanying health effects in adulthood(Reference Gordon-Larsen, The and Adair1). Taxing sweetened beverages is one public health tactic proposed to combat the childhood obesity epidemic. For young children, parents determine the extent to which these taxes influence the family food environment, yet how beverage taxes are perceived by parents has not been examined(Reference Savage, Fisher and Birch2–4).
Tobacco taxation and the subsequent decline in smoking-associated diseases are a historical precedent for the potential health impact of excise taxes, or taxes on a specific good(Reference Chaloupka, Powell and Warner5). Similar to tobacco taxes, beverage taxes have also resulted in significant increased prices and decreased sales of taxed goods(Reference Roberto, Lawman and LeVasseur6–Reference Silver, Ng and Ryan-Ibarra9). Although 39 countries have implemented sweetened beverage taxes, they have yet to be widely implemented in the United States in part due to lack of public support and food industry opposition(Reference Eykelenboom, Van Stralen and Olthof10–Reference Busey12). One criticism of sweetened beverage taxes is that they disproportionately burden low-income individuals, as the increased cost represents a larger share of their income(Reference Backholer, Sarink and Beauchamp13,Reference Cawley, Thow and Wen14) . To achieve substantial public health benefits, taxes must be politically acceptable and widely implemented(Reference Brownell, Farley and Willett15).
In January 2017, Philadelphia enacted a beverage tax of 1⋅5 cents per ounce to the distribution of artificially- or sugar-sweetened beverages sold within the city. Philadelphia designated part of the tax revenue to fund programmes that benefit low-income families, specifically expanding universal pre-kindergarten (pre-K) and making improvements to city schools, parks and libraries. Approximately half of the tax revenue has been allocated to the city's general fund(Reference Rhynhart16).
Directing revenue to disproportionately burdened groups may mitigate the inequitable effects of sweetened beverage taxes and change perspectives of key stakeholders(Reference Purtle, Langellier and Lê-Scherban17,Reference Langellier, Lê-Scherban and Purtle18) . For example, the Philadelphia approach may lead to increased support for the tax among low-income parents, and may also increase positive attitudes towards the nutritional goals of the tax. The extent to which particular aspects of the tax can generate such dynamics remains unknown.
Prior work examining acceptability of sweetened beverage taxes has largely been conducted via internet and phone surveys among national samples of American adults, but these studies have not focused specifically on low-income individuals, parents or other groups who may either disproportionately be burdened or benefited by these taxes(Reference Barry, Niederdeppe and Gollust19–Reference Gollust, Barry and Niederdeppe21). Philadelphia's tax provides an opportunity to understand how perceptions of food policies may interact with parents’ choices around early childhood food environments, and how tax features designed to mitigate regressive aspects are perceived. This perspective can inform future food policy design to promote acceptability, equitability and effectiveness, particularly in the formative period of early childhood.
Methods
Study setting and participants
We recruited participants from a primary care paediatric clinic in Philadelphia that serves a low-income, primarily Medicaid-insured patient population (73 % of patients). English-speaking Philadelphia-residing parents and caregivers of 2- to 11-year-old children, with Medicaid insurance (as a marker of low income) were eligible. We sampled low-income parents of preschool- and elementary school-aged children because their children are the most likely to benefit from the programmes to which the tax revenue is directed. Due to the COVID-19 pandemic, recruitment and data collection occurred via telephone to adhere to social distancing recommendations.
We identified eligible participants through health records of patients seen at the study site during the preceding 3 months. We attempted to contact eligible participants up to three times. Eligibility criteria were confirmed prior to informed consent. Interviews occurred from 6 July to 20 August 2020.
Two research team members trained in qualitative interview techniques, and supervised by a team member with extensive qualitative research experience, conducted the interviews. Participants received a $30 Amazon gift card for participation. All study procedures were deemed exempt from review by the Children's Hospital of Philadelphia Institutional Review Board.
Conceptual model and data collection
Public acceptance of food policies aimed at combatting obesity has been associated with perceived fairness and effectiveness of the policy (Fig. 1)(Reference Bos, Lans and Van Rijnsoever22). The conceptual model guiding our work proposes that a policy's intrusiveness influences its perceived fairness and effectiveness. Intrusiveness is defined as the degree to which a policy influences an individual's freedom of choice. For example, a low intrusiveness intervention provides nutrition information compared to a high intrusiveness intervention restricting choice by what goods are available. The policy's perceived fairness and effectiveness in turn influence public acceptance(Reference Bos, Lans and Van Rijnsoever22). This model is informed by reactance theory, which states that insufficient acceptance of a food-related policy leads to less desired behaviour change among the target population, while acceptance of a policy results in more desired behaviour change(Reference Bos, Lans and Van Rijnsoever22). For Philadelphia's tax, the desired behaviour change from a public health perspective is decreased sweetened beverage purchasing and consumption.
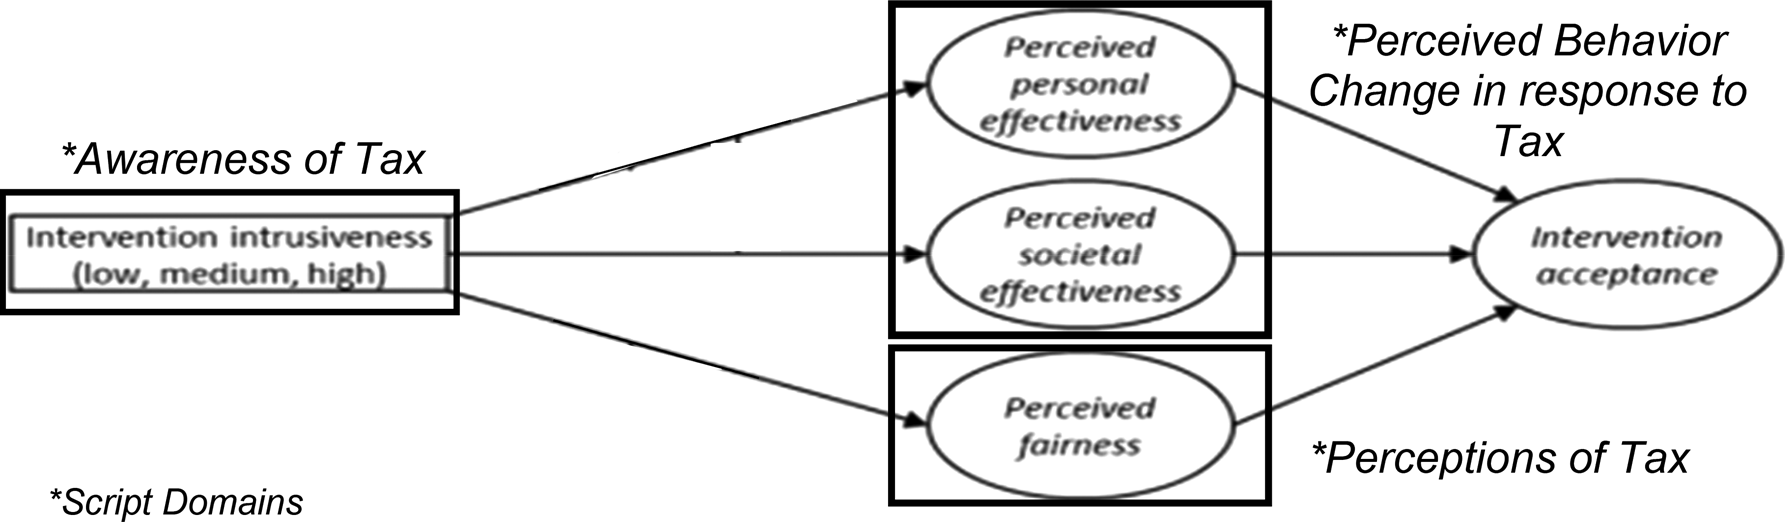
Fig. 1. Conceptual model of factors influencing acceptance of the Philadelphia Beverage Tax.
We developed a semi-structured interview guide (Supplementary material 1) based on this conceptual model exploring awareness, perceptions and perceived behaviour change related to the tax(Reference Bos, Lans and Van Rijnsoever22). After assessing participants’ awareness of the tax, we described the tax rate and revenue use to ensure a common baseline knowledge of the policy. Interviews were audio-recorded, de-identified and transcribed verbatim by a transcription service. Participants also completed a demographic questionnaire.
Analysis
We used NVivo 12 software for coding and analysis(Reference Hilal and Alabri23). We performed thematic analysis with constant comparison to code interviews(Reference Onwuegbuzie, Leech and Collins24). The initial outline for codes was based on the conceptual framework and interview guide, and we identified additional themes as they emerged. Four team members coded the first two transcripts together to develop the initial codebook. Three team members then proceeded with the remaining analysis. For the first eight transcripts, this three-member team coded two transcripts at a time and met weekly to examine inter-rater reliability, discuss and resolve coding disagreements, and refine the codebook. The remaining 22 transcripts were then divided among them, with overlap of two additional transcripts to ensure ongoing coding consistency. The team met biweekly during this process, continuing to hone the codebook as sub-themes emerged and choosing illustrative quotes representing these themes. Inter-rater reliability analysis of the coded transcripts produced a kappa statistic of 0⋅90 overall.
Results
Participants (n 30) were predominantly African American (97 %), female (100 %) and had annual household incomes below $50 000 (80 %) (Table 1). Participants ranged from 26 to 72 years old, with an average of 2–3 children per household (range 1–5). The average child age per household was 5 years, (range 7 months to 20 years). Interviews averaged 20 min in length. Themes emerged within three domains of the conceptual model: awareness of the tax, perceptions of the tax and its revenue use, and perceptions of behaviour change in response to the tax. We identified sub-themes within these categories. Illustrative quotes are presented in Table 2.
Table 1. Demographic characteristics of participants
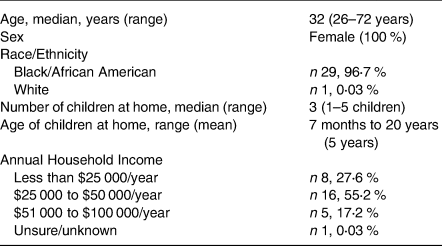
Table 2. Major study themes and illustrative quotes
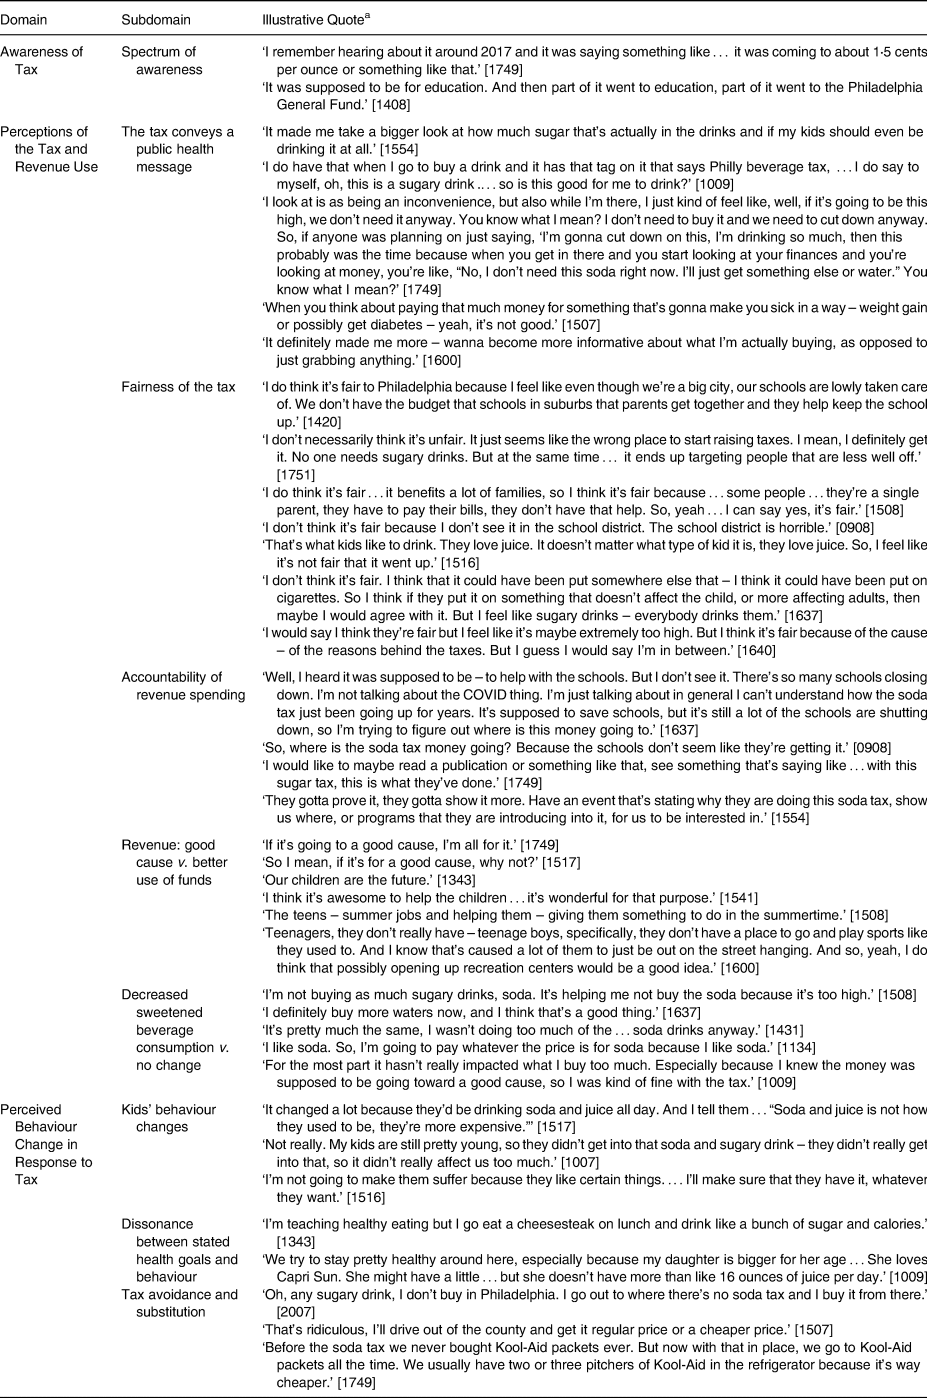
a Unique participant numbers presented in brackets.
Awareness of the tax
Spectrum of awareness
All but one participant was aware of the tax. Participants reported different levels of awareness, ranging from a general knowledge to knowing the exact tax rate. Most participants knew the tax was generating revenue for pre-K and city schools, with several participants stating revenue was directed to ‘education’.
Perceptions of the tax and revenue use
The tax conveys a public health message
A common perception among participants was that in addition to the economic disincentive, the tax communicated a public health message about the health impact of consuming sweetened beverages. The tax served as a reminder that some sweetened beverages contain added sugars. Participants noted that signs posted in some supermarkets designating beverages as subject to the tax flagged the drinks as unhealthy in their minds. The signage reminded them of the added cost as well as the potentially negative health impact of the beverages.
Fairness of the tax
Many participants who felt the tax was fair expressed the designation of tax revenue for education as the main reason it seemed fair. Some acknowledged that funding for pre-K and city schools had to come from somewhere, and the tax was an acceptable approach for generating revenue. One participant noted that because sweetened beverages are not essential to a healthy diet, taxing them seems fair.
Participants who felt the tax was unfair cited two main reasons. Multiple participants cited the city's struggling school district as evidence that the tax's revenue was not helping, thus making the tax seem unfair. Others perceived taxing sweetened beverages in particular as unfair because children like them, citing cigarettes as an example of a taxed good that they consider more acceptable since it affects adults more than children.
Many participants were ambivalent regarding the tax's fairness. Some felt a lower tax would be fairer, so revenue could be raised for pre-K and schools without causing as much financial burden on consumers. Some noted the burden of the tax on low-income families in particular as a reason the tax was unfair. However, these participants also noted that designating revenue towards education offset this, leaving them uncertain about the overall fairness of the tax.
Accountability of revenue spending
Accountability was closely linked to perceived fairness of the tax for many participants. Participants with first-hand experience of the pre-K expansion or improvements to their neighbourhood parks had more positive sentiments about the tax overall. Conversely, parents who had not witnessed revenue's direct impact, or who had negative experiences with local schools or parks, wanted accountability from the city. School closures (related to pre-pandemic consolidation of elementary schools) were commonly cited as evidence that the city was not using the revenue properly. Numerous participants stated they wished they could check a public record to see how the funds were being used.
Revenue: good cause v. better use of funds
When asked about how the city was using tax revenue, both supporters and critics of the tax agreed that revenue was going to a ‘good cause’, often using that phrase verbatim. We followed up with a question about whether there was a better use for the tax revenue. Many participants said no. Others suggested that the funding still be used for youth programming, but should be expanded in ways that explicitly support adolescents, like funding teen recreation centres and summer job opportunities.
Perceived behavior change in response to the tax
Decreased sweetened beverage consumption v. no change
We asked participants to reflect on the beverages in their refrigerators at the time of the interview and before the tax went into effect, considering whether they were different, and if so, how. Over half reported decreased sweetened beverage consumption since tax implementation. Participants did not specify whether beverages were sweetened with sugar or artificial sweeteners. Others noted they had swapped sweetened beverages for water.
Some participants reported their beverage consumption had not changed since the tax, either because they did not drink many sweetened beverages prior to tax implementation or the tax had not influenced their consumption habits. Some stated there were certain sweetened beverages they really enjoyed, like Pepsi or ginger ale, that they were willing to pay for at higher cost. One participant stated that supporting ‘a good cause’ was the reason she had not changed her habits, because each time she purchases a taxed drink, it contributes to education revenue.
Children's behaviour changes
Participants reported a range of perspectives about the tax's impact on their children's consumption of sweetened beverages, from decreased intake to no effect. Some parents noted a direct connection between the tax and a decrease in their children's sweetened beverage consumption, either due to increased cost, the health message conveyed by the tax, or both. For others, the tax had no effect because their children never drank sweetened beverages. More than one parent stated their child's consumption of sweetened beverages had not changed because they were ‘protecting’ them from the tax, stating they would sacrifice their own consumption to be able to afford sugary drinks for their children.
Dissonance between stated health goals and behaviour
The majority of participants expressed that they considered how ‘healthy’ a beverage was before purchasing it for their families. However, almost half of the parents interviewed went on to say that despite prioritising health, they bought sweetened drinks for their children. Some cited juice-adjacent beverages such as Capri Sun or sweetened ‘waters’ as the sugary drinks they allowed. Only a few parents acknowledged the dissonance between their stated health goals and continuing to drink sweetened beverages.
Tax avoidance and substitution
Several participants reported avoiding the tax by shopping for sweetened beverages outside of Philadelphia's city limits. Some noted that they would be outside of the city for other reasons, like visiting family members or for work, and would coordinate food shopping with those activities to avoid the tax. Others noted that they swapped buying sweetened beverages for powder or liquid drink mixes like Kool-Aid or Gatorade that are not taxed, to continue having the sugary drinks they wanted.
Discussion
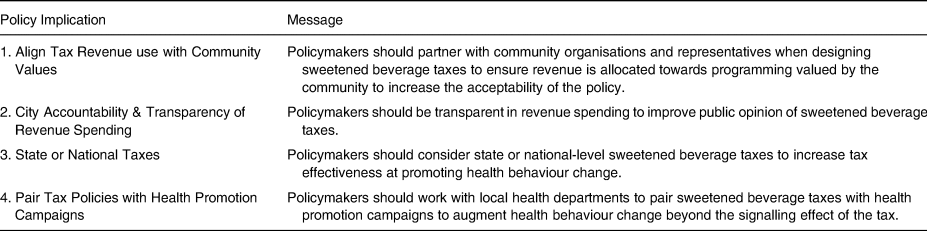
This is the first qualitative study, to our knowledge, focused on low-income parents’ perceptions of a sweetened beverage tax. Our results support Bos et al.'s conceptual model (Fig. 1) depicting that perceived fairness and effectiveness influence a food policy's acceptability, and shed further light on how certain elements of beverage tax policies influence how they are perceived by low-income parents. The key findings can be summarised into four main conclusions, each of which has direct policy implications (Table 3). First, using tax revenue to support programmes highly valued by parents, like education, was viewed favourably. Second, the perceived fairness of the tax was contingent upon the city using tax revenue as promised. Third, some Philadelphia parents avoided the tax through cross-border shopping in areas outside the city. Finally, the tax communicated a public health message about the negative health impact of sweetened beverage consumption. The policy implications of these findings and how they fit into the current understanding of perceptions of sweetened beverage taxes are summarised below.
Table 3. Recommendations for policymakers considering beverage taxes
Proponents, including grassroots groups, have argued that beverage taxes can advance health equity by generating revenue for programmes benefitting low-income communities, who are most affected by nutrition-related diseases(Reference Cawley, Thow and Wen14). However, no prior studies have documented whether low-income communities agree with this view(Reference Brownell, Farley and Willett15,Reference Grummon, Roberto and Krieger25) . We found that many low-income Philadelphia parents supported the policy as long as its revenue is directed to programmes meaningful to them, such as early childhood education. Many participants felt the tax revenue was being used in the best way possible, suggesting that Philadelphia's policymakers identified a suitable use for the revenue.
Our first key finding is that policymakers should align sweetened beverage tax revenue use with community values to increase their acceptability (Table 3). Our results affirm previous evidence that aligning tax revenue with the community's goals is essential for the success and longevity of the tax. Prior studies examining U.S. beverage tax revenue allocation show that each of the existing taxes have allocated revenue specific to their community's needs(Reference Krieger, Magee and Hennings26). For example, Berkeley, California, which has a more highly educated and health-conscious population, allocates its tax revenue to healthy living programmes, compared to Philadelphia, which focuses tax revenue on early childhood education and renovating city schools, parks and libraries, consistent with the needs of its low-income population(Reference Krieger, Magee and Hennings26). In contrast, the short-lived beverage tax in Cook County, Illinois, enacted and repealed 3 months later, was framed to both help fill a $200 million budget gap and as a way to improve health(Reference Chriqui, Sansone and Powell27). One qualitative study showed that the public found these goals to be seemingly unrelated and not community-specific, contributing to mistrust about the tax's purpose and ultimately leading to its repeal(Reference Chriqui, Sansone and Powell27).
Our second key finding is that transparent revenue spending is likely to improve public opinion of sweetened beverage taxes. In addition to designating revenue for programmes that benefit low-income families, policymakers must also consider strategies for accountability. We found that parents who had directly benefitted from the beverage tax revenue, through expanded free pre-K, for example, felt more favourably about the tax than parents who had not seen the direct impact of the funds. Although Philadelphia does publicly report revenue use online, many participants were not aware of this and called for increased visibility, even explicitly asking for ‘a public record’, or ‘an event’ to publicise revenue use. These findings are consistent with prior qualitative work assessing beverage tax acceptability, noting mistrust that revenue will be used as promised, rather than for ‘generic government business’(Reference Thomas-Meyer, Mytton and Adams28). Consistent with these concerns, as of 30 June 2021, 53⋅6 % of Philadelphia's tax revenue was in the city's ‘general fund’(Reference Rhynhart16).
Several U.S. sweetened beverage taxes (Berkeley, Oakland, San Francisco, Boulder and Seattle) have existing community advisory boards to ensure accountability in tax revenue use(Reference Krieger, Magee and Hennings26). Given our findings that some low-income Philadelphia parents remain sceptical about the tax's revenue use, advisory boards such as these may be a model for maintaining accountability and improving public opinion about sweetened beverage taxes.
Our third key takeaway is that policymakers should consider state or national sweetened beverage taxes to increase tax effectiveness at promoting health behaviour change. Our study found that cross-border shopping contributed to low-income parents’ mixed feelings about perceived effectiveness of the tax. Though some parents reported a decrease in their family's sweetened beverage intake or substituting water for sweetened beverages, others reported avoiding the tax by purchasing sweetened beverages outside the city. This is consistent with other findings from Philadelphia, though net declines in volume of sweetened beverages sold since tax implementation far exceed the amount of cross-border shopping(Reference Roberto, Lawman and LeVasseur6,Reference Cawley, Frisvold and Hill29,Reference Seiler, Tuchman and Yao30) . In line with our findings that low-income parents are contributing to this phenomenon, Supplemental Nutrition Assistance Program sales increased in neighbouring counties and decreased in Philadelphia after tax implementation, though given the different numbers of participants in each county it is difficult to estimate the relative impact of the changes(Reference Chrisinger31,Reference Knox32) . Still, in order to maximise the tax's effect, policymakers should consider state or national taxes to increase the geographical spread and decrease cross-border shopping.
Participants also reported substituting powdered or liquid beverage mixes as a way to consume nontaxed sugary drinks. This aligns with findings from a recent longitudinal analysis of commercial retail sales data that noted substitution towards beverage concentrates in supermarkets since implementation of Philadelphia's tax(Reference Gibson, Lawman and Bleich33,Reference Petimar, Gibson and Yan34) . Therefore, policymakers should consider including powdered beverage mixes and concentrates to close this loophole in future beverage tax policies.
Finally, our results suggest that pairing sweetened beverage taxes with health promotion campaigns may augment healthy behaviour change beyond the economic impact of the tax. Participants expressed that the tax served as a reminder that sweetened beverages are detrimental to health, communicating a public health message along with the tax's economic disincentive. After enactment of Philadelphia's tax, many supermarkets and other establishments posted ‘Philly Beverage Tax’ signs above taxed beverages to explain the higher price to consumers. For our participants, these signs communicated the dual message of an explanation of the higher price as well as flagging the beverage as ‘unhealthy’ in their minds. Tobacco taxation, paired with public health messaging about the health risks of smoking, serves as a strong historical precedent for the synergy of tying a health promotion campaign to economic disincentives(Reference Chaloupka, Yurekli and Fong35). Evidence is mounting that the same approach may be effective for sweetened beverage taxes(Reference Grummon, Roberto and Krieger25).
The extent to which there is ‘signalling’ of the harms of sweetened beverages through the presence of a tax on its own has been examined in other cities with beverage taxes, with mixed results depending on local context and whether the tax was paired with a public health campaign at its outset(Reference Grummon, Roberto and Krieger25). In Cook County, Illinois, where there was not a concerted public health campaign accompanying the tax, consumers bought fewer sweetened beverages when the tax was in place and sales returned to pre-tax levels after it was repealed, suggesting no persistent signalling effect(Reference Powell and Leider36). Some criticised the inclusion of artificially sweetened beverages in Cook County's tax as ‘diluting’ the public health message of the tax(Reference Chriqui, Sansone and Powell27). This ‘diluting’ of the health message may partially explain the lack of a persistent signalling effect after the revocation of the Cook County tax. However, Philadelphia's tax does extend to artificially sweetened beverages and this criticism did not arise in our study. In contrast to both Cook County and Philadelphia, Berkeley, California launched a health promotion campaign about the harms of excess sweetened beverage consumption prior to the enactment of their beverage tax and the University of California, Berkeley campus saw a decline in sales of sweetened beverages even before the tax took effect(Reference Taylor, Kaplan and Villas-Boas37).
While history and prior research suggest that in some contexts, focusing only on the potential health impacts of a sweetened beverage tax as reason for its implementation may be unsuccessful, pairing a health promotion campaign with a tax policy may be an effective approach to maximise health behaviour change in response to the tax(Reference Purtle, Langellier and Lê-Scherban17,Reference Grummon, Roberto and Krieger25) . Indeed, Philadelphia failed to implement a sweetened beverage tax twice using a health frame as the main reason for tax implementation, before ultimately passing the current tax(Reference Kane and Malik38). Yet, we found that many participants reported prioritising health when grocery shopping. At the same time, parents reported regularly buying sugary drinks, which for some represented a treat for their children that they were unwilling to sacrifice. The dissonance between parents reporting that they prioritise health yet continue to purchase sugary drinks – often as an inexpensive indulgence for their children – deserves further investigation. This finding also suggests that health promotion and education, in concert with promoting beverage taxes as a revenue stream for valued programmes, could help support families make the healthy choices they aspire to.
Limitations
The present study has several limitations. The first is selection bias, as study participation was voluntary and eligible individuals who declined participation may have differed from our study population. Second, our findings may not be generalisable to other groups. We recruited a largely homogenous sample of low-income Black/African American women in Philadelphia. While ideal for exploring the spectrum of views held by this population, which has not been well represented in prior work on sweetened beverage taxes, this approach does limit generalizability. We excluded non-English speakers because, due to the low prevalence in our clinic population, we could not adequately capture their distinct perspectives. Additionally, caregivers of young children may be particularly enthusiastic about tax revenue being used for education. Future studies characterising perceptions among populations less likely to benefit personally from these services – like the elderly or adults without children – and including non-English-speaking families would provide further insight into the most widely acceptable policy design. The present study is also limited by social desirability bias, as caregivers may feel pressure to report providing healthier diets for their children than they are consuming in practice, particularly to researchers affiliated with a children's hospital. Conducting interviews via telephone allowed for more anonymity which may have mitigated some social desirability bias. Finally, we did not ask specifically about perceptions of the inclusion of artificially sweetened beverages in the tax, which would have shed light on an understudied area. Future studies should investigate how the inclusion of artificially sweetened beverages in beverage taxes influences their perceived fairness and effectiveness.
Conclusion
For low-income Philadelphia parents, perceptions of beverage tax fairness were driven by two critical elements: use of revenue for programmes valued by the community, such as early childhood education, and accountability of city government to use tax revenue as promised. Because some individuals leave the city to avoid taxation, state or national taxes would likely be even more effective at reducing sweetened beverage intake than local taxes. Pairing sweetened beverage tax policies with public health education campaigns reinforcing the negative health impact of sweetened beverage consumption may further improve tax effectiveness.
Supplementary material
The supplementary material for this article can be found at https://doi.org/10.1017/jns.2022.64.
Acknowledgements
E. K. E. conceived of, designed, collected data, analysed and prepared the manuscript for this study. J. A. S. provided supervision and critical review of the manuscript. E. F. G. provided supervision and helped with preparation and critical review of the manuscript. C. A. R. provided supervision and critical review of the manuscript. S. M. G. contributed to data analysis and provided critical review of the manuscript. J. K. collected data, contributed to data analysis and provided critical review of the manuscript. S. V. provided supervision and helped with preparation and critical review of the manuscript.
E. K. E. received grants from the National Institutes of Health (NIH) National Resource Service Award (T32 5T32-HP010026-18) and from Children's Hospital of Philadelphia Policy Lab and Center for Pediatric Clinical Effectiveness (7225630621-04) to fund the conduct of the study. J. A. S.: None. E. F. G.: None. C. A. R.: None. S. M. G.: None. J. K.: None. S. V.: None.
E. K. E.: None. J. A. S.: None. E. F. G.: None. C. A. R. received grants from the Bloomberg Family Foundation outside the submitted work. S. M. G.: None. J. K.: None. S. V.: None.
This study was conducted according to the guidelines laid down in the Declaration of Helsinki and all procedures involving research study participants were deemed exempt from review by the Children's Hospital of Philadelphia Institutional Review Board. Verbal informed consent was obtained from all subjects. Verbal consent was witnessed and formally recorded.


 Open access