


Barbados is a predominantly black Caribbean nation (population 274 000), with about 80 % of the population being of African descent, 4 % European descent, and 16 % mixed(1). From 1960 to 2000 the average life expectancy of Barbadians at birth rose from 63 to 76·4 years, placing it 18th highest in the world(2). However, over the same period of time the country has experienced increasing rates of chronic non-communicable diseases such as diabetes, hypertension, CVD and cancer that are characteristic of the latest phase of the nutrition transition(Reference Popkin3). The age-standardised mortality rate for cancer in 2002 (the latest year for which figures are available) was 135 per 100 000 population, which is virtually identical to that of the USA (134 per 100 000), while the age-standardised mortality rate for CVD (245 per 100 000 population) was substantially higher than that of the USA (188 per 100 000)(4). Studies carried out in the 1990s by the Barbados Eye Study Group documented a very high prevalence of diabetes, predominantly type 2, in the adult black population, affecting almost one in five individuals(Reference Hennis, Wu and Nemesure5). Hypertension and overweight were also very prevalent. Some 50 % of non-diabetics and almost 70 % of diabetics were hypertensive, while 59 % of non-diabetics and 72 % of diabetics were overweight (BMI>25 kg/m2). The Barbados Food Consumption and Anthropometric Survey (BFCAS), which was carried out in 2000, reported that the mean BMI for adult males aged between 18 and 64 years was 26·0 kg/m2, while mean BMI for female adults was 27·9 kg/m2(6). Over 40 % of men were in the overweight category and a further 15 % were obese (BMI>30 kg/m2), while 34 % of women were classified as overweight and an additional 30 % were obese. The World Health Organization Global InfoBase Obesity Comparison Tool(7) predicts that by 2015 some 86 % of Barbadian women and 70·5 % of men will be overweight, and that of these, 62·8 % of women and 27·7 % of men will be obese. In terms of BMI this would rank the country 8th highest in the world for females (mean BMI = 32·3 kg/m2) and 20th for males (mean BMI = 27·5 kg/m2).
The rapid shifts in chronic disease patterns currently being experienced in Barbados could be explained to some extent at least by the fact that as in other Caribbean nations(Reference Albert, Samuda and Molina8), dietary habits have been changing recently to include more fast foods and a less nutrient-dense diet(9). The BFCAS determined energy and nutrient intakes in a nationally representative sample of Barbados citizens in the year 2000, utilising data collected by a single 24 h dietary recall(6). Median energy intakes were 2136 kcal/d (8937 kJ/d) in males and 1715 kcal/d (7176 kJ/d) in females. Median energy from fat as a percentage of total dietary energy was 24·5 % for males and 25·0 % for females, while energy from carbohydrate was 58·2 % of total energy for males and 59·3 % for females. Sharma et al. (Reference Sharma, Cao and Harris10) measured energy and nutrient intakes based on 4 d estimated food diaries in a group of forty-nine randomly-selected adults as part of the Barbados National Cancer Study. As well as noting high sugar intakes and low fibre intakes (especially in women), these authors reported that energy from fat as a percentage of total energy was 2·1–5·2 % higher than it was in the BFCAS study, which had been carried out just 5 years earlier. This observation caused them to speculate that the diet may be worsening rapidly. However, given the different dietary intake methodologies used it is unclear whether this is the case or not.
At their crudest level, dietary trends can be followed using aggregate data from food production, imports and exports(Reference Hiller, McMichael, Margetts and Nelson11). This is called the food disappearance method and utilises national food balance sheets compiled annually by the FAO. Although these data represent only the total supply of foods within a country rather than the actual dietary intakes of individuals, they can be useful for examining the overall changes in food and nutrient supply within a country over many years, a point which is especially relevant for lower- and middle-income countries where few, if any, national food consumption studies may have been carried out. The food balance sheets provide estimates of energy (kcal per capita per d), protein (g per capita per d) and fat (g per capita per d) supply, but provide no information on carbohydrates (for example, sugars, starch, dietary fibre), fatty acids, amino acids, or micronutrients. The objective of the present study was to subject the national food balance sheet data for Barbados from 1961 to 2003 to a more detailed examination using dietary analysis software in order to obtain a clearer and more comprehensive picture of the changes that have taken place in macronutrient supply during that period. We describe these changes and discuss their implications in relation to the WHO guidelines for nutrition and prevention of chronic disease(12).
Methods
FAO food balance sheets for the period 1961–2003 were downloaded as comma separated values (.csv) files from the FAOSTAT database(13). These food balance sheets provide overall supply (as kg per capita per year) for commodities including cereals, starchy roots, vegetables, fruits, oilseeds and oilseed oils, tree nuts, animal fats, milk, meats, eggs, and fish. The full list of commodities is shown in Appendix 1. Having imported the data into Microsoft Office Excel (Microsoft Corp., Redmond, WA, USA), supply was then converted to g per capita per d.
In order to determine the energy and macronutrient supply the foods were coded and entered into WISP dietary analysis software (Tinuviel Software, Llanfechell, Anglesey, UK). The food composition databank supplied with this software is from McCance and Widdowson's The Composition of Foods, 5th and 6th editions plus supplements(14). For consistency and wherever possible, foods were coded as being in their most unprocessed form (for example, ‘bananas, weighed with skin’, ‘onions, raw’, ‘barley, whole grain, raw’). However, certain categories, such as fish, offals (edible), alcoholic beverages, and those labelled as ‘other’, were lacking in detail about the specific foods that made up the category, and it was necessary for us to decide what foods should be included in them. To do this we referred to a quantitative FFQ developed by one of the authors (S. S.)(Reference Sharma, Cao and Harris15), which provides detailed information on the most commonly consumed foods and drinks in Barbados. Using the food list of this questionnaire as a guide, we populated the category ‘fish’ with tuna, mackerel, sardines, salmon, cod, flying fish and red snapper. ‘Vegetables (other)’ was populated with breadfruit, mixed vegetables, broccoli, cauliflower, carrots, green beans, pumpkin, squash, sweetcorn, okra, avocado, cabbage, spinach and lettuce. The category ‘citrus (other)’ contained kumquats, clementines, tangerines, satsumas, limes and mandarin oranges, while ‘fruits (other)’ contained paw-paw, mangoes, plums, melon, guava, ackees, peaches, pears, cherries, lychees, fruit salad, passion fruit and blackcurrants. For categories where this procedure was carried out, supply was divided equally among the constituent foods.
In order to check the level of agreement between our calculated values for energy (kcal per capita per d), protein (g per capita per d) and fat (g per capita per d) supply and the food balance sheet estimates we obtained Pearson correlations using Microsoft Office Excel 2003 (Microsoft Corp.). Statistical significance of correlations was accepted at the 5 % level. All tests were two-sided.
Results
There was excellent agreement between the dietary energy supply figures shown on the FAO food balance sheets and our calculated values (Fig. 1(a)). Our values for energy supply were, on average, 1·8 % higher than the FAO estimates and the relationship between them was highly significant (r 2 0·9723; P = 0·0000). The comparison between the food balance sheet estimates for fat and protein supply and our calculated values is shown in Fig. 1(b). Our values for fat supply were, on average, 3·6 % lower than the values shown on the FAO food balance sheets but again the relationship between them was highly significant (r 2 0·9584; P = 0·0000). In contrast, for protein supply, the calculated values were substantially higher (by some 36·7 %) than the values shown on the FAO balance sheets, although there was still a very strong and statistically significant correlation between them (r 2 0·953; P = 0·0000).
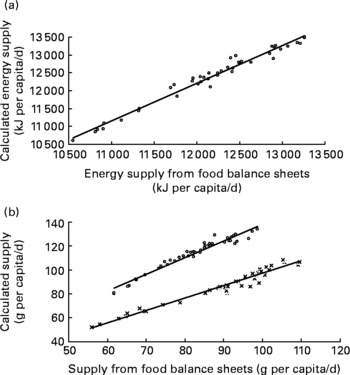
Fig. 1 Relationship between (a) dietary energy supply and (b) protein (○) and fat ( × ) supply shown on the FAO food balance sheets and our calculated values. (a) For energy, y = 1·0518x − 416·46 (R 2 0·9723). (b) For protein, y = 1·4047x − 2·2649 (R 2 0·953); for fat, y = 1·0332x − 6·2146 (R 2 0·9584).
Fig. 2 shows the change in food balance sheet-derived and calculated values for dietary energy supply (including the 5-year moving average) between 1961 and 2003. Total dietary energy supply increased by over 2500 kJ per capita per d (almost 25 %) between 1961 and 2003. There was a sharp increase in energy supply from 1961 to the early 1970s, after which the rate slowed down until the late 1980s. During the late 1980s and early 1990s energy supply declined for a time but it has risen steadily again since the mid-1990s, increasing by some 8 % over the course of the last decade.
Fig. 2 Changes in food balance sheet-derived (●) and our calculated values (○) for dietary energy supply (kJ per capita per d) in Barbados between 1961 and 2003. The fitted lines are the 5-year moving averages.
Fig. 3 shows the changes in food balance sheet-derived and calculated values for (a) fat, (b) carbohydrate and (c) protein supply (including the 5-year moving average) between 1961 and 2003. Fat supply increased by approximately 80 % over this period, while the supply of protein rose by about 50 %. Carbohydrate declined from the early 1980s to the mid-1990s but has risen by 13 % since then.

Fig. 3 Changes in food balance sheet-derived (●) and our calculated values (○) for supply of (a) fat (g per capita per d), (b) carbohydrate (g per capita per d) and (c) protein (g per capita per d) in Barbados between 1961 and 2003. The fitted lines are the 5-year moving averages.
Fig. 4 shows the calculated macronutrient contributions to total energy supply. Between 1961 and 1989, the contribution of carbohydrate to dietary energy fell dramatically. In 1961 some 70 % of energy was provided by carbohydrate, whereas by 1991 this figure had fallen to 53 %. In contrast, there was a marked increase in the contribution of fat to dietary energy over the same period. In 1961, fats provided only about 19 % of energy whereas by 1992 this figure had reached 32 %. At that point the figures began to diverge again, so that by 2003 the values were 57 % energy from carbohydrate and 28 % energy from fat. The contribution of protein to energy has remained relatively constant, while alcohol has made only a minor contribution.

Fig. 4 Change in calculated contributions of proteins (–○–), fats (–●–), carbohydrates (–△–) and alcohol (–▲–) to dietary energy supply (%) in Barbados between 1961 and 2003.
Fig. 5 shows the changes calculated to have taken place in the type of fat provided in the food supply between 1961 and 2003. Between 1961 and the mid-1970s the food supply was characterised by a high level of saturated fats. The contribution of saturated fats to dietary energy reached a maximum of 14 % in 1974. Between 1974 and 1981 the saturated fat content of the diet fell abruptly while the polyunsaturated fat content increased sharply. This had a dramatic effect on the polyunsaturated:saturated (P:S) ratio of the food supply, which, according to our data, increased from 0·28 in 1978 to 0·76 in 1982, where it has more or less remained ever since. By 2003 the contribution of saturated fats to total energy had fallen to about 9 %, with monounsaturated and polyunsaturated fats contributing 7·9 and 7·7 %, respectively.

Fig. 5 Change in calculated PUFA:SFA ratio (P:S; ■) and contributions of SFA (–○–), MUFA (–●–) and PUFA (–△–) to dietary energy availability (% of dietary energy) in Barbados between 1961 and 2003.
Fig. 6 shows the changes calculated to have taken place in the sugars:starch ratio and the fibre supply (g per capita per d) between 1961 and 2003. The sugars:starch ratio increased from a minimum value of 0·64 in 1967 to a maximum of 1·11 in 1982. Over the next 9 years it fell to 0·71 but since then it has gone up again and in 2003 the ratio was 0·90. The maximum value for fibre supply (43·2 g per capita per d) was recorded in 1967 and the minimum value (29·4 g per capita per d) occurred in 1982. Fibre supply in 2003 was 42·7 g per capita per d.

Fig. 6 Change in calculated sugars:starch ratio (–○–) and fibre supply (–●–) (g per capita per d) in Barbados between 1961 and 2003.
Discussion
The objective of the present study was to analyse the FAO food balance sheet data for Barbados from 1961 to 2003 using dietary analysis software in order to characterise the changes that have taken place in the macronutrient supply of the country during this period. The changes we observed, such as the continuing rise in total energy supply, the growing contribution of fat to dietary energy, and the sudden and dramatic shift in the P:S ratio in the late 1970s and early 1980s are characteristic of a country in nutrition transition(Reference Popkin3, Reference Popkin16, Reference Popkin17).
Based on an analysis of food balance sheet data, Kennedy(Reference Kennedy18) reported that globally there has been an increase of approximately 500 kcal (2090 kJ) per capita per d in dietary energy supply between 1961 and 1999. The present results for Barbados (Fig. 2) indicate that the food supply in 2003 provided over 2500 kJ (about 600 kcal) more energy per capita per d than it did in the early 1960s. Energy, protein and fat supply rose more or less continuously, apart from a brief spell in the early 1990s during which the country went through an economic recession. It is highly likely that at least some of the increased supply would have been consumed. We do not have information about changes in physical activity patterns in Barbados over the same period, but internationally they have been falling because of the greater availability of motorised transport, the increased prevalence of labour-saving devices in the home and workplace, and the increasingly sedentary nature of work and recreational pursuits(Reference Cordain, Gotshall and Boyd Eaton19). Hence, it would be expected that obesity rates in Barbados would have risen in recent decades.
As mentioned earlier, a particularly striking pattern that started to emerge in the 1960s was the change in the amount of dietary energy supplied by carbohydrate and fat (Fig. 4). The WHO recommends that 55–70 % of dietary energy should come from carbohydrate and 15–30 % should come from fat(12). The present results indicate that during the early 1960s the food supply had a very high carbohydrate component and was low in fat. By the early 1990s, however, within the space of a single generation, not alone had total dietary energy supply increased by 25 %, but the gap between energy from carbohydrate and energy from fat had been cut in half. The most recent figures from 2003 indicate that carbohydrate contributes 57 % of total energy supply and fat contributes 28 %. These values are at the opposite end of the WHO recommendations from where they were just 40 years earlier. In the BFCAS(6), based on 24 h recalls, median percentage contributions of proteins, carbohydrates and fats to total energy intake were 16, 59 and 25 %, respectively, in women and 16, 58 and 25 % in men. In a smaller study using similar methodology, Sharma et al. (Reference Sharma, Cao and Harris15) reported that the contributions of proteins, carbohydrates and fats to dietary energy were 14, 58 and 28 %, respectively, in women, and 14, 62 and 23 % in men. Moreover, in another study by Sharma et al. (Reference Sharma, Cao and Harris10) using 4 d estimated food diaries, proteins, carbohydrates and fats contributed 15, 55 and 28 % of energy in women and 16, 55 and 27 % of energy in men. Although not directly comparable, the present results are in close agreement with these data. The shift towards increased energy supply from fat over recent decades is also consistent with what has been happening in other Latin American and Caribbean countries in nutritional transition(Reference Albala, Vio and Kain20–Reference Rodriguez-Ojea, Jimenez and Berdasco22), as well as around the world in general(Reference Kennedy18).
Wheat was and still is the most important cereal commodity in the food supply of Barbados but during the 1960s rice and starchy roots, especially yams, potatoes and sweet potatoes, were also important energy foods. Examination of the food balance sheets for each year between 1961 and 2003(13) (data not shown) reveals that during the period between 1961 and 1990 there was a gradual rise in the supply of wheat and maize, a fall in the supply of rice, yams and sweet potatoes, and, especially, a sharp increase in the supply of meats, milk (excluding butter) and most notably vegetable oils. The sudden appearance of soyabean oil as a source of fat is especially interesting. In the food balance sheet for 1977 soyabean oil was a very minor component of the food supply, with a supply of 0·77 g per capita per d(13). The main vegetable oil being used at the time was coconut oil (13·3 g per capita per d). By 1983, just 6 years later, soyabean oil had become the predominant vegetable oil in the food supply (8·7 g per capita per d) and the supply of coconut oil had essentially fallen to zero(13). Coconut oil contains about 85 % SFA (mainly C8–C16 chain length), whereas soyabean oil is highly unsaturated, containing about 23 % MUFA and 57 % PUFA(14). The abrupt shift in dietary fat sources is reflected in the dramatic increase in the calculated P:S ratio of the food supply from 0·28 to 0·76 that occurred between 1978 and 1982 (Fig. 5). This coincides with a time when saturated fats in general were being scrutinised because of their tendency to raise blood cholesterol and when, according to Fife(Reference Fife and Fife23, Reference Fife, Adkins, Foale and Samosir24), the vegetable oil industry, led by the American Soyabean Association, began an aggressive publicity campaign against tropical oils which caused food manufacturers around the world to begin to reformulate products on a massive scale to contain soyabean oil instead of tropical oils. Moussavi et al. (Reference Moussavi, Gavino and Receveur25) calculated the 5-year average supply of total fat, SFA, MUFA and PUFA in 168 countries using FAO food balance sheet data from between 1998 and 2002. Energy from total fat was 24·7 % of dietary energy, while percentage energy from SFA was 8·2 %, energy from MUFA was 7·4 %, and energy from PUFA was 5·4 %. This suggests that the P:S ratio in the global food supply is approximately 0·66. Sharma et al. (Reference Sharma, Cao and Harris10), using data from 4 d food diaries, reported that Barbadian men had a mean intake of 16·3 g SFA/d and an intake of 9·7 g PUFA/d, while women had daily intakes of 15·7 g SFA and 7·9 g PUFA. This would yield a P:S ratio of approximately 0·55. The discrepancy between this value and our estimate may be because results from food balance sheets and dietary intake studies are not directly comparable due to the fact that these approaches measure diet at different levels(Reference Serra-Majem, MacLean and Ribas26). Vegetable oils discarded after cooking in the home would be excluded from food intake records but would not have been adjusted for in food balance sheets. Also there is no information on how much of the soyabean oil recorded as having entered the food supply in Barbados at that time was hydrogenated and how much was used in its native form. Despite these uncertainties, our data suggest that over a short period of time in the late 1970s and early 1980s the lipid profile of the food supply (including the amounts of SFA, n-3 and n-6 PUFA and trans-fatty acids) may have undergone important changes.
According to our calculations the gap between energy from carbohydrate and energy from fat was at its narrowest in 1992 (Fig. 4). Since then the trend has started to reverse, with energy from carbohydrate increasing and energy from fat decreasing. However, the pattern that is emerging is that it is sugars that have increased, whereas starch supply has not changed. Consequently there has been a rise in the sugars:starch ratio during that period (Fig. 6). While a fall in fat supply is desirable, a rise in sugars from their already high level goes against WHO guidelines(12). Free sugars should be < 10 % of total energy, whereas in 2003 they were over 17 %. The WHO recommendations for fibre are>25 g total dietary fibre per d(12). Our data show that overall fibre supply increased from 35·3 to 42·7 g/d between 1961 and 2003. However, these amounts are likely to be overestimates of true intake because we coded foods as being in their most unprocessed form. Based on data obtained using 4 d food diaries, Sharma et al. (Reference Sharma, Cao and Harris10) reported that mean intakes of fibre in male and female Barbadians were 25·2 and 20·5 g/d, respectively.
There are a number of limitations to the present study. Food balance sheets overestimate food consumption and nutrient intakes since they do not take into account the losses that occur after the retail level, for example, food that is spoiled, trimmed, wasted, or fed to animals within the household(Reference Schmidhuber and Traill27). Hence, it is not possible to equate food balance data directly with data generated using other techniques such as household budget studies or food consumption surveys because each approach measures different levels of dietary information(Reference Serra-Majem, MacLean and Ribas26). Another limitation is that foods are listed as basic commodities (for example, wheat, barley, rye, sorghum, etc) rather than specific food items that people eat, such as bread, cakes or biscuits. This raises questions about how to code the data properly for nutritional analysis. For consistency we coded at the level of the raw unprocessed commodity wherever possible. However, this could contribute to inaccuracies in certain situations, as would appear to be the case for fibre. A further limitation is that there is a surprising lack of detail in the food balance sheets regarding certain categories of commodity, such as fruits and especially vegetables (see Appendix 1). For example, specific amounts are provided only for tomatoes and onions, whereas all other vegetables come under the heading of ‘other vegetables’, which means that information that is vital for accurate coding is missing for the greater proportion of the total vegetable supply. To try to overcome this issue we populated these categories using information about commonly consumed foods from a quantitative FFQ developed specifically for African-Barbadians. Although this approach could only give us an approximation of true supply for these categories it ensured that foods typically consumed by the population but which were not already accounted for on the food balance sheets would be represented. The use of a UK rather than a Caribbean food composition database is another potential limitation, although the composition of basic commodities would not be expected to differ very much between the two countries. On the positive side, the UK database is extremely comprehensive, which facilitates more accurate coding. Using this database, our estimates for total dietary energy and fat supply were in excellent agreement with the FAO food balance sheet estimates. The one area where we observed a large difference in absolute values between the FAO estimates and our calculations was in relation to protein supply. Further analysis is required to identify the source of this discrepancy.
In conclusion, our analysis of the FAO food balance sheet data for Barbados indicates that major changes in macronutrient supply have taken place in that country since the early 1960s, including a substantial increase in overall energy supply, an increase in energy from fat and a fall in energy from carbohydrates. Energy from sugars, at over 17 % of dietary energy, is well above the upper limit set by the WHO. Despite the methodological limitations that are associated with the use of food balance sheet statistics, our data suggest that these imbalances need to be addressed as a matter of priority in order to slow down the progression of nutrition-related chronic disease that is projected to cause increasing disability and premature death, and place a severe economic burden on the country in the coming years.
Acknowledgements
This research received no specific grant from any funding agency in the public, commercial or not-for-profit sectors.
T. S. conceived and designed the study, collated and analysed the data and drafted the manuscript. S. S. provided data on commonly foods consumed in Barbados, critically reviewed the manuscript, and contributed to its revision.
The authors declare they have no conflicts of interest.
Appendix 1. Commodities listed in FAO Food Balance Sheets


