


Since deinstitutionalisation, community care has emerged as the predominant policy and therapeutic support framework for people with mental health problems in many countries. This has led to an interest in social networks–that is, the social ties and relationships that link people together.Reference Leff, O'Driscoll, Dayson, Wills and Anderson1–Reference Pernice-Duca3 Studies have reported that people with severe mental illness (SMI) have smaller and poorer-quality networks than the general population,Reference Macdonald, Hayes and Baglioni4 which limits their access to social supportReference Bengtsson-Tops and Hansson5 and social capital.Reference De Silva, McKenzie, Harpham and Huttly6 There have long been concerns about the impact of loneliness and social isolation on mental health and opportunities for personal recovery.Reference Lim and Gleeson7 Central to improving outcomes are addressing physical health needs,Reference Thornicroft8 reducing stigma and discrimination,Reference Meta, Clement, Marcus, Stona, Bezvorodovs and Evans-Lacko9 and providing services that are person-centred, strengths-based and recovery-focused.Reference Davidson, Rowe, Tondra, O'Connell and Lawless10 Social relationships have been identified as key agents of change in resource-oriented therapeutic models,Reference Priebe, Omer, Giacco and Slade11 and recent research conceptualising personal recovery has emphasised the importance of connectedness and meaningful activities.Reference Leamy, Bird, Le Boutillier, Williams and Slade12 This paper explores how our understanding of connectedness and well-being can be expanded by extending social network analysis to include a person's connections to places and activities, as well as to other people.
Method
Study design
In this 30-month mixed-methods study, we collected largely descriptive data to explore well-being, social capital and network structure. This was carried out in two sites: an inner city London borough; and an area of South West England.Reference Pinfold, Sweet, Porter, Quinn, Byng and Griffiths13 Ethical review was provided by the Central London Research Ethics Committee. A Patient Involvement (PPI) group supported the study throughout.
Participants
Participants were recruited through primary care, supplemented by secondary care. There were nine participating surgeries in London and six in South West England. The Quality Outcome Framework (QOF) mental health registers were used to identify eligible individuals, who were sent letters by their primary care surgery (n = 713). The study inclusion criteria were:
primary diagnosis of schizophrenia, bipolar disorder or other psychoses (severe depression with psychosis, delusional disorder, schizoaffective disorder)
age 16–65 years
contact with primary or secondary care for mental health support for at least 2 years
English speaking.
The second stage of recruitment involved contacting potential participants through secondary community mental health teams, who approached patients they deemed eligible using packs provided by the research team (n = 154). The same eligibility criteria applied, with one addition: people had to be registered with a general practitioner (GP) to participate.
Expressions of interest were returned by post (n = 207, 29%): 165 via primary care; 33 via secondary care; 9 unknown. The study team screened by telephone to confirm diagnosis: 17 did not meet study criteria; 18 withdrew consent to participate; 5 could not be contacted; 8 did not attend interviews; and 2 lacked capacity to give full informed consent. Finally, 7 people were excluded at the analysis stage because of excessive missing network data (n = 57 excluded in total). The final study population included 150 individuals, 75 from each site.
Data collection tools
The study collected egocentric network data for people, places and activities; to provide maximum potential diversity in networks, the name-generator approachReference Campbell and Lee14 was used, with no limit on the number of contacts that could be mentioned. A bespoke personal well-being network (PWN) mapping schedule was developed using one-to-one consultations with 29 participants with SMI to produce a pilot measure. The tool was refined using a 3-stage iterative pilot with 12 participants with SMI, recruited from several mental health resource centres run by a third-sector provider. The final draft was piloted by members of the PPI group. Piloting improved face validity and minimised cognitive load through development of visual data collection procedures, improved interview ordering, and allowed us to manage interview length by dropping unnecessary questions.
The PWN mapping tool included open-ended name generator questions, which were used to map all social ties, meaningful activities/hobbies and place connections which participants currently and regularly (as defined by the participant) interacted with and which they felt had an impact on their well-being.Reference Pinfold, Sweet, Porter, Quinn, Byng and Griffiths13 For each person, place or activity mapped, cards were completed to record attribute data such as frequency and duration of connection. Closeness maps were drawn by participants to indicate which social ties they were emotionally closer to. On the same maps, structural social network data were collected by drawing alter–alter ties (social ties that know each other), and interconnections between social ties, places and activities were also recorded on cards. The resulting network was conceptualised as an egocentric multilevel PWN that included both strong and weak ties. Data were also collected on well-being, using the self-rated impact of each network connection and the Short Warwick-Edinburgh Mental Wellbeing Scale (SWEMWBS);Reference Stewart-Brown, Tennant, Tennant, Platt, Parkinson and Weich15 on social capital, using the Resource Generator UK (RG-UK);Reference Webber and Huxley16 and on current physical health and social functioning, including perceived social support, using the Dartmouth COOP Charts.Reference Eaton, Young, Fergusson, Garrett and Kolbe17
Analysis
Network data were analysed using UCINET for Windows, version 6, and IBM SPSS Statistics for Windows, version 21.0. A network typology approach was used, with reference to other mental health studies,Reference Palumbo, Volpe, Matanov, Priebe and Giacco18 to assess how places and meaningful activities combine to provide a context for how social networks are understood. This allowed for an examination of patterns in connectedness. Forty-eight PWN variables from the social tie, place and activity data were used to develop network types; this number was reduced from 61 by removing highly correlated variables.Reference Pinfold, Sweet, Porter, Quinn, Byng and Griffiths13 The variables included type of connection (e.g. number of each type of relationship, activity and place), frequency of connection, duration of connections, self-rated impact of each connection and emotional closeness to social ties. Social network density was also included. Agglomerative clustering–iterative creation of clusters of variables which occurred together in the data-set–produced 3 clusters across the 150-case data-set, which were explored descriptively and named by examining characteristics of commonalities within each cluster. Finally, k-means clustering was used to assign individual participants to the cluster they fitted most closely.
Differences across the network in access to social capital, well-being, employment status, age, gender, diagnosis and mental health service use were assessed. To assess how social capital resources were accessed within these PWNs, and how reliant participants were on practitioners for these resources, a linear regression was performed on the log-transformed variable for the mean percentage of social capital resources that were accessed from health and social care practitioners. The RG-UK includes data on which relationships social capital is accessed from. For this study, a column was added for practitioners. The dependent variable for this regression was calculated by dividing the total resources accessed from practitioners by the total number of resources accessed from all relationships, and was log-transformed because of its non-normal distribution.
Results
The study participants were a cohort of people with SMI registered with a GP (Table 1). They were not a representative sample of people with SMI but a heterogeneous group: 31% were from ‘Other’ ethnicities (see online Table DS1 for a breakdown of ethnic groups); 57% were male; the mean age was 46 years; 15% were in full-time employment and 14% in part-time employment; and 39% were receiving mental health support entirely through primary care.
Table 1 Participant characteristics across network types

Personal well-being networks
Three PWN types were identified in the study cohort. Table 1 gives the significant differences in participant characteristics that were identified among the different types, and Table 2 summarises the significant differences in social tie, place and activity data.
Table 2 Summary of network characteristics across network types

The ‘formal and sparse’ network type was assigned to 31.3% of participants. This network type describes a cluster of variables that contains fewer social ties compared with the other two types, with a higher proportion of practitioner contacts, more time spent at home, fewer community place connections and lower engagement in meaningful activities. Participants with this network type were significantly older and more likely to be male rather than female; to be receiving long-term sickness/disability benefits; to have a diagnosis of schizophrenia or psychotic disorder; and to be managed in secondary rather than primary care.
The ‘family and stable’ network type was assigned to 32% of participants. This network describes people with relatively higher numbers of family and friend relationships, and more emotionally close and stable social ties. These participants spent most of their waking time at home but also had a number of community place connections and engagement in meaningful activities. The group with this network type had the highest proportion of female and White British participants, people with a diagnosis of bipolar disorder or manic episodes and people in full- and part-time employment; as well as the highest proportion of primary-care-only mental health management.
The ‘diverse and active’ network type was assigned to 36.7% of participants. This network type involves more social ties overall than the other two PWNs and more diversity in relationship type, including higher numbers of weak ties such as colleagues, acquaintances and neighbours. These participants spent less waking time at home, were connected to more community places, and engaged in higher numbers of meaningful and social activities compared with the other two types. People with diverse and active networks were significantly younger, with higher levels of education/training qualifications and more volunteering experience.
Table 2 shows the variation within as well as among these three network types; notably, there is overlap between the numbers and types of social tie, place and activity connections that participants have recorded. For example, the smallest two diverse and active networks each had 9 social ties, whereas the largest formal and sparse network had 30. In this formal and sparse network, formal practitioner ties comprised 11 of the 30 social relationships, and the participant was connected to fewer places and engaged in fewer activities than average in the study population, none of which were social. The social ties in the two smallest diverse and active networks were primarily friends and wider contacts such as acquaintances or colleagues, and in both cases the participants had higher-than-average connections to community places and engagement in meaningful activities. The combination of activity and place variables with social tie data has an impact on the resulting network cluster description.
Health, well-being and PWN satisfaction
Differences in mental well-being (SWEMWBS) scores were small but significant across network types (Table 3), with the lowest mean well-being scores in the formal and sparse networks, and the highest in the diverse and active networks. Well-being scores varied within each network type, for example, there was a range of 7–30 within the family and stable networks.
Table 3 Social capital, wellbeing, functioning and satisfaction across network types

COOP, Dartmouth Primary Care Cooperative Information Project; RG-UK, Resource Generator UK; PWN, personal well-being network; SWEMWBS, Short Warwick-Edinburgh Mental
Wellbeing Scale.
a. Lower COOP scores indicate better functioning (e.g. better quality of life).
Quality of life, as measured by the COOP Dartmouth scales, did not differ significantly among network types, and showed high variation within each type. Quality of life was related positively to well-being score (r = 0.643, P < 0.001). Self-rated overall health did differ significantly across network types, being lowest in the formal and sparse type and highest in the diverse and active type. Access to social support was also significantly different among types, with the highest social support found in family and stable networks, and similar scores in the other two types.
Despite differences in these measures among network types, participants’ satisfaction with their current PWN was generally high, and did not differ significantly among network types. Higher satisfaction was associated with having more connections with friends (r = 0.37, P = 0.01), family (r = 0.19, P = 0.02) and practitioners (r = 0.21, P < 0.01), but not with wider contacts. It was also positively correlated with well-being (r = 0.36, P < 0.001), quality of life (r = 0.41, P < 0.001), social support (r = 0.37, P = < 0.001) and overall health (r = 0.33, P < 0.001).
Participants were also asked to rate the impact of their connections on their own well-being. The majority of social ties and place connections were rated as having a positive impact, and this did not differ significantly among types; however, participants with formal and sparse networks rated a significantly lower proportion of their activities/hobbies as having a positive impact on their well-being compared with the other two types.
Role of practitioners in networks
We identified network differences in care setting and experiences of in-patient admission (Table 1). Significantly higher sole primary care mental health management was found in participants with family and stable networks, as well as fewer reported psychiatric in-patient admissions, whereas those with formal and sparse types had higher levels of secondary care contact.
GPs and mental health and social care professionals were present in 97.8% of PWNs, and 22.7% of participants placed a practitioner in their ‘inner circle’ of emotional closeness on their closeness maps. Although this did not differ significantly among network types, we did find that where a practitioner first appeared on the closeness map differed significantly. On average, the first mentioned practitioner was closest to the participant in the diverse and active networks, and least close in family and stable networks (F(2,147) =4.10, P = 0.02).
Access to social capital resources
Variations in access to social capital (Table 3) were found not only in the levels of social capital that individuals could access, but also in the sources of provision. On average, a significantly higher proportion of social capital resources were provided by colleagues in those with diverse and active networks (8.5%), compared with family and stable (5.5%) or formal and sparse (2.7%) networks (F(2,147) = 3.064, P = 0.05). In addition, the mean percentage of social capital resources provided by practitioners was significantly higher in those with formal and sparse networks (18.3%) than those with diverse and active (10%) or family and stable (2.8%) networks (F(2,147) = 9.299, P < 0.001). No significant differences were found in the proportions of social capital resources provided by immediate family, wider family, friends, neighbours or acquaintances.
A higher proportion of social capital provided by practitioners was correlated with lower amounts of social capital overall (r = −0.231, P < 0.001). Thus, we examined which participants had the highest reliance on practitioners for social capital. Significant differences were found (Table 4); 35.8% of variance was explained by the model, which showed that participants from ‘Other’ ethnicities, and those with no formal education, with less stable (temporary) housing, in secondary care and receiving long-term sickness or disability benefits had significantly higher proportions of social capital provided by practitioners (F(2,99) = 6.156, P < 0.001). There were no significant differences in age, diagnosis, network type, years since last admission, overall RG-UK score and SWEMWBS score. This model is summarised in Table 5. Indicators of disadvantage, rather than PWN variables, were significant in explaining variance in reliance on practitioners for social capital resources.
Table 4 Differences in access to social capital resources from health and social care practitioners

SWEMWBS, Short Warwick-Edinburgh Mental wellbeing Scale.
a. Data available for 115 participants only.
Table 5 Variance in percentage of social capital resources accessed from practitioners: multiple regression resulta

a. Adjusted R 2 = 0.35S (35.8% of variance explained).
Contextual impact of adding place and activity data to social networks
Social network diagrams for this study were produced initially using social tie data alone, and then with the addition of place and activity information. In Fig. 1, a formal and sparse network type is presented. The social network is small, and the social ties are primarily neighbours and mental health professionals (Fig. 1(a)). The person appears to be socially isolated. With the addition of place and activity data (Fig. 1(b)), some context is provided. Home is a dominant space where most of the person's waking time is spent and where most activities take place. There are no regular visitors to the home. However, if practitioners were to examine the network for potential opportunities for growth and development, they would find that there are places, such as the gym or park, that are linked to activities (keeping fit and walking), which could provide starting points for network development conversations. In Fig. 2, a diverse and active network type is presented. The social network has a variety of connections (Fig. 2(a)), and the addition of place and activity (Fig. 2(b)) provides context for these relationships, highlighting the importance of volunteering and football as routes through which a large and diverse social network has been built.
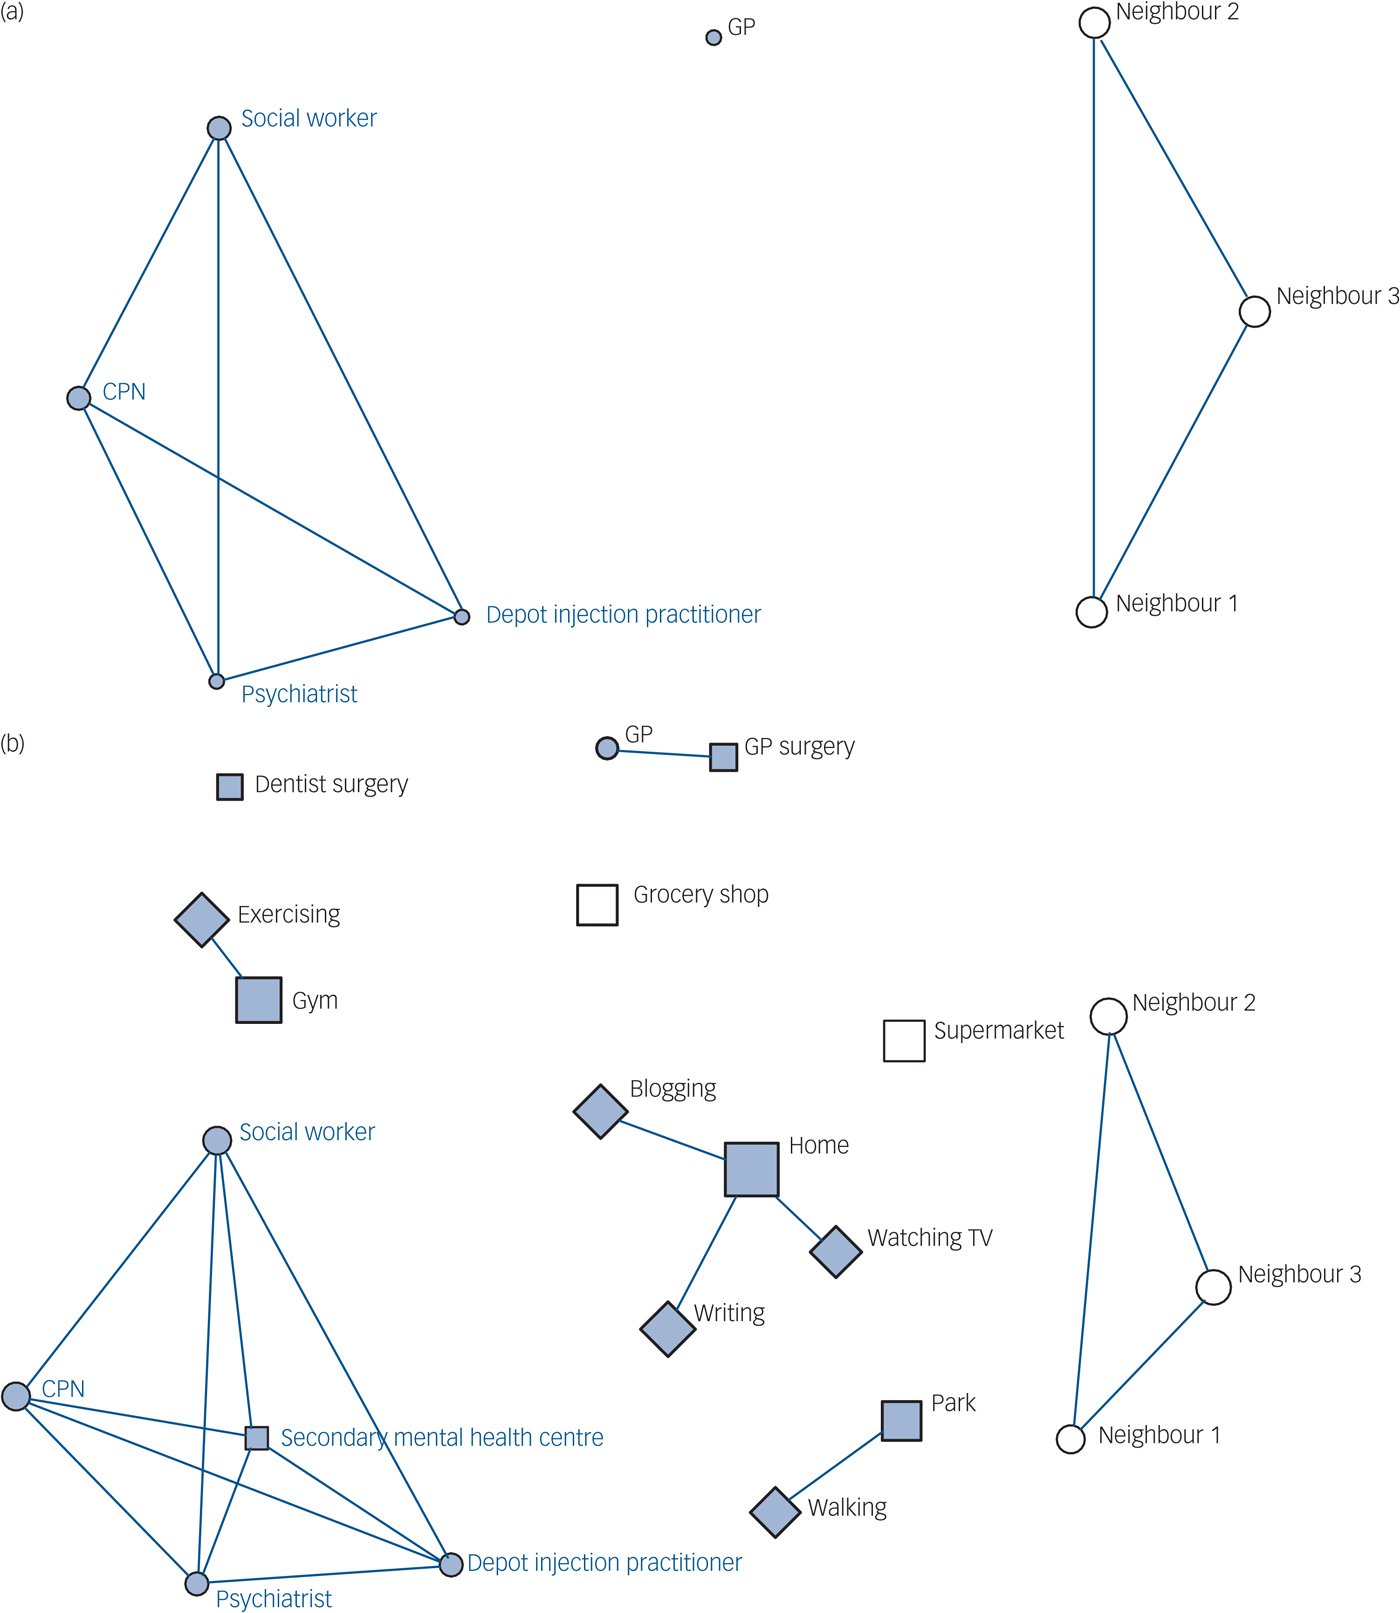
Fig. 1 Comparison of (a) social network (people only) with (b) personal well-being network (people, place and activity connections) for a formal and sparse network type (7 social ties).
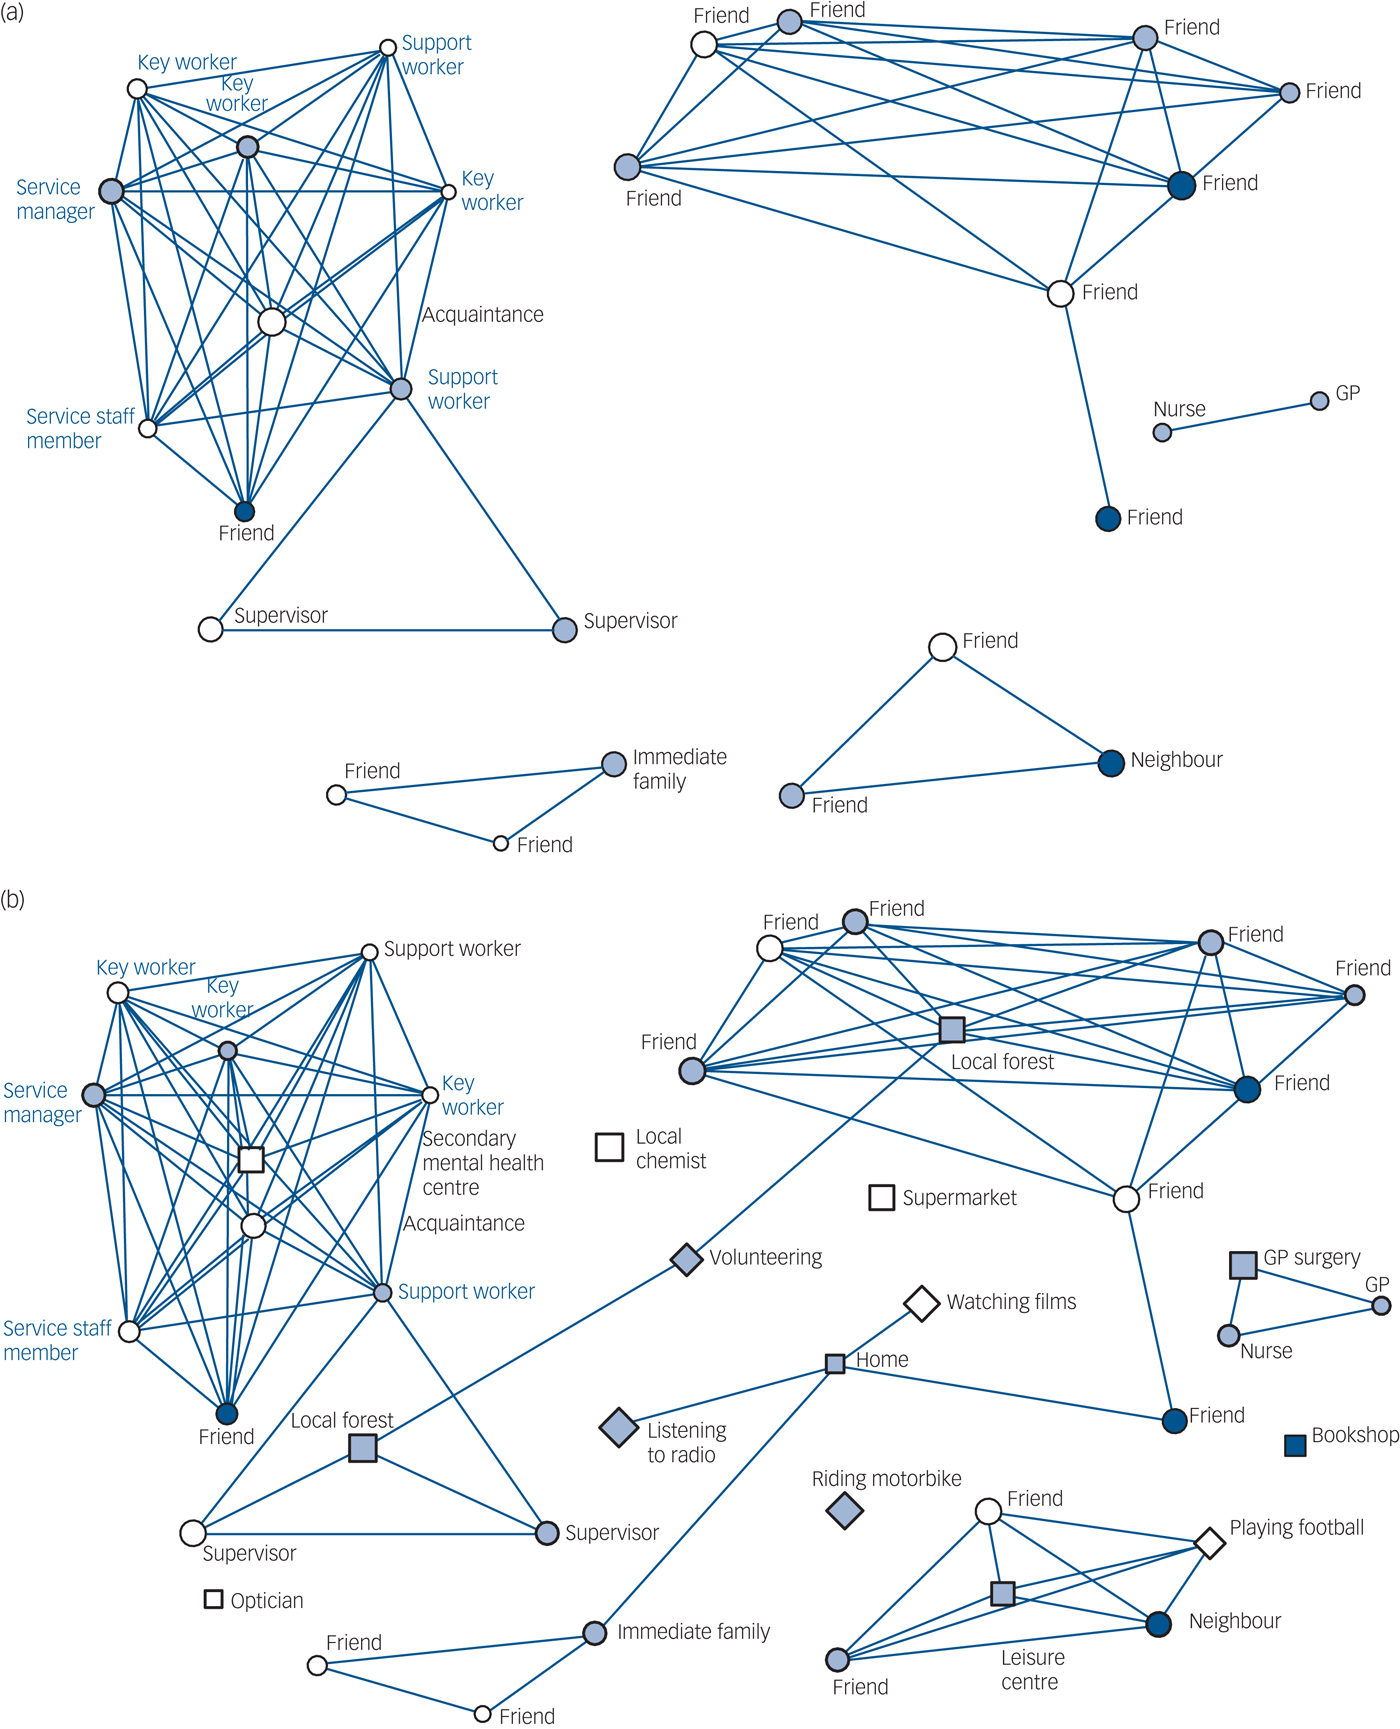
Fig. 2 Comparison of (a) social network (people only) with (b) personal well-being network (people, place and activity connections) for a diverse and active network type.
Discussion
The personal well-being network approach
This study presents a methodological variation on social network mapping and aims to include place and activity dimensions in discussions about mental health recovery and connectedness. Most mental health social network studies to date have focused primarily on the number of social contacts available to people with SMI,Reference Palumbo, Volpe, Matanov, Priebe and Giacco18 linking social relationships with level of social support, and assessing the network for associations between factors such as number of social contacts and hospital admission.Reference Becker, Thornicroft, Leese, McCrone, Johnson and Albert2 The varying methods used make comparisons between studies difficult, and normative estimates may be inappropriate; the ideal network size for any individual is likely to depend on a range of factors that change over time. This study offers empirical support for expanding the concept of ‘social network’ in recovery-oriented research to include important places and meaningful activities as key dimensions.Reference Priebe, Omer, Giacco and Slade11 People can feel connected to these places and activities and use them to manage well-being, thereby providing opportunities to address social isolation and loneliness.
The cluster analysis identified three distinct network types within the study population. Similar to those found by other studies, the PWNs we identified can be used to plan potential interventions.Reference Parsfield19 However, the clusters (types) of network identified in our study are unique because they include place and activity data that provide contextual depth for the social networks mapped. A few other studies have also created typologies based on social network data alone. For example, one study described typologies in relation to isolation, looking at socially isolated individuals, groups and locally isolated individuals from a housing estate in London.Reference Parsfield and Yates20 Another, more similar to our analysis, identified family, friend, diverse and restricted network types in a general population study of older people (aged over 60) in the USA.Reference Fiore, Antonucci and Cortina21 Both of these studies suggest that network analysis can support service delivery and provide practical benefits.
A key finding was the heterogeneity of the PWNs that we mapped.Reference Pinfold, Sweet, Porter, Quinn, Byng and Griffiths13 For example, the study found that diagnosis was not significant in explaining the variance in these types; instead, formal education, housing status, whether participants were living alone or not, and whether they were receiving long-term sickness or disability benefits significantly explained variation in network type. PWN mapping allows comparisons of outcomes among types; this can be used to identify participants who have potentially different care needs, on the basis of the composition and quality of their connections. It is also important to emphasise that there was great variation within each of the three types, in both connectedness and well-being. Mapping an individual's PWN could support person-centred approaches, both for understanding individuals’ decisions and co-producing plans to change networks in ways that enhance recovery and well-being. This focus on context is supported by the literature on long-term condition management, which emphasises the importance of social networks for understanding processes of self-care and chronic illness management across the community.Reference Vassileu, Rogers, Sanders, Kennedy, Blickem and Protheroe22
Despite the consistent findings that the social networks of people with SMI are smaller and of poorer quality than those of the general population, social network development is not promoted directly in National Institute for Health and Care Excellence (NICE) clinical guidelines. The Connecting People intervention, together with research on volunteering, personal budgets and employment, is building the case for a greater focus on the social aspects in psychiatry.Reference Webber, Reidy, Ansari, Stevens and Morris23, Reference Priebe, Burns and Craig24 The present study has shown that aspects of place and activity have a significant impact on social network size and access to social capital within a population of people with SMI.Reference Pinfold, Sweet, Porter, Quinn, Byng and Griffiths13
Social capital access and practitioner roles
Social capital has been defined by several authors as the resources embedded in social networks, with an emphasis on the importance of resources–such as power, wealth, knowledge, skills and influence–to an individual.Reference Webber, Reldy, Ansarl, Stevens and Morris25 This study observed the vital role of practitioners in PWNs. Practitioners were involved in all network types and provide access to some important resources for people with SMI, albeit at low levels. Diverse and active networks placed practitioner relationships nearer to them in terms of emotional closeness, consistent with research on recovery, showing that strong therapeutic alliances are vital.Reference Le Boutillier, Leamy, Bird, Davidson, Williams and Slade26 The study found that for people experiencing higher disadvantage, such as unstable housing and no formal education, practitioners were key sources of social capital, providing bonding and bridging connections in particular,Reference De Silva, McKenzie, Harpham and Huttly6 despite overall providing fewer resources than other relationship types. Without practitioners, some people with SMI would have extremely limited access to social capital. People with formal and sparse networks, in which practitioners were a key feature, tended to have lower overall health scores and a lower proportion of their activities generating well-being. The results suggest that people who are more reliant on practitioners for social capital tend to have fewer other resources available to them, regardless of network type. This is reflected not just in their smaller social networks, but in their place connections, which are dominated by mental health service settings, and in a lack of engagement in meaningful activity. This group has other disadvantages identified by the regression result; the structural disadvantages might make network development more challenging, but they also suggest that this should be a priority group for social interventions. These participants had lower overall social capital; practitioners were not an adequate replacement for the resources that would be provided by a more extensive social network, and such replacement would be less sustainable than supporting people to develop their own networks through engagement in meaningful activities and community place connections.
Mapping PWNs may help the clinician to work with individuals to understand how their connections developed and how they affect well-being, as well as planning for future changes and identifying potential ‘building blocks’ for network growth.Reference Pinfold, Sweet, Porter, Quinn, Byng and Griffiths13 Considering well-being rating data alongside visual network diagrams may also support individualised clinical decisions in relation to therapeutic resource allocation: for example, who needs more practitioner support or less, and to achieve which social and clinical goals? Well-being network mapping offers clues to how people integrate different aspects of identity with managing SMI, and opens up conversations to empower the individual and generate hope; this places the individual at the centre of the process and is consistent with recovery-focused practice. Like traditional diagnostic models, well-being mapping could provide a framework for allocating clinical resources to support recovery journeys.
Well-being and SMI
Well-being is an important public health indicator, and enhancement of well-being is a goal of many programmes seeking to improve quality of life.Reference Smith, Yeomans, Bushe, Eriksson, Harrison and Holmes27 Research has shown that people with chronic health problems such as SMI can have high levels of well-being.Reference Weich, Brugha, King, McManus, Bebbington and Jenkins28 Less is known about how to enhance well-being where it is lacking. This study approached the assessment of well-being in two ways: first, using the SWEMWBS;Reference Stewart-Brown, Tennant, Tennant, Platt, Parkinson and Weich15 and, second, using self-report well-being ratings for all connections to people, places and activities. Compared with mean SWEMWBS population data for the general public in England (25.3),Reference McFall and Garrington29 levels of well-being in the sample were lower (22.3); however, it is the variation within network types that is also important.
We conceptualised our network approach as a PWN, because participants were asked during the mapping process to identify connections that were important to their well-being, and because participants found well-being to be the most useful and best- understood term to encompass a sense of mental and physical health. The study found self-reported well-being ratings of connections to be, on the whole, positive. Participants tended to value the connections they had, even where these were limited or difficult.Reference Leamy, Bird, Le Boutillier, Williams and Slade12 A self-rating of well-being is necessarily subjective and limited, but understanding perceptions of well-being could be useful for practitioners in helping individuals to identify barriers to network development. Using this approach, we also found that different places and activities were important to the well-being of different people. This supports a personalised approach to network interventions, rather than a one-size-fits-all view that emphasises more social ties being better for everyone: for some, engagement in meaningful activity and addressing barriers to community place connection could be more beneficial than a focus purely on building social ties for their recovery. The finding that well-being varies within and among network types also supports this observation; diverse and active networks could be stressful to maintain, whereas family and stable networks offer support but may also present conflicts in familial relationships. This is consistent with research showing that people with SMI may have few social contacts but not feel lonely.Reference Giacco, Palumbo, Strappelli, Caatapano and Priebe30
Study limitations
The pilot study did not contain a representative sample of people with SMI and only covered two locations. A different sample may have led to different network types being produced. The important finding is not only the three PWN types that were identified in this particular study, but also how this mapping approach can identify different well-being networks that may be clinically useful in terms of supporting recovery and person centred planning. The study did not look at change over time in PWNs, or at online versus offline connections; these, as well as collecting clinical outcome data, would be recommendations for further research.
Name-generator approaches to social network mapping have been criticised for being too costly and time-intensive to administer. Adding place and activity adds to participant interview load. Any network study has to define boundaries through the careful selection of questions. In the pilot study, name generation was based on eliciting all the connections that supported well-being; the maps revealed more positive activity and place connections than negative or neutral ones. Further work is needed to refine questioning to elicit negative ties.
Finally, it is important to acknowledge that network typology studies produce overlap in the network types identified. The types are not definitive categories; rather, they are useful groupings that help us to explore network data. The three types we found in this study are relative to each other–relatively diverse, relatively sparse, and so on–and mapping in different samples may produce a different number of types with different key features, although we noted consistency between our study and others.Reference Fiore, Antonucci and Cortina21
Implications for policy
The study was designed against a policy background and the search for solutions to major mental health challenges: parity of esteem between mental health physical health; the large excess mortality gap for people with SMI; persistent barriers to recovery fuelled by stigma and discrimination; and service reconfigurations, particularly the discharge of people with SMI from secondary to primary care, with concerns about the capacity of GPs to provide specialist mental health support. The PWN approach was thus influenced by research on well-being, recovery, physical health inequalities, social exclusion, social capital and social support, using a social network framework. Our findings suggest that a broader approach to social network mapping might provide some routes forward for mental health professionals when assessing how to intervene and help support change in social networks. Identifying individuals who are particularly reliant on practitioners for social resources might be a useful strategy, as these individuals may particularly benefit from network development support. Further work is needed to assess whether PWNs could be developed into an intervention to support the delivery of recovery-focused practice and improve outcomes.
Funding
This project was funded by the National Institute of Health Research (NIHR) Health Services and Delivery Research programme (project number 09/1801/1069). The views and opinions expressed therein are those of the authors and do not necessarily reflect those of the HS&DR Programme, NIHR, NHS or the Department of Health. Professor Byng is supported by the National institute for Health Research (NIHR) Collaboration for Leadership in Applied Health Research and Care South west Peninsula.
Acknowledgements
We thank the study Patient and Public involvement group, other research team members including Dr Chris Griffiths, Dr Cath Quinn and Julie Billsborough, and all the research participants who took part. The study was coordinated at Rethink Mental Illness initially, and moved to the McPin Foundation, a mental health research charity cofounded by Dr Pinfold part way through the study.
Supplementary material
Supplementary material is available online at https://doi.org/10.1192/bjp.bp.117.203950.


 Open access
eLetters
No eLetters have been published for this article.