


Childhood overweight (BMI Z-score >1·28) and obesity (BMI Z-score >1·88) have become a global epidemic( Reference Meigen, Keller and Gausche 1 – Reference Wijnhoven, van Raaij and Joop 3 ) affecting already about 41 million children under the age of 5 years( 4 ). A large number of them live in low- or middle-income countries like the Asian region( 4 , Reference de Onis, Blossner and Borghi 5 ); in 2014, 48 % of overweight children aged under 5 years lived in Asia and 25 % in Africa( 4 ). In Europe, prevalence rates ranged from 18 % (Belgium) to 57 % (Greece) for overweight and from 6 % (Belgium) to 31 % (Greece) for obesity( Reference Wijnhoven, van Raaij and Joop 3 ), while in Germany about 15 % of the children are overweight and 5 % are obese( Reference Lange, Butschalowsky and Jentsch 6 ). Consequently, nearly 1·9 million children and adolescents in Germany are affected by overweight and 800 000 by obesity( Reference Kurth and Schaffrath Rosario 7 ).
This makes overweight and obesity a major global and even national public health concern, since they cause numerous sequelae like impaired glucose tolerance, hypertensive blood pressure levels, dyslipidaemia and arterial stiffness( Reference Körner, Kratzsch and Gausche 8 , Reference Cote, Phillips and Harris 9 ), as well as a massive economic burden since those sequelae may lead to a higher usage of health-care services especially in later life. Co-morbidities are also a major problem in overweight and obese German children and adolescents. The (pre)metabolic syndrome (hypertonia, dyslipidaemia, insulin resistance, hyperuricaemia), orthopaedic and psychosocial diseases( Reference Wabitsch 10 ) and impaired glucose tolerance at the beginning of puberty are the most prevalent co-morbidities in Germany( Reference Wabitsch, Hauner and Hertrampf 11 , Reference Wiegand, Maikowski and Blankenstein 12 ). Furthermore, it is assumed that half of obese German schoolchildren are already affected by obesity-associated sequelae( Reference Wabitsch, Kunze and Keller 13 ).
The development of overweight and obesity can be promoted by the obesogenic environment, which Swinburn et al. have defined as ‘sum of influences that the surroundings, opportunities, or conditions of life have on promoting obesity in individuals or populations’( Reference Swinburn, Egger and Raza 14 ). Increased risk for overweight and obesity is associated with low socio-economic status( Reference Wijnhoven, van Raaij and Yngve 15 , Reference Wabitsch, Moss and Kromeyer-Hauschild 16 ), a sedentary lifestyle combined with consumption of energy-dense foods, and multiple genetic factors( Reference Stunkard, Foch and Hrubec 17 ). In Germany Lange et al. ( Reference Lange, Plachta-Danielzik and Landsberg 18 ) identified that children who live in families with low income, a limited living space per person, low parental educational level and lower degree of professional education as at risk for becoming obese. In industrialized countries, the risk rises when the socio-economic status is low whereas developing countries show the opposite situation( Reference Lange, Butschalowsky and Jentsch 6 , Reference Lange, Plachta-Danielzik and Landsberg 18 ). Evaluating the course of the prevalence rates, we found that since 1980 until 2000 there has been a steady and dramatic increase in the prevalence of overweight and obesity among children and adolescents in Germany and the USA( Reference Meigen, Keller and Gausche 1 , Reference Lobstein, Baur and Uauy 19 ). Against expectations, this constant upward trend started to plateau and stabilize between 2000 and 2004 in the industrialized countries like Germany, the USA and the UK( Reference Wabitsch, Moss and Kromeyer-Hauschild 16 , Reference Lange, Plachta-Danielzik and Landsberg 18 , Reference Blüher, Meigen and Gausche 20 – Reference Ogden, Carroll and Lawman 22 ). Blüher et al.( Reference Blüher, Meigen and Gausche 20 ) showed that the prevalence of overweight and obesity stabilized at a high level and even decreased in the younger age group (4–7·99 years) between 2004 and 2008. This has been demonstrated for girls and boys.
As published previously, our database CrescNet is an evidence-based auxologic collaborative network which connects 247 German paediatricians throughout the country and collects measurements of body weight and body height in a standardized manner( Reference Blüher, Meigen and Gausche 20 ). This vast amount of data allows an analysis that can be seen as representative for Germany and represents a unique tool for cross-sectional and longitudinal analyses of growth and weight changes.
Our aim in the present study was to evaluate whether the trend of stabilization for prevalence of overweight and obesity in all age groups( Reference Blüher, Meigen and Gausche 20 ) has continued or even led to a decline in prevalence. This was performed for all children together and separately for age groups and genders. The major hypothesis was that prevalence rates of overweight and obesity declined over time. Second, we hypothesized that prevalence rates increased with rising age of the subjects.
Subjects and methods
Data collection
Skilled staff measured children’s weight and height according to standardized procedures during routine examinations, screening examinations and other paediatric consultations( Reference Meigen, Keller and Gausche 1 , Reference Blüher, Meigen and Gausche 20 ). Body weight was quantified with the help of medically calibrated scales and subjects were required to wear only light underwear and no shoes. Body height was measured with help of a rigid precision instrument as required in the CrescNet cooperation agreement to ensure identical conditions. All data were transferred pseudonymously on a quarterly basis (CrescNet-Client, VPN, direct access via the network of the university, bar code label or USB flash drive) to the CrescNet database, which is based on the PostgreSQL database management system( Reference Blüher, Meigen and Gausche 20 , Reference Hoepffner, Pfaffle and Gausche 23 ). For scientific analysis, the data were used anonymized( Reference Hoepffner, Pfaffle and Gausche 23 ). Every participating hospital or doctor’s office informs parents and guardians by placard and leaflet of the pseudonymous use of their children’s data by CrescNet. If parents and guardians do not agree to use of their children’s data, they have the option to inform their paediatrician to prevent the transfer or use the contact details and address provided in the leaflet to erase the already transmitted data.
Study population
The study population had a mean age of 8·2 years and consisted of 326 834 children, which included 170 330 (52 %) boys and 156 504 (48 %) girls. We divided our subjects into three age groups: 4–7·99 years (n 184 697), 8–11·99 years (n 76 120) and 12–16 years (n 66 017). The data were extracted from the CrescNet database and can be seen as representative for Germany as they were collected by 247 registered paediatricians from all over Germany during routine check-ups (all German children are supposed to see their paediatrician at certain points in time for check-up examinations) or other visits. Inclusion criteria were age between 4 and 16 years, data from German paediatricians, and measurements taken between 1 January 2005 and 31 December 2015. Criteria for exclusion were: (i) data from chronically ill children (International Classification of Diseases, 10th revision, codes: C, E20–E27, E0–E7, Q65–Q99); (ii) data from children under long-term medication (with human growth hormone, hydrocortisone, leuprorelin, levothyroxine, fludrocortisone, carbimazole, methimazole, mecasermin, octreotide, diazoxide, oestradiol, glucocorticoid, oxandrolone) which may influence weight; and (iii) data from sub-centres, medical service centres and endocrinologists. These criteria for exclusion ensure data analysis of healthy children only.
Data evaluation
BMI was computed by dividing body weight in kilograms by the square of height in metres (kg/m2). From the individual BMI values we calculated BMI-for-age Z-scores (or standard deviation scores) according to Cole( Reference Cole 24 ), using the German reference values of Kromeyer-Hauschild et al. ( Reference Kromeyer-Hauschild, Wabitsch and Kunze 25 ). The group of overweight children involves all children with BMI Z-score >1·28 (above the 90th percentile) and the group of obese children involves all children with BMI Z-score >1·88 (above the 97th percentile) as recommended by the German Obesity Society( Reference Wabitsch and Kunze 26 ). All curves and calculations were done in the statistical language R, version 3.1.2. Our calculations were performed according to Blüher et al. ( Reference Blüher, Meigen and Gausche 20 ) to provide comparability.
Trend analysis
We selected randomly one measurement per child performed by the function ‘random’ of the PostgreSQL database system. This function creates randomly for each measurement a number in the interval (0;1), we then took per patient the measurement with the highest randomly created number. This was necessary to ensure equal weighting as every child has a varying number of measured values stored in the database. First, we calculated the trends for all children over the entire time interval. Second, we analysed the disparities between three age groups. The calculations were performed separately for each gender and percentile cut-off. Prevalence rates of overweight/obesity were calculated for every single day. To straighten the prevalence rates which presented large discrepancies owing to the small number of children examined every day, we used a running mean (with a 5 % window) and a weighted spline curve with six degrees of freedom. To analyse whether there was a significant upward or downward trend, we assessed the slope within two time periods: 2005–2010 and 2010–2015. For the analysis, we did a linear regression of the unsmoothed prevalence rates for each time period separately. To evaluate the significance of the linear coefficient, we used the P value of the slope of the regression line.
Cross-sectional analysis
For the cross-sectional analysis, data from 2005, 2010 and 2015 were extracted from the database. This included a total of 99 632 children (47 949 girls and 51 683 boys), the actual distribution is shown in Table 1. The prevalence rates of 2005, 2010 and 2015 were tested against each other to detect significant changes. The rates for each year were calculated separately based on the raw values of that year along with a 95 % CI. To compare the resulting percentages for overweight and obesity we used the χ 2 test with a 5 % level of significance.
Table 1 Further stabilization and sometimes even decline of overweight and obesity prevalence rates in German children and adolescents in the years 2005 v. 2010 v. 2015
Cross-sectional analysis (n 99 632) of the overweight and obesity prevalence rates for boys (n 51 683) and girls (n 47 949) for the years 2005, 2010 and 2015 separately for each age group (4–7·99, 8–11·99 and 12–16 years). The number of subjects for each age group and year is also given.
Difference compared with 5 years previously (2010 v. 2005; 2015 v. 2010): *P<0·05, **P<0·001.
Difference compared with 10 years previously (2015 v. 2005): †P<0·05, ††P<0·001.
Results
The trend analysis shows a further stabilization in overweight and obesity prevalence rates between 2005 and 2015
Whole study population
We found a significant downward trend in prevalence rates for both genders over the whole age range between 2005 and 2010. Between 2010 and 2015 there was a significant downward trend of the overweight and obesity prevalence rates only for boys (Fig. 1(a)), whereas the girls’ data stagnated on a relatively stable level (Fig. 1(b)).
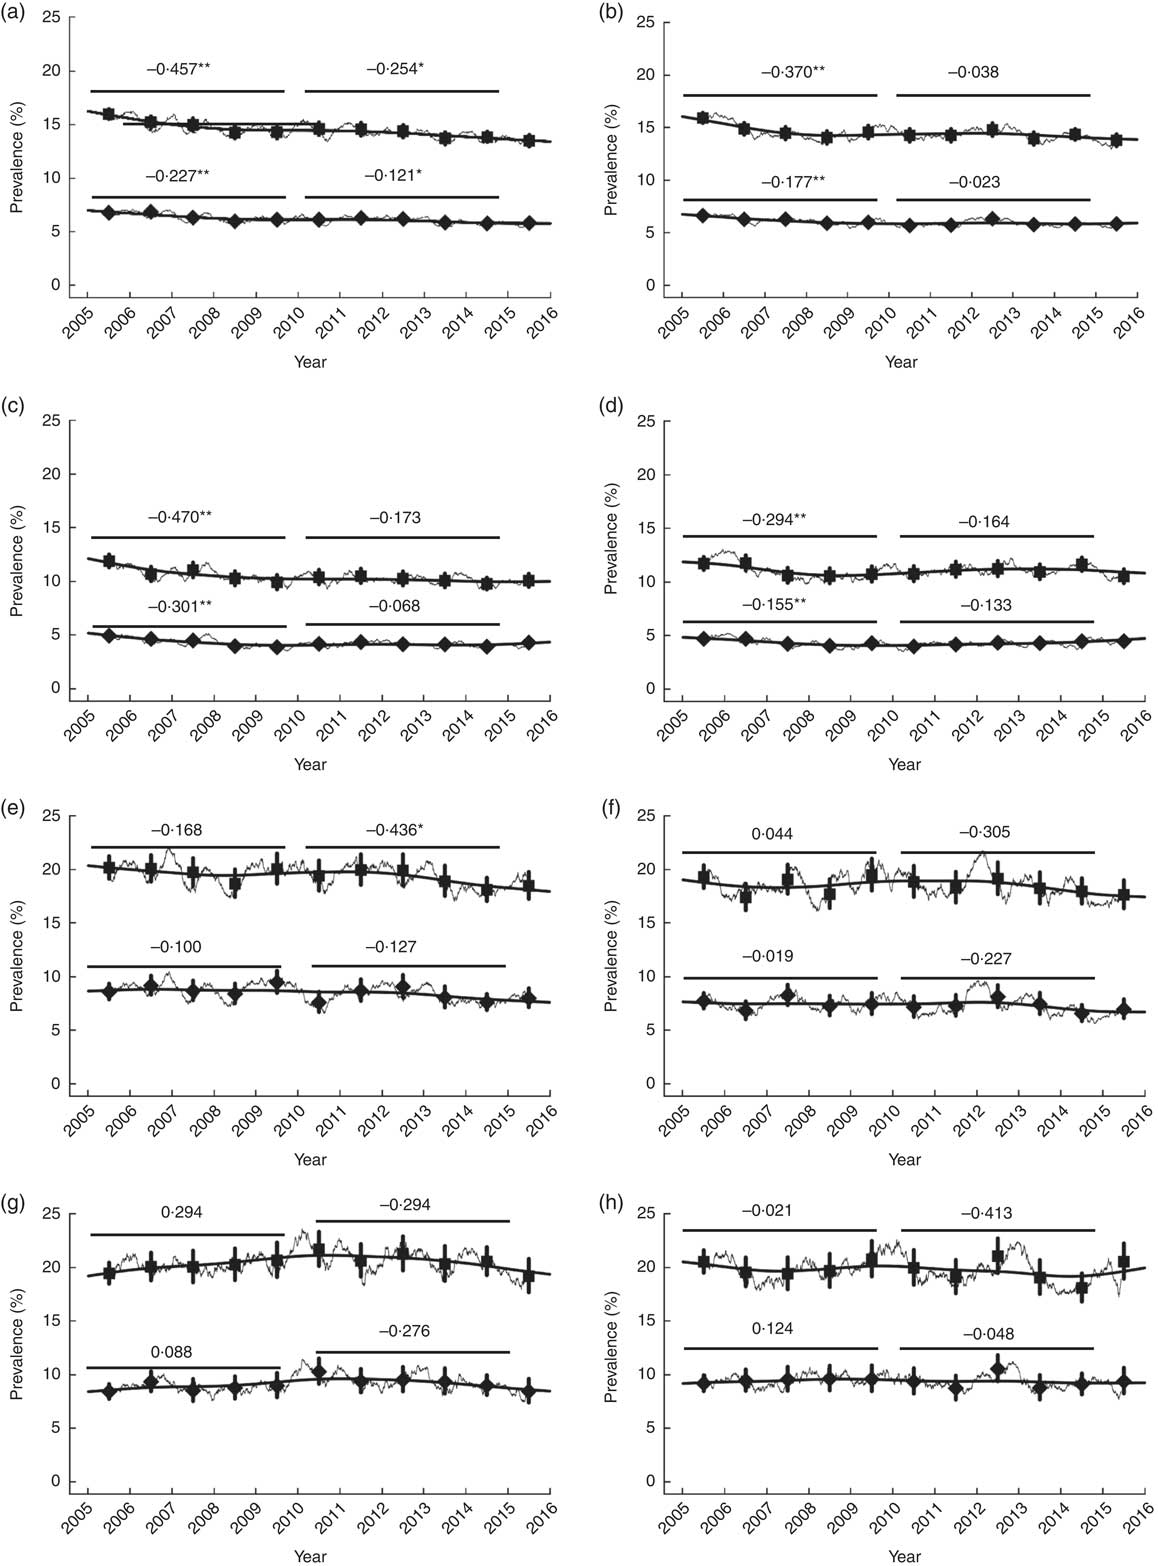
Fig. 1 Further stabilization of the prevalence rates and even a decrease of the prevalence of overweight and obesity for the younger age groups of German children and adolescents from 2005 to 2015. Trends of overweight (■, upper line) and obesity (♦, lower line) prevalence rates, with their 95% CI represented by vertical bars, between 2005 and 2015 for: the entire age group (4–16-year-old children) separately for boys (a) and girls (b); the age group of 4–7·99 years separately for boys (c) and girls (d); the age group of 8–11·99 years separately for boys (e) and girls (f); and the age group of 12–16 years separately for boys (g) and girls (h). The thin jagged lines show the calculations of the prevalence rates for every single day of the period based on raw values taken from the CrescNet database and straightened with a running mean with a 5 % window. The broad, black and smooth lines show a weighted smooth spline with six degrees of freedom. Slope is given for each age group, both genders, and every overweight or obesity group. Each slope, which is marked with black line, included and compared data of five years (2005–2010 and 2010–2015). Differences in prevalence: *P<0·05, **P<0·001
Analysis according to age and gender
We found changes in the overweight and obesity rates mostly for the younger age groups whereas the trends for the adolescents were stagnating. Other differences became apparent when evaluating the two time periods and each gender separately, in which boys showed higher change rates than girls. The corresponding slopes are stated in Fig. 1. For children aged 4–7·99 years, we found a significant downward trend for the overweight prevalence rates in both genders between 2005 and 2010 (P<0·001 (boys), Fig. 1(c); P=0·005 (girls), Fig. 1(d)). Regarding the obesity prevalence rates, the data also showed a significant downward trend for both genders (P<0·001 (boys), Fig. 1(c); P=0·020 (girls), Fig. 1(d)). From 2010 to 2015 the data revealed stable trends in both genders without statistical significance. In children aged 8–11·99 years, only overweight boys (Fig. 1(e)) showed significant changes, not girls (Fig. 1(f)). The data indicated a significant decrease in overweight prevalence (P=0·031; Fig. 1(e)), whereas the remaining prevalences showed neither a significant upward or downward trend. The prevalence of overweight and obesity in male (Fig. 1(g)) and female (Fig. 1(h)) adolescents (12–16 years) remained stable.
The cross-sectional analysis reveals stable and even decreasing overweight/obesity prevalence trends
Changes comparing the years 2005 and 2010
In boys aged 4–7·99 years, overweight and obesity rates decreased significantly in 2010 compared with 2005 (10·39 v. 11·90 %, P=0·001; 4·19 v. 4·90 %, P=0·017, respectively; Table 1). Surprisingly in adolescent boys (12–16 years) prevalence of overweight and obesity increased significantly in 2010 compared with 2005 (21·69 v. 19·50 %, P=0·018; 10·28 v. 8·40 %, P=0·006, respectively; Table 1). Young girls aged 4–7·99 years showed lower prevalence rates for overweight and obesity in 2010 compared with 2005 (10·77 v. 11·70 %, P=0·049; 3·99 v. 4·70 %, P=0·024, respectively; Table 1).
Changes comparing the years 2010 and 2015
Evaluating the changes between years 2010 and 2015, we found significant differences only for adolescent boys aged 12–16 years. Both overweight and obesity prevalence were lower in 2015 than 2010 (19·20 v. 21·69 %, P=0·031; 8·45 v. 10·28 %, P=0·03, respectively; Table 1). This withdraws the upward trend from 2005 to 2010 and leads to an overall stable trend for this age group. The prevalence rates in children aged 8–11·99 years and adolescent girls aged 12–16 years did not change significantly.
Changes comparing the years 2005 and 2015
Comparing the first and the last year of the time period, the differences between the age groups and both genders come clearer. Both genders showed significantly lower prevalence rates in 2015 than 2005 in the younger age groups, whereas the rates for the older ones did not change significantly. For boys aged 4–7·99 years we found significantly lower prevalence rates of overweight and obesity in 2015 than 2005 (10·08 v. 11·90 %, P<0·001; 4·30 v. 4·90 %, P=0·032, respectively; Table 1), as well as for overweight in boys aged 8–11·99 years (18·48 v. 20·20 %, P=0·05; Table 1). For girls, the data revealed significantly lower prevalence rates for overweight in 2015 than 2005 in 4–7·99-year-olds (10·53 v. 11·70 %, P=0·01) and a tendency to decrease in 8–11·99-year-olds (17·64 v. 19·30 %, P=0·060; Table 1).
BMI Z-score of obese children decreased between 2005 and 2015
To evaluate whether the children got heavier over the course of the study period, we analysed the differences in mean BMI Z-score between the years 2005, 2010 and 2015 along with the cross-sectional analysis of the prevalence rates. We found that in the group of obese children the mean BMI Z-score either decreased or stagnated, whereas in the group of overweight children the mean BMI Z-score either increased or stagnated. In the whole population of overweight boys and girls, BMI Z-score increased significantly in 2010 compared with 2005 (P=0·030; P=0·004, respectively; see online supplementary material, Supplemental Table 1). In 2015, overweight male and female adolescents showed a significantly increased mean BMI Z-score compared with 2010 (P=0·020; P=0·022, respectively; Supplemental Table 1). Between the years 2010 and 2015, there was a decrease in BMI Z-score for obese boys in the highest age group (P=0·006; Supplemental Table 1).
Several changes were detected while comparing 2005 and 2015. For overweight boys in the entire group and in adolescents, the data revealed an increase in BMI Z-score (P=0·002; P=0·028, respectively; see online supplementary material, Supplemental Table 1). The overweight girls showed between the same years an increase for the entire group and 8–11·99-year-olds and 12–16-year-olds separately (P<0·001; P<0·001; P<0·001, respectively; Supplemental Table 1). Within the obese, adolescent boys showed a decrease in BMI Z-score (P=0·045), while girls showed a decrease within the entire group and at the youngest age (P=0·005; P=0·013, respectively; Supplemental Table 1).
Comparison of CrescNet data with national KiGGS and SEE data
Table 2 compares data from two national databases (German Health Interview and Examination Survey for Children and Adolescents (KiGGS); School Enrolment Examination (SEE)) including measurements at two points with CrescNet data from 2011( Reference Blüher, Meigen and Gausche 20 ) and 2017. The results demonstrate that our data are in line with prevalence rates of KiGGS and SEE( Reference Kurth and Schaffrath Rosario 7 , Reference Brettschneider, Schaffrath Rosario and Kuhnert 27 – Reference Moss, Wabitsch and Kromeyer-Hauschild 30 ). Corresponding to our analysis, these surveys also reported stabilization and even a slight decrease of prevalence for younger children. In contrast to our data, KiGGS reported for the adolescents a slight non-significant tendency of increasing obesity prevalence in both genders( Reference Brettschneider, Schaffrath Rosario and Kuhnert 27 ). It has to be taken into account that height and weight values in KiGGS wave 1 were self-reported, while our data collection includes only standardized measurements performed by trained staff. Although the data of KiGGS have been corrected for bias in self-report, the slight tendency of increasing obesity prevalence could be due to underestimation of height or weight. Comparing the size of the study populations it becomes clear that we have far more subjects per age group than KiGGS (e.g. 66 017 (CrescNet) v. 4948 (KiGGS) in the group of adolescents; Table 2). The SEE has a vast population (607 444 children) but is limited to only one age group (children starting school) while our analysis includes children from 4 to 16 years of age.
Table 2 Comparison of CrescNet data and two national surveys in children and adolescents in Germany
Comparison of CrescNet data with two other large German studies (German Health Interview and Examination Survey for Children and Adolescents (KiGGS); School Enrolment Examination (SEE)). Each study is included in the table with two measurements.
‡ CrescNet data (1999–2008 and 2005–2015) indicate the span of prevalence rates from the smallest to the largest value; they do not necessarily show the chronological sequence.
Discussion
Our results demonstrate a further stabilization of prevalence rates for overweight and obesity in German children and adolescents that has been suggested by Blüher et al. ( Reference Blüher, Meigen and Gausche 20 ). For the year 2008 compared with 2004, Blüher et al. reported a significant decrease in the overweight and obesity prevalence rates for boys and girls aged 4–7·99 years while the rates for the other age groups showed no significant change and remained stable( Reference Blüher, Meigen and Gausche 20 ). Our data demonstrate that the overweight and obesity development achieved a turning point in young children and prevalence rates are plateauing in adolescents. Our data indicate a decrease in overweight prevalence especially in young children, which is in line with data from several industrialized countries( Reference Wijnhoven, van Raaij and Joop 3 , Reference Wabitsch, Moss and Kromeyer-Hauschild 16 , Reference van Jaarsveld and Gulliford 21 , Reference Koebnick, Mohan and Li 31 – Reference Wheaton, Millar and Allender 35 ). An Australian study detected significantly lower mean BMI Z-scores for its subjects within follow-up compared with baseline measurements( Reference Wheaton, Millar and Allender 35 ). Within North America, prevalence rates for obesity decreased in the USA( Reference Koebnick, Mohan and Li 31 ) and remained stable in Canada at a high level in children and adolescents( Reference Bancej, Jayabalasingham and Wall 32 ). Even in Europe the prevalence of overweight and obesity has stabilized or even decreased( Reference Wijnhoven, van Raaij and Joop 3 , Reference Wabitsch, Moss and Kromeyer-Hauschild 16 , Reference Bancej, Jayabalasingham and Wall 32 – Reference Castetbon 34 ). In Germany, an analysis of school enrolment examination data until 2008 indicated that the prevalence of overweight and obesity in children starting school did not increase and even declined between 2004 and 2008 in the majority of the German federal states (Table 2)( Reference Moss, Klenk and Simon 29 ). These findings correspond to our results.
Our data do not show a significant decrease in the prevalence of obesity in adolescents (12–16 years). These findings are in line with Blüher et al. who suggested a turning point for young German children, but not for adolescents, as their overweight and obesity prevalence rates increased between 2000 and 2004 (Table 2)( Reference Blüher, Meigen and Gausche 20 ). Recently, the German KiGGS wave 1 published updated data for prevalence rates of overweight and obesity in children (4–10 years)( Reference Brettschneider, Schienkiewitz and Schmidt 28 ) and adolescents (11–17 years)( Reference Brettschneider, Schaffrath Rosario and Kuhnert 27 ) (Table 2). Corresponding to our results, they reported a stabilization of prevalence rates in children and adolescents. However, they reported a slight non-significant tendency of increasing overweight prevalence in children and also a slight non-significant tendency of increasing obesity prevalence in adolescents. It has to be taken into account that height and weight data of KiGGS wave 1 were self-reported, while our data collection includes only standardized measurements. Although the data of KiGGS have been corrected for bias in self-report, the slight tendency of increasing obesity prevalence could be due to underestimation of height or weight( Reference Brettschneider, Schaffrath Rosario and Kuhnert 27 , Reference Brettschneider, Schienkiewitz and Schmidt 28 ). Furthermore, the CrescNet database provides longitudinal analysis as it includes annual data, in contrast to KiGGS study (baseline and wave 1) that includes only two measurement times (2003–2006 and 2009–2012).
The stabilization of overweight and obesity prevalence in our data and the data of other industrialized countries could be caused by rising awareness in the public leading to healthier lifestyles with higher consumption of fruits/vegetables and more physical activity. Furthermore, there is also more awareness of this problem in politics, schools and kindergartens.
In Germany, several national societies have started to draw attention to the health problem of obesity and gave a statement on future prevention strategies for overweight and obesity( Reference Schaller 36 ). Additionally, politicians created a national action plan (‘IN FORM – German national initiative to promote healthy diets and physical activity’) which aims to improve nutritional behaviour and physical activity by 2020( 37 ). Almost 100 projects in different fields (schools, kindergartens, etc.) have been funded by the initiative. Many schools and kindergartens have or are trying to optimize their playgrounds and address ways to motivate children and adolescents to participate in more activities like jumping, running or climbing. Besides, there have been critical opinions concerning foods sold by school canteens. Many of them sold sugar-sweetened, fatty and energy-dense foods. More recently, efforts to shift to healthier foods like fruits, vegetables and wholemeal products are being made. Within the scope of the German-wide efforts, the network for school catering (Vernetzungsstellen Schulverpflegung (VNS)) was founded in each federal state( 38 ). The network aims to improve the food supply of children and adolescents and aims to translate quality standards (according to standards of the German Society of Nutrition (DGE)) into the catering of institutions like kindergartens and schools. Furthermore, a decline in consumption of sugar-sweetened beverages within the last years supports the decrease in obesity prevalence in children( Reference Kit, Fakhouri and Park 39 ). The programme of the European agricultural ministry which started around 2007 supplies more fruits and vegetables in schools and provides additional workshops and information materials for pupils and teachers( Reference de Sa and Lock 40 ). As the overweight/obese prevalence rates still only stagnate or decrease slightly, the current prevention and treatment strategies should be more efficient. The stabilization is a positive matter of fact, but the rates have stabilized on a high level, still affecting a huge part of our youth. And as many overweight or obese children will become overweight or obese adults( Reference Farpour-Lambert, Baker and Hassapidou 41 ) we need to find ways to reduce their number. One starting point could be to increase the focus on society-related programmes rather than on individual-related programmes because many current strategies are conducted by for example one municipality, a school, a kindergarten or sometimes one federal state, and therefore are restricted to a small circle of children. Furthermore, children and families facing difficult social circumstances need increased support since the prevalence of overweight and obesity is much higher in those families than in wealthy and well-educated families( Reference Olaya, Moneta and Pez 33 ). This has also been demonstrated in Germany( Reference Kurth and Schaffrath Rosario 7 ).
Although several European studies have reported inconsistent results on the development of prevalence rates in disadvantaged families( Reference Stamatakis, Wardle and Cole 42 – Reference Kautiainen, Koivisto and Koivusilta 44 ), it can be assumed that stabilization of prevalence rates might be a result of opposing weight development in different social classes. Maybe, the children of socially deprived families got heavier while those of wealthy families got thinner, resulting in an overall stabilizing trend of overweight and obesity prevalence. As the CrescNet database does not provide data on socio-economic status of children and their families, we cannot exclude influences of social status on prevalence for overweight and obesity in our analysis. Therefore, more studies are necessary in order to investigate the influence of social factors on weight development in children and adolescents, especially in Germany, as there are no published data concerning this topic for a long time period to the best of our knowledge. So far, Lange et al.( Reference Lange, Plachta-Danielzik and Landsberg 18 ) have demonstrated that low income increases risk for overweight and obesity among German children and adolescents.
As our data and other studies do not indicate a decrease in prevalence in obesity and overweight in adolescents, it might be rational to focus further on prevention programmes targeting adolescents.
First, a strength of our study is a significant number of standardized measurements and the expanded age span of subjects comprising all children from infancy to adolescence. This makes our analysis more differentiated than other studies that are limited to one age group. Second, we were able to analyse our data for each gender and age group separately (with large numbers in every group) to examine gender- and age-specific trends more clearly. Third, we assessed the development of overweight/obesity prevalence rates for German children and adolescents comparably over an extended time period of 15 years (1999–2015), extending the time span of the preceding study of Blüher et al. with an overlap of 3 years. A limitation is that we do not follow individuals repetitively and longitudinally. In addition, our study is more physician-based than population-based because data were taken by health professionals at regular visits and therefore did not represent a random sample of children. However, the large number of individuals and the long observation period provide a robust data set and allows drawing generalizable conclusions.
Conclusion
We have observed a further stabilization of prevalence rates of overweight and obesity in all age groups and even a decrease in younger ages (4–7·99 years, 8–11·99 years). Furthermore, our data indicate that the mean BMI Z-score of obese children did not increase but even decreased between 2005 and 2015. Considering that other industrialized countries have also reported similar trends, we conclude that the epidemic of childhood overweight and obesity seems to have reached a turning point in the industrial part of the world.
Acknowledgements
Financial support: This work was supported by grants from the Federal Ministry of Education and Research, Germany (FKZ 01EO1001) (IFB Adiposity Diseases). The funder had no role in the design, analysis or writing of this article. Conflict of interest: None. Authorship: A.Ke. contributed to statistical analysis, interpretation of data, article writing, generation of the figure and tables, and literature research. C.B. and M.V. performed statistical analysis and interpretation of data, provided statistical experience, and critically revised the article. R.G. and R.P. supervised data collection in CrescNet database and critically revised the article. U.S. contributed to data interpretation, literature search, generation of the figure and tables, writing of the manuscript, and critically revised of the article. T.L., A.Ko. and W.K. contributed to interpretation of data and critical revision of the article. Ethics of human subject participation: No formal study protocol, ethics committee approval or written informed consent was required for the study, but parents and guardians, in accordance with the German data protection law, were able to refuse use of their children’s data at any point in time.
Supplementary Material
To view supplementary material for this article, please visit https://doi.org/10.1017/S1368980017002257


