


Cardiometabolic disorders in youth, such as type 2 diabetes and metabolic syndrome, have drawn increasing attention as the rise in childhood obesity has led to increases in their prevalence and incidence(Reference De Ferranti and Osganian1, Reference Lawrence, Mayer-Davis and Reynolds2). Insulin resistance (IR) is believed to be the earliest manifestation and the central driver of cardiometabolic dysfunction in children(Reference Chiarelli and Marcovecchio3, Reference Reaven4); thus, identifying children at high risk of IR is important for primary prevention of cardiometabolic diseases later in life(Reference Pereira and Ludwig5). Simple anthropometric measurements have potential clinical utility in risk stratification of children who may be at highest risk of IR and future CVD and type 2 diabetes.
BMI is the most widely used measure in clinical and public health settings to evaluate obesity status and predict cardiovascular and metabolic risk in children, and BMI assessment is recommended by the American Academy of Pediatrics for the screening of adiposity-related diseases(Reference Barton6, Reference Barlow7). However, in children, BMI is related to growth and development, and increases in BMI may reflect increases in lean mass more than fat mass(Reference Maynard, Wisemandle and Roche8, Reference Freedman, Wang and Maynard9). There is growing interest in the use of markers of central adiposity as a means of understanding metabolic pathways and health consequences of truncal fat in prepubertal children(Reference Reilly, Kelly and Wilson10–Reference Goran15), in whom the importance of central v. total fat is unclear(Reference Cameron, Jones and Griffiths11). A recent systematic review found no evidence that indicators of centrally distributed fat, such as waist circumference (WC) or waist-to-height ratio (WHtR), were superior to BMI for predicting adverse cardiometabolic risk factor profile, including IR, in prepubertal children(Reference Reilly, Kelly and Wilson10). That review, however, did not compare the performance of abdominal skinfold thickness (ASF), which, in prepubertal children, has been shown to be more strongly associated with abdominal visceral fat than BMI, WC or WHtR(Reference Liem, De Lucia and L'abee12–Reference Goran15).
To our knowledge, no studies have assessed the merit of ASF, relative to other anthropometric measures, in the prediction of IR in prepubertal children. Thus, the objective of the current study was to use receiver operating characteristic (ROC) curves to compare the screening performance of ASF, WC, WHtR and three other skinfold-thickness sites relative to BMI for detecting IR in prepubertal Colombian children.
Methods
Study population
SIMBA (Estudio Longitudinal para la Evaluación de Riesgo Cardiometabólico en Población Joven de Bucaramanga) is a population-based study of early-life cardiovascular risk factors in Colombia. The methods of the study have been published previously(Reference Villa-Roel, Buitrago and Rodriguez16). Briefly, a cohort was drawn from the 6–10-year-old population from Bucaramanga, Colombia. Study participants were restricted to children who had lived in Bucaramanga during the 12 months prior to enrolment. Children with a history of menarche and/or Tanner stage ≥2, a prior diagnosis of diabetes mellitus or other endocrine disorder, and/or previous treatment with hormones or steroids (except for sodium levothyroxine) during the last month were excluded. The study was conducted according to the guidelines laid down in the Declaration of Helsinki and all procedures involving human subjects were approved by Institutional Review Boards of the Fundación Cardiovascular de Colombia and the University of Minnesota. Written informed consent was obtained from all children and their guardians.
Sampling and recruitment
Using local city maps and local statistics, a two-stage sampling process was performed. In the first stage, neighbourhoods that had at least fifty children were randomly selected. In the second stage, up to fifty houses in each neighbourhood were selected at random. All children who fulfilled the inclusion criteria in each of the selected houses were invited to participate in the study. At recruitment each child's caregiver was interviewed face-to-face in their home by a trained interviewer using structured questionnaires that requested sociodemographic information, usual physical activity, dietary information and medical history among other factors. On the second visit, trained physicians and nutritionists at the Fundación Cardiovascular de Colombia performed a complete physical examination and fasting blood was withdrawn from all participants for the determination of glucose and insulin levels. Between July 2006 and October 2007, 1282 Colombian children aged 6–10 years were enrolled in SIMBA.
Study variables
Demographic factors such as age, sex, ethnicity (visually assessed by a trained research assistant), educational level and household income strata were collected. Height was measured to the nearest 1 mm using wall-mounted Seca 202 stadiometers (Seca, Hannover, MD, USA) and weight was measured to the nearest 0·1 kg using Tanita HS301 electronic scales (Tanita, Arlington Heights, IL, USA). Other anthropometric variables (e.g. skinfold thicknesses, waist and hip circumferences) were measured in duplicate by two independent, highly trained and standardized nutritionists following recommended protocols(17). All anthropometric variables were measured in the morning after urine elimination, with the child dressed in light clothing without shoes. BMI (kg/m2) was calculated according to the recommendations of the Centers for Disease Control and Prevention(18). Skinfold thickness measurements were taken on the right side of the body to the nearest 0·1 mm using Holtain callipers (Holtain Ltd, Crymych, UK). The ASF was taken as a vertical fold 2 cm to the right side of the umbilicus and the subscapular skinfold thickness was taken as a vertical fold 1 to 2 cm below the inferior angle of the scapula. The triceps skinfold thickness was taken on the posterior of the upper arm, halfway between the acromion and olecranon processes, with the arm held freely to the side of the body, and the biceps skinfold thickness was taken on the anterior aspect of the arm over the belly of the biceps muscle 1 cm above the level used to mark the triceps site.
Under fasting conditions (at least 10 h), blood samples were taken from the antecubital vein. Glycaemia was immediately quantified by a routine colorimetric method (Biosystems BTS-303 Photometric, Barcelona, Spain). Remaining samples were processed to obtain serum and plasma and stored at −80°C. Insulin determinations were assessed in duplicate by electrochemiluminescence immunoassay ‘ECLIA’ (Roche Elecsys 1010/2010 and MODULAR ANALYTICS E170 (Elecsys module) immunoassay analysers; Roche Diagnostics, Indianapolis, IN, USA) in one batch at the end of the study. Using this method, the reported CV for values between 6·4 and 16·1 IU/l were 9·1 % and 2·9 %, respectively. IR was estimated using the homeostasis model assessment of IR (HOMAIR) and calculated using the following formula(Reference Matthews, Hosker and Rudenski19): fasting insulin concentration (IU/l) × fasting glucose concentration (mmol/l)/22·5. IR and extreme IR were defined as having age- and sex-specific HOMAIRZ-scores greater than or equal to the corresponding 90th and 95th percentiles, respectively(Reference Matsumoto, Miyake and Yano20, Reference Masuccio, Lattanzio and Matera21).
Statistical analysis
Of the 1282 children enrolled in SIMBA, we excluded seven participants who had missing values for HOMAIR, four who had missing BMI, one who had a BMI of >5 sd from the mean and nine who did not meet the age eligibility of the study (<6 years of age). These exclusions left 1261 participants for the current analyses. Furthermore, for the calculation of mean anthropometric measures using the four repeated measures at each site, we excluded a small number of outliers (one for WC, one for biceps skinfold thickness and one for ASF) following Tukey's criteria for identifying ‘far outside’ values within each age- and sex-specific group(Reference Tukey22). This conservative non-parametric procedure identifies values outside approximately 5 sd in normally distributed populations. The intent was to exclude only values that were probable errors.
To determine the reliability of the anthropometric measures we calculated the coefficient of reliability (R), the technical error of measurement (TEM) and the intra-class correlation coefficient (ICC) for each measure. R estimates the proportion of between-subject variance in a measured population that is free from measurement error. Measures of R can be used to match the relative reliability of different anthropometric measurements, as well as of the same measurements in different observations (intra- and inter-observer)(Reference Mueller and Martorell23). R as a percentage (R %) was calculated using the following equation(Reference Ulijaszek and Kerr24):
 $${\rm R}\% \: = \:1{\rm{ - }}({{\rm TEM}^2} \:/\:{{\rm \sc sd}^2} ), \eqno\rm$$
where sd is the standard deviation of the measurement and
 $$\:{\rm TEM} = \:\sqrt {\left( {\mathop{\sum}{{{D}^2} } } \right)/2N}, \eqno\rm$$
where D is the difference between measurements and N is the number of subjects measured(Reference Ulijaszek and Kerr24). To compare TEM assessed for difference measurements, absolute TEM was converted into relative TEM ( %TEM) using the following equation:
 $$\%{\rm TEM} \: = \:(\:{\rm TEM}/\:{\rm mean})\times 100, \eqno\rm$$
where mean is the average of the actually measured anthropometric parameters(Reference Ulijaszek and Kerr24). We calculated ICC for repeated anthropometric measures within each subject using the following equation:
 $$\: {\rm ICC}= \:{\rm{within {\hbox{-} }} subject}}\,{\rm{variance}}\:/\:{\rm{total}}\,{\rm{variance}}\eqno\rm$$
All non-normally distributed variables were log-transformed. Age- and sex-specific Z-scores were calculated for HOMAIR and all anthropometric variables to account for differences due to age and sex. Z-scores were generated using the following calculation: (observed value – age- and sex-specific sample mean)/(age- and sex-specific sd). Significant differences in baseline characteristics between females and males were evaluated using the two-sample t test and Wilcoxon–Mann–Whitney test (for non-normally distributed variables). Pearson correlation coefficients were used to assess the association between the seven adiposity indices and insulin measures. Stepwise variable selection in logistic regression was employed using entry and exit criteria of P = 0·80 and P = 0·05, respectively, to select anthropometric predictor variables (including BMI, WC, WHtR, ASF and three other skinfold-thickness sites) most strongly and independently associated with IR and extreme IR.
ROC curves were used to evaluate the general performance of BMI, WC, WHtR and ASF in reflecting IR and extreme IR. The ROC curve tests the ability of a variable to predict an outcome by plotting sensitivity (y-axis) against 1 – specificity (x-axis), and it simultaneously compares these estimates across different variables. The area under the curve (AUC) determined with these ROC analyses can be used as a global measure of the overall accuracy of several anthropometric measures in screening for IR and extreme IR in children. The value of AUC varies between 0 and 1, with 0·5 indicating no predictive power and 1 indicating perfect predictive power. ROC contrast estimation procedures were used to determine improvement of AUC. We evaluated whether ROC contrast estimation differed by age (<7 years v. ≥8 years), sex or BMI (<85th percentile v. ≥85th percentile) using analyses stratified by these variables.
Finally, using multinomial logistic regression we computed odd ratios and 95 % confidence intervals of having HOMAIR ≥ 90th and < 95th percentiles, and of having HOMAIR ≥ 95th percentile, compared with having HOMAIR < 90th percentile for a 1 sd change in the anthropometric variables.
All analyses were performed using the SAS statistical software package version 9·2 and all tests of statistical significance were based on two-sided probability of P < 0·05.
Results
There were 127 children (fifty-seven boys and seventy girls) with IR (HOMAIR ≥ 90th percentile) and sixty-three of them (thirty boys and thirty-three girls) were classified as having extreme IR (HOMAIR ≥ 95th percentile). Analyses are presented with both sexes combined because there was no evidence that the findings were materially different by sex, and there was more predictive power in the combined analysis. Relevant characteristics of the study population are presented in Table 1 by HOMAIR dichotomized according to the extreme IR definition. Compared with children with HOMAIR < 95th percentile, those with HOMAIR ≥ 95th percentile had greater stature, BMI, WC, WHtR and skinfold-thickness site measures. There were no differences in age, sex or household income strata by HOMAIR cut-off.
Table 1 Characteristics of prepubertal children aged 6–10 years, Bucaramanga, Colombia
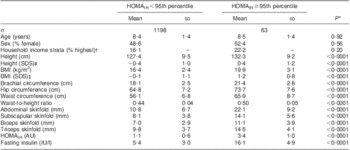
HOMAIR, homeostasis model assessment of insulin resistance; AU, arbitrary units; IU, international units.
*P values are based on independent-sample t tests and Wilcoxon–Mann–Whitney tests (for non-normally distributed variables).
†According to the city's classification of neighbourhoods’ public services fees.
‡SDS = standard deviation score based the Centers for Disease Control and Prevention charts, 2010.
Measures of reliability are presented in Table 2. The intra-examiner reliability percentages (R %) for the skinfold thickness and circumference site measurements in the current study ranged from 97·8 % for biceps skinfold thickness to 99·6 % for ASF. The inter-examiner reliability percentages for the skinfold thickness and circumference sites in the current study ranged from 84·3 % for biceps skinfold thickness to 97·1 % for WC. Finally, the ICC ranged from 79·6 % for biceps skinfold thickness to 96·8 % for WC.
Table 2 Intra- and inter-observer TEM, %TEM and R% for anthropometric measurements in prepubertal children aged 6–10 years, Bucaramanga, ColombiaFootnote *
TEM, technical error of measurement; %TEM, relative TEM; R %, coefficient of reliability as a percentage.
* One abdominal and one biceps skinfold thickness measures were dropped because they were >5 sd from the mean.
All adiposity indices were significantly correlated with HOMAIR and fasting insulin (Table 3). Modelling IR (HOMAIR ≥ 90th percentile) as an outcome variable, both BMI Z-score and ASF Z-score were retained by stepwise variable selection as independent predictors in the final logistic regression model. The AUC for IR risk prediction with ASF Z-score (0·808; 95 % CI 0·766, 0·849) was not significantly better than the AUC for IR risk prediction by BMI Z-score (0·794; 95 % CI 0·752, 0·837; P for contrast = 0·25; Table 4). However, the AUC of the final stepwise variable model (0·811; 95 % CI 0·770, 0·851), which included both BMI Z-score and ASF Z-score, was statistically better than the AUC for the BMI Z-score alone (P for contrast = 0·01).
Table 3 Simple correlations between anthropometric indices and homeostasis model assessment of insulin resistance (HOMAIR) and fasting insulin in prepubertal children aged 6–10 years, Bucaramanga, ColombiaFootnote *Footnote †Footnote ‡

BMIZ, BMI Z-score; WCZ, waist circumference Z-score; WHtR, waist-to-height ratio; ASFZ, abdominal skinfold thickness Z-score; SSFZ, subscapular skinfold thickness Z-score; TSFZ, triceps skinfold thickness Z-score; BSFZ, biceps skinfold thickness Z-score.
* For all correlations, n 1261.
† Pearson correlation coefficients are provided.
‡ All correlations are significant at P < 0·0001.
Table 4 Area under the curve (AUC) and 95 % confidence interval from receiver operating characteristic (ROC) curve contrasts for anthropometric predictors of insulin resistance in prepubertal children aged 6–10 years, Bucaramanga, ColombiaFootnote *Footnote †
HOMAIR, homeostasis model assessment of insulin resistance.
* For all ROC models, n 1261.
† BMI Z-score (BMIZ) was used as reference in all contrast estimates and tests against waist circumference Z-score (WCZ), waist-to-height ratio (WHtR), abdominal skinfold thickness Z-score (ASFZ), subscapular skinfold thickness Z-score (SSFZ), triceps skinfold thickness Z-score (TSFZ) and biceps skinfold thickness Z-score (BSFZ).
‡ P for contrast compared the AUC of the specified ROC model v. the BMIZ model.
Modelling extreme IR (HOMAIR ≥ 95th percentile) as the outcome variable, ASF Z-score was the only predictor variable retained by stepwise variable selection in the logistic regression model. The AUC for extreme IR risk prediction by ASF Z-score (0·864; 95 % CI 0·823, 0·905) was marginally better than the AUC for extreme IR risk prediction by BMI Z-score (0·837; 95 % CI 0·790, 0·884; P for contrast = 0·06; Table 4). The AUC when both ASF Z-score and BMI Z-score were retained as predictors (0·864; 95 % CI 0·823, 0·905) was significantly better than the AUC for BMI Z-score as a sole predictor (P for contrast = 0·01). WHtR, WC Z-score and other skinfold thickness Z-scores were not maintained in final stepwise models, and did not have better AUC than BMI Z-score for IR or extreme IR risk prediction. There was no evidence that risk prediction models for IR or extreme IR differed by age, sex or BMI.
Finally, compared with having HOMAIR < 90th percentile, the odds of having HOMAIR ≥ 90th and < 95th percentile, and of having HOMAIR ≥ 95th percentile, were similar among age- and sex-specific Z-scores for BMI, WC and ASF in univariate models (Table 5). In multinomial logistic models mutually adjusted for BMI Z-score and ASF Z-score, the odds of having HOMAIR ≥ 95th percentile appeared larger for a 1 sd increment in ASF Z-score (OR = 2·40; 95 % CI 1·63, 3·52) than for a 1 sd increment in BMI Z-score (OR = 1·52; 95 % CI 1·01, 2·29). A similar difference in the estimate of association was observed between ASF Z-score and WC Z-score in a model mutually adjusted for each variable (Table 5).
Table 5 Odds ratios and 95% confidence interval of having and homeostasis model assessment of insulin resistance (HOMAIR) ≥ 90th and <95th percentile and HOMAIR ≥ 95th percentile, by anthropometric indices, among prepubertal children aged 6–10 years, Bucaramanga, ColombiaFootnote *Footnote †
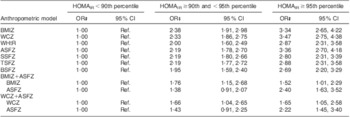
BMIZ, BMI Z-score; WCZ, waist circumference Z-score; WHtR, waist-to-height ratio; ASFZ, abdominal skinfold thickness Z-score; SSFZ, subscapular skinfold thickness Z-score; TSFZ, triceps skinfold thickness Z-score; BSFZ, biceps skinfold thickness Z-score; ref., referent category.
* For all models, n 1261.
† All Z-scores are age- and sex-adjusted.
‡ OR are based on multinomial logistic regression, and represent a 1 sd change in the anthropometric index.
Discussion
In this population-based study of prepubertal children, ASF Z-score and BMI Z-score were independently associated with IR, and the addition of ASF Z-score to BMI Z-score significantly improved prediction of IR and extreme IR. When modelled separately, ASF Z-score was marginally better in predicting extreme IR than BMI Z-score alone. Other measures of central adiposity, such as WC and WHtR, were not retained in stepwise variable selection models.
To our knowledge there are no studies in prepubertal children that have assessed ASF in relation to measures of IR. Findings from studies in obese adults suggest truncal skinfold thicknesses may have value in IR prediction. Over 50 years ago, Vague proposed a possible link between IR and abdominal fatness as determined by calliper methods(Reference Vague25). More recently, Sievenpiper et al. found a strong correlation between a truncal skinfold thicknesses and plasma insulin AUC, suggesting that they are useful adjuncts to BMI for predicting abnormal glucose and insulin metabolism(Reference Sievenpiper, Jenkins and Josse26). Moreover, Abate et al. found that after adjustment for total fat mass, the sum of truncal skinfold thicknesses was more strongly correlated with glucose disposal rate than other anthropometric measures(Reference Abate, Garg and Peshock27).
The contributions of overall and abdominal adiposity in insulin metabolism may explain the stepwise selection of ASF Z-score and BMI Z-score in the final prediction models. BMI is a measure of total body fat, but provides no indication of body fat distribution and does not distinguish well between lean and fat mass in children from a general population(Reference Maynard, Wisemandle and Roche8, Reference Freedman, Wang and Maynard9). Similar to BMI, WC and WHtR – measures of central adiposity shown to be significant predictors of IR in adolescents and adults – may be confounded by non-adipose tissue in prepubertal children(Reference Cameron, Jones and Griffiths11, Reference Tybor, Lichtenstein and Dallal28). Truncal skinfold thickness (i.e. ASF), which reflects abdominal subcutaneous fat in adults(Reference Sievenpiper, Jenkins and Josse26–Reference Tybor, Lichtenstein and Dallal28), has been shown to be strongly correlated with both abdominal subcutaneous and visceral fat in prepubertal children(Reference Liem, De Lucia and L'abee12–Reference Goran15), without being severely confounded by other tissues.
Goran found in prepubertal Caucasian and African American children that the strongest anthropometric correlates of abdominal visceral fat – measured by computed tomography – were abdominal (r = 0·88), subscapular (r = 0·85) and suprailiac (r = 0·85) skinfold thicknesses, followed by WC (r = 0·84). The strongest correlates of subcutaneous fat were WC (r = 0·93) and triceps (r = 0·92), abdominal (r = 0·91), suprailiac (r = 0·91) and axilla (r = 0·84) skinfold thicknesses(Reference Goran15). Other studies of prepubertal children have found correlations of similar magnitude between ASF and fat depots(Reference Liem, De Lucia and L'abee12–Reference Goran, Gower and Treuth14).
As such, the improved prediction of IR by ASF Z-score may be explained by the correlation between ASF and abdominal visceral fat or subcutaneous fat. In adolescents(Reference Goran and Gower29) and adults(Reference Preis, Massaro and Robins30), abdominal subcutaneous fat independently predicts insulin sensitivity, although not as strongly as abdominal visceral adiposity. In children, especially those in prepuberty, the role of abdominal subcutaneous and visceral fat in insulin metabolism is likely to be different from that in adolescents and adults(Reference Goran and Gower29). Studies in normal-weight(Reference Yanovski, Yanovski and Filmer31) and overweight/obese(Reference Gower, Nagy and Trowbridge32) African American prepubertal children have found that, after controlling for total body fat, subcutaneous abdominal fat, but not visceral fat, was associated with insulin metabolism measures; no such associations were found in white children. Moreover, findings from studies of overweight/obese Italian(Reference Maffeis, Manfredi and Trombetta33) and Turkish(Reference Semiz, Özgören and Sabir34) children showed that measures of insulin sensitivity and IR are positively associated with abdominal subcutaneous fat, but not visceral fat. Yet, a recent study found that abdominal visceral adiposity was strongly correlated with insulin sensitivity in obese and non-obese prepubertal children(Reference Bennett, Larson-Meyer and Ravussin35). Thus, whether the improved prediction of IR by ASF Z-score is explained by the correlation between ASF and visceral or subcutaneous abdominal adipose tissue is a topic for future research.
Our finding that WC Z-score and WHtR were not significantly better than BMI Z-score for IR risk prediction aligns with most other studies comparing abdominal circumference measures with BMI in children(Reference Goran, Gower and Treuth14). Many of the studies(Reference Lee, Wahlqvist and Yu36–Reference Moreno, Pineda and Rodriguez39) which found that WC and WHtR were more sensitive indicators of visceral fat and adverse adiposity-related health outcomes than BMI did not distinguish between prepubertal and pubertal children, which is necessary because longitudinal analyses of fat patterning in children and adolescents have shown that fat distribution changes markedly throughout the pubertal transition(Reference Cameron, Gordon-Larsen and Wrchota40). In addition, none of these studies simultaneously assessed the performance of ASF for predicting cardiometabolic risk factors.
Despite the evidence for its predictive value, some suggest skinfold thicknesses have limited clinical utility beyond the simple measurements of weight and height(Reference Willett, Dietz and Colditz41). High inter- and intra-observer variability, which may result in inaccurate estimates, is perhaps the main reason why skinfold thickness assessment of body fat is not used more widely in population-based research(42). However, the only study that included ASF in estimates of reliability found that the influence of measurement errors in skinfold thicknesses was smaller in abdominal and suprailiac skinfolds compared with other sites(Reference Demura and Sato43). This finding is consistent with our study, in which we found ASF to have higher intra-observer reliability (R %) than other skinfold-thickness site measures and WC, and higher inter-observer reliability than other skinfold sites, although marginally lower than WC. As is the case with circumference measurement, careful training of technicians is essential to reduce error in skinfold thickness measurement.
None the less, one limitation of our study is the higher degree of measurement error in skinfold measurement relative to BMI, which we were unable to compare because height and weight were only measured once in our study. However, it is important to understand that inter- and intra-observer variability in skinfold thickness measurement would most likely bias the results towards the null (non-differential misclassification). As such, our study may be underestimating the true association between ASF Z-score and IR in prepubertal children. Another limitation is that HOMAIR is an indirect measure of IR. However, HOMAIR is highly correlated with the gold standard insulin clamp-measured IR and is an accepted method for estimating IR in large observational studies when clamps are not feasible(Reference Wallace and Matthews44). Finally, adipose tissue deposition and IR are known to be influenced by onset of puberty(Reference Moran, Jacobs and Steinberger45). Residual confounding by onset of puberty is unlikely in the current study as children with Tanner stage ≥2 or history of menarche were excluded, and all outcome and predictor variables were standardized for age and sex. Furthermore, there was no evidence that risk prediction varied when we stratified by the median age of the sample (8 years of age).
Conclusions
We found that ASF Z-score and BMI Z-score were significant independent predictors of IR, and that the addition of ASF Z-score to BMI Z-score improved prediction of IR and severe IR in Colombian prepubertal children. Moreover, ASF Z-score, separately, was marginally better than BMI Z-score in predicting extreme IR. In contrast to the commonly cited limitation of reproducibility, we found ASF to have an intra- and inter-class reliability comparable to, or better than, other measures of adiposity. In terms of general practice, the addition of ASF measurement should be considered in the classification of obesity status for prediction of IR in prepubertal children from the general population. Longitudinal studies in multiethnic populations are required to determine if adding ASF Z-score to BMI Z-score improves prediction of long-term IR and associated morbidity and mortality into adulthood.
Acknowledgements
Source of funding: The present study was supported by the Colombian Institute for the Development of Science and Technology (COLCIENCIAS 65660418215). Research reported in this publication was supported by the National Heart, Lung, and Blood Institute of the National Institutes of Health under Award Number T32HL007779. The content is solely the responsibility of the authors and does not necessarily represent the official views of the National Institutes of Health. Conflicts of interest: The authors declare that they have no conflicts of interest. Authors’ contributions: N.T.M., M.A.P., C.F.R.-C. and C.V.-R. designed the study and drafted the manuscript. N.T.M. and M.A.P. performed the statistical analysis and interpretation of data. C.F.R.-C. and C.V.-R. helped to draft the manuscript and critically revise it. C.V.-R., A.B.-L., A.E.D., D.C.R. and A.J.R. conceived of the study and acquired the data. All authors read and approved the final manuscript. Acknowledgements: The authors would like to thank Drs Diana J. Cano, Maria P. Martinez, Paul A. Camacho, Walter Mosquera and Juan G. Ruiz, for their contributions to SIMBA. Finally, they would like to express their gratitude to the clinical and research staff at the Fundación Cardiovascular de Colombia.


