


Fish is recognised as a nutritious and healthy food partly owing to the fact that they are naturally rich in the health-promoting n-3 long-chain PUFA (LC-PUFA), EPA (20 : 5n-3) and DHA (22 : 6n-3)( Reference Delgado-Lista, Perez-Martinez and Lopez-Miranda 1 , Reference Calder 2 ). Much of the fish consumed today is farmed( 3 ), many reared on feeds containing high levels of more sustainable raw materials such as plant meals and oils of agricultural origin. Such terrestrial ingredients are devoid of n-3 LC-PUFA and, therefore, the use of these plant ingredients translates into reduced levels of beneficial n-3 LC-PUFA in the fillet of the fish, as has been documented in farmed Atlantic salmon (Salmo salar) from 2006 onwards( Reference Sprague, Dick and Tocher 4 ). This means that larger or more portions of farmed fish must be consumed in order to obtain the recommended EPA and DHA intake suggested by different agencies (e.g. International Society for the Study of Fatty Acids and Lipids( 5 ) and European Food Safety Authority( 6 )).
Oilseed crops are major agricultural products with a highly organised and well-established infrastructure for their cultivation, harvest and processing, as well as distribution, marketing and utilisation of vegetable oils (VO)( Reference Salunkhe, Adsule and Chavan 7 ). Thus, VO have been the main alternatives to dietary fish oil (FO) in aquafeeds and, although these oils are devoid of n-3 LC-PUFA, they can be rich in shorter-chain PUFA such as 18 : 3n-3. This opens up the possibility for genetic modification to enable the desaturation and elongation of 18 : 3n-3 to EPA and DHA. Recently, transgenic Camelina sativa crops, capable of producing either EPA or EPA and DHA in their seeds, have been developed( Reference Ruiz-Lopez, Haslam and Napier 8 , Reference Usher, Han and Haslam 9 ). Two such oils have been evaluated as replacements for dietary FO in feeds for Atlantic salmon( Reference Betancor, Sprague and Usher 10 – Reference Betancor, Li and Sprague 13 ) and gilthead sea bream (Sparus aurata)( Reference Betancor, Sprague and Montero 14 ) showing promising results, enabling good fish growth and deposition of n-3 LC-PUFA in tissues including flesh. In contrast, feeds formulated with high levels of conventional plant ingredients, including VO, can adversely affect fish health through impacts on immune and stress responses( Reference Montero and Izquierdo 15 ). A well-balanced dietary fatty acid profile, particularly in terms of LC-PUFA, is a determinant of animal health and welfare and, thus, the replacement of FO by VO can alter this balance. In previous trials, no major impacts on fish health were observed after feeding fish with oil from transgenic Camelina supplying 12 % EPA+DHA with, specifically, no detrimental effects on immune function( Reference Betancor, Sprague and Sayanova 12 ) or response after an environmental stress( Reference Betancor, Li and Sprague 13 ). However, the outcome of stress responses in fish fed VO will depend on the intensity and type of the stressor, as well as its duration( Reference Tort 16 ), and therefore different stressors may have different effects on particular immune or inflammatory responses.
In previous studies, oils from transgenic Camelina supplying either 20 % EPA or 6 % each of EPA and DHA were tested in Atlantic salmon against ‘gold-standard’ feeds formulated with high fishmeal and FO( Reference Betancor, Sprague and Usher 10 – Reference Betancor, Sprague and Sayanova 12 ). The oil supplying 6 % each of EPA and DHA was subsequently tested in Atlantic salmon against feeds formulated with lower fishmeal and FO( Reference Betancor, Li and Sprague 13 ). In the present study, a third-generation oil supplying levels of EPA, DHA and total n-3 LC-PUFA greater than most FO was tested in feeds for Atlantic salmon with even lower levels of fishmeal and FO reflecting current commercial salmon feeds. Thus, triplicate groups of Atlantic salmon were fed one of three experimental diets formulated with 30 % fishmeal and 43 % plant meals that contained a mix of FO and rapeseed oil (1:3) (diet COM), wild-type Camelina oil (diet WCO) or transgenic Camelina oil (diet TCO) in order to evaluate the capability of the new transgenic oil to restore EPA and DHA levels in farmed salmon to those of a decade ago before the development of sustainable feeds( Reference Sprague, Dick and Tocher 4 ). Therefore, feeds were formulated with lower levels of fishmeal (30 v. 49 or 35 % previously) and, in the reference (COM) diet, FO (5 v. 17·5 or 10 % previously) to reflect current feed formulations and n-3 LC-PUFA levels. The impacts of diet TCO on fish growth performance and tissue fatty acid composition were assessed, and influences on fish metabolism were determined by investigating gene expression via liver and pyloric caeca (PC) transcriptomic responses. In addition, at the end of the experimental trial, an ex vivo challenge was performed on head kidney monocytes in order to assess potential impacts on the immune response.
Methods
Diets and feeding trial
The feeding trial was carried out at the facilities of the Institute of Marine Research from December 2016 to February 2017. A total of 297 post-smolt Atlantic salmon (initial weight 133·0 (sd 1·6)) were distributed into nine 400l2 flow-through seawater tanks (thirty-three fish/tank) and fed twice daily with one of the three feeds in triplicate for 12 weeks. Fish were fed to satiety to ensure that feed availability did not restrict growth. Water temperature was maintained at 13°C throughout the experimental period. The three feeds were formulated to be essentially isonitrogenous and isolipidic and produced by vacuum coating identical basal extruded pellets with COM, WCO or high EPA+DHA-Camelina oil (TCO) (Table 1). Fatty acid profiles of the constituent oils used in this trial (online Supplementary Table S1) resulted in percentages of both EPA and DHA in diet TCO that were almost 3-fold higher than in the other two dietary treatments (Table 1). The proportions of n-6 and total PUFA were also higher in the TCO diet, whereas this feed showed the lowest levels of MUFA. Yttrium oxide (Y2O3,>99·9 % purity; Strem Chemicals) was added to the feeds as an inert marker in order to determine lipid and fatty acid digestibility. All procedures were approved by the Norwegian Animal Experiment Committee (Forsøksdyrutvalget), experiment ID 8089.
Table 1 Formulations, analysed proximate compositions and selected fatty acid profiles of the experimental diets

COM, fish oil/rapeseed oil feed; WCO, wild-type Camelina oil feed; TCO, transgenic Camelina oil feed; LC-PUFA, long-chain PUFA (sum of 20 : 4n-3, 20 : 5n-3, 22 : 5n-3, 22 : 6n-3).
* Contains 14 : 0, 18 : 0 and 20 : 0.
† Contains 16 : 1n-7, 18 : 1n-7, 20 : 1n-11, 20 : 1n-9, 20 : 1n-6, 22 : 1n-11 and 22 : 1n-9.
‡ Contains 18 : 3n-6, 20 : 2n-6, 20 : 3n-6 and 22 : 4n-6.
§ Contains 18 : 4n-3, 20 : 3n-3 and 20 : 4n-3.
Sample collection
At the end of the feeding trial, thirteen fish/tank were killed by an overdose of metacaine sulphonate (>150 mg/l, FINQUEL vet.; ScanAqua AS). Fish were measured (weight and length) and blood from four fish/tank was collected through the caudal vein using 1-ml heparinised syringes fitted with 20G needles, and whole blood was used for haematocrit determination. Two whole fish per tank were frozen (−20°C) for biochemical proximate composition analysis, and liver and PC were collected from four fish/tank and stabilised in RNA Later (Sigma) and frozen at −20°C until further RNA extraction. After sampling, the fish remaining in the tanks continued to be fed the same feeds as before sampling for a further 3 d, at which point faeces were collected and pooled by tank (n 3). In brief, fish were killed by an overdose of metacaine sulphonate as above and faecal samples were collected from the hind gut region by gently squeezing the ventral abdominal area( Reference Austreng 17 ). Faeces were initially stored at −20°C and freeze-dried before analyses.
Proximate composition
Feeds were ground and whole fish were pooled per tank (three per dietary treatment) and homogenised before determination of proximate composition according to standard procedures( 18 ). Moisture contents were obtained after drying them in an oven for 24 h at 110°C. Ash content was determined after incinerating the samples at a temperature of 600°C for 20 h. Crude protein content was measured by determining nitrogen content (N×6·25) using automated Kjeldahl analysis (Tecator Kjeltec Auto 1030 analyzer; Foss) and crude lipid determined gravimetically after Soxhlet lipid extraction with petroleum ether (Fisher Scientific) using a Tecator Soxtec system 2050 Auto Extraction apparatus (Foss).
Calculations
Biometric parameters were estimated as follows: Fulton’s condition factor (k)=100×(W/L 3), where W is the final weight (g) and L the total length (cm). Specific growth rate=100×(ln W o−ln W f)×D−1, where W o and W f are the initial and final weights (tanks means, n 3), respectively, and D represents the number of feeding days.
Lipid content and fatty acid composition
Total lipid was extracted from feeds, faeces and whole fish, and flesh, liver, head kidney, midgut and hindgut homogenates prepared from three pooled fish per tank (three per treatment) by homogenising approximately 1-g samples in chloroform–methanol (2:1, v/v) using an Ultra-Turrax tissue disrupter (Fisher Scientific), with content determined gravimetrically( Reference Folch, Lees and Sloane-Stanley 19 ). Fatty acid methyl esters (FAME) were prepared from total lipid by acid-catalysed transesterification at 50°C for 16 h( Reference Christie 20 ), and FAME-extracted and quantified by a GC (AutoSystem XL; Perkin Elmer) with Total Chrom version 6.3.1 software. The GC was equipped with a fused silica capillary column coated with chemically bonded polyethylene glycol (CP-Wax 52CB, 25 m×0·25 mm internal diameter; Varian), auto-injector (1 µl, inlet temperature 250°C) and a flame ionisation detector (280°C). He was the carrier gas and the oven temperature programme was 90°C for 1 min, increased to 150°C at 30°C/min and finally raised to 225°C at 3°C/min and held for 7 min. Individual methyl esters were identified by comparison with known standards and a well-characterised FO, and also by reference to published data( Reference Tocher and Harvie 21 ).
Digestibility calculation
The apparent digestibility coefficients (ADC) of lipid and selected fatty acids were calculated as follows: 100−(100×(Y2O3 concentration in feed/Y2O3 concentration in faeces)×(lipid or fatty acid concentration in faeces/lipid or fatty acid concentration in feed)). The concentrations of individual fatty acids in diets and faeces were calculated based on the relative proportion of each fatty acid compared with a known amount of internal standard (17:0) added and the total lipid content determined in the samples.
Isolation and primary culture of head kidney monocytes/macrophages
Four fish per tank were killed by an overdose of metacaine sulphonate (as above) and head kidneys were removed, pooled (two per tank) and transferred to Leibovitz L-15 medium (Sigma) supplemented with 10 U/ml heparin, 1·8 mm glucose, 10 mm HEPES, 20 U Penicillin/ml, 20 μg Streptomycin/ml and 0·05 μg Amphotericin B/ml. Head kidneys were carefully sieved through a 100-μm nylon cell strainer, and the cell suspension was loaded onto discontinuous 36/54 % Percoll (GE Healthcare) gradients followed by centrifugation at 400 g for 30 min at 4°C. The interface was collected and washed twice with L-15 medium (without heparin) followed by centrifugation at 400 g for 5 min at 4°C. Finally, cells were diluted in L-15 medium and seeded at a density of 1×10⁷ cells per well in ninety-six-well or six-well culture plates (Nunc) in aliquots of 50 μl/well or 1 ml/well, respectively. The culture plates were incubated at 12°C overnight and the cells were washed twice in 50 ml of L-15 and incubated in L-15 for further studies.
Lipopolysaccharide challenge
Isolated macrophage cultures (six-well plates; n 6) were stimulated with 20 μg/ml crude Escherichia coli lipopolysaccharides (LPS) (0111:B4; Sigma-Aldrich). Samples were collected before the addition of LPS (0 h), and after incubation at 12°C for sequential sampling points (6 and 24 h) cells were harvested by adding 1 ml of TRI Reagent® (Sigma) lysis buffer and stored at −70°C until RNA extraction.
Respiratory burst activity
Respiratory burst activity was determined by the reduction of nitroblue tetrazolium (NBT) to formazan( Reference Choi, Kim and Cha 22 , Reference Secombes 23 ). Cells were incubated in L-15 medium supplemented with 1 mg/ml NBT and 1 µg/ml phorbol myristate acetate for 30 min at 12°C. Cells were then washed twice with pre-warmed PBS and fixed in absolute methanol for 10 min, washed once with 70 % methanol to remove extracellular formazan, air-dried and then intracellular formazan was dissolved in 120 µl of 2 m KOH and 140 µl of dimethyl sulfoxide. Absorbance was measured in a microplate reader at 630 nm using a KOH/dimethyl sulfoxide blank. The mean number of cells, obtained from at least three wells, was determined by counting nuclei after removal of medium and addition of 100 µl of lysis buffer containing 0·1 m citric acid, 1 % Tween 20 and 0·05 % crystal violet. Results were presented as absorbance per 105 cells.
Phagocytosis
Phagocytic activity was determined by a modification of the method of Pulsford et al.( Reference Pulsford, Crampe and Lagnston 24 ) using opsonised yeast as engulfed material. For opsonisation, yeast was sterilised in boiling water and, after several washes with PBS, yeast were incubated overnight with fetal bovine serum at room temperature( Reference Russo, Shoemaker and Panangala 25 ). Head kidney cells were mixed with opsonised yeast to obtain an approximate ratio of 10:1 yeast to kidney cells. Phagocytosis proceeded for 1 h at 26°C, and was then terminated by washing with ice-cold PBS. Phagocytosis was evaluated by observation by inverted light microscopy( Reference Jensch-Junior, Presinotti and Borges 26 ). At least 100 cells were counted and phagocytosis was expressed as phagocytosis percentage (PP), which was calculated as follows:
 $$\eqalignno { {\rm PP}\,{\equals}\,&\left( {{{{\rm no.}\,{\rm of}\,{\rm cells}\,{\rm ingesting}\,{\rm yeasts}} \over {{\rm no. }\,{\rm of}\,{\rm adherent}\,{\rm cells}\,{\rm observed}}}} \right) \cr&{\rm {\times}}\left( {{{{\rm no.}\,{\rm of}\,{\rm yeast}\,{\rm ingested}} \over {{\rm no.}\,{\rm of}\,{\rm adherent}\,{\rm cells}\,{\rm observed}}}} \right).$$
RNA extraction and complementary DNA synthesis
Individual liver and PC samples from eighteen fish per dietary treatment were homogenised in 1 ml of TriReagent® (Sigma-Aldrich) to extract total RNA according to the manufacturer’s protocol. Quantity and quality of RNA were determined by spectrophometry using a Nanodrop ND-1000 (Labtech Int.). The same protocol was used to extract RNA from macrophage samples. Complementary DNA (cDNA) was synthesised using a high-capacity reverse transcription kit using 2 μg of total RNA and random primers in a total reaction volume of 20 μl according to the manufacturer’s protocol (Applied Biosystems). The samples were pooled to obtain six per dietary treatment. A dilution of 1:20 was applied to the resulting cDNA using milliQ water (Thermo Scientific).
Liver and pyloric caeca transcriptome – microarray hybridisations and image analysis
Transcriptomic analysis of liver and PC was performed using a custom-designed 4×44 k Atlantic salmon oligo microarray (ArrayExpress accession no. A-MEXP-2065; Agilent Technologies). The salmon microarray and laboratory procedures utilised have been widely used and validated in many previous studies( Reference Betancor, Sprague and Usher 10 – Reference Betancor, Sprague and Sayanova 11 , Reference Morais, Edvardsen and Tocher 27 – Reference Bicskei, Bron and Glover 30 ). Replicate RNA samples were amplified using TargetAmp™ 1-Round Aminoallyl-aRNA Amplification Kit (Epicentre Technologies Corporation) according to the recommended procedures. Aminoallyl-amplified RNA (aRNA) samples were labelled with Cy3 dye (GE HealthCare Life Sciences), whereas a pool of all aRNA samples was labelled with Cy5 dye (GE HealthCare Life Sciences) and used as a common reference in a dual-label common reference design, and finally hybridised. Scanning was performed using a GenePix 4200 AL Scanner (Molecular Devices (UK) Ltd), and the resulting images were analysed with Agilent Feature Extraction Software version 9.5 (Agilent Technologies) to extract intensity values and identify features. Features considered outliers (i.e. defined as those probes whose background intensity was between the 0·05th and 99·95th percentiles of the distribution) in two or more replicates within at least one treatment were excluded from further analyses. In addition, features consistently expressed just above background noise (defined as those features whose intensity was lower than the 5th percentile of the distribution in 75 % or more of the analysed samples) were also removed. The full protocol for microarray and data analysis has been reported previously( Reference Betancor, Sprague and Usher 10 ). The full data set supporting the results is available in MIAME-compliant format in the ArrayExpress repository under accession number E-MTAB-6228.
Quantitative PCR gene expression
Gene expression levels were determined by real-time quantitative RT-PCR in liver, PC and macrophages as described previously( Reference Betancor, Howarth and Glencross 31 ). Genes involved in LC-PUFA biosynthesis (delta-6 fatty acyl desaturase (fads2d6); delta-5 fatty acyl desaturase (fads2d5); fatty acyl elongase 2; fatty acyl elongase 5 isoform a;fatty acyl elongase isoform b (elovl5b)) were measured in liver and PC, whereas genes involved in inflammation (il1b;cyclo-oxygenase 2 (cox2), inducible nitric oxide synthase (inos) and tnfα) and anti-bacterial activity (cathelicidin (cath) and hepcidin) were measured in macrophages (online Supplementary Table S2). Results were normalised using reference genes: cofilin 2, elongation factor 1 alpha and ribosomal protein L2. Primers were designed using Primer 3 in regions that included the microarray probes( Reference Rozen and Skaletsky 32 ). Quantitative PCR was performed using a Biometra TOptical Thermocycler (Analytik Jena) in ninety-six-well plates in duplicate 20-μl reaction volumes containing 10 μl of Luminaris Color HiGreen qPCR Master Mix (Thermo Scientific), 1 μl of primer corresponding to the analysed gene (10 pmol), 3 μl of molecular biology-grade water and 5 μl of cDNA, with the exception of the reference genes, which were determined using 2 μl of cDNA. In addition, amplifications were carried out with a systematic negative control (NTC-no template control) containing no cDNA. Standard amplification parameters contained an UDG pre-treatment at 50°C for 2 min, an initial activation step at 95°C for 10 min, followed by thirty-five cycles: 15 s at 95°C, 30 s at the annealing Tm and 30 s at 72°C.
Statistical analysis
All data are means and standard deviations (n 3) unless otherwise specified. Percentage data were subjected to arcsin square-root transformation before statistical analyses. Data were tested for normality and homogeneity of variances with Levene’s test before one-way ANOVA followed by a Tukey post hoc test. All statistical analyses including the gene expression results were performed using SPSS software (IBM SPSS Statistics 23; SPSS Inc.).
Results
Fish growth performance and biochemical composition
No significant differences were observed between the three dietary groups at the end of the feeding period in any of the evaluated growth or biometric parameters (Table 2). There was a 100 % survival rate and no presence of disease was observed. Fish fed diet TCO had a lower lipid content than fish fed the COM and WCO diets, but there were no differences in protein, ash or DM contents of whole fish (Table 2).
Table 2 Growth performance, biometric parameters and biochemical composition of whole fish after feeding the experimental diets for 12 weeks(Mean values and standard deviations; n 3)

COM, fish oil/rapeseed oil feed; WCO, diet containing wild-type Camelina; TCO, transgenic Camelina oil feed; HSI, hepato-somatic index; VSI, viscero-somatic index.
a,b Mean values with unlike superscript letters were statistically significantly different between the treatments as determined by one-way ANOVA with Tukey’s post hoc test (P<0·05).
Lipid and fatty acid digestibility
Differences in ADC of dietary lipid were observed among the dietary treatments, with TCO showing the lowest value (Table 3). The ADC of SFA and MUFA varied between about 87–94 % and 91–98 %, respectively, with the rank order generally being COM>WCO>TCO (Table 3). The ADC for n-6, n-3 and total PUFA were all 97–98 % with few significant differences between feeds, although the diet WCO showed the lowest ADC for EPA, DHA, 22 : 5n-3 (DPA) and 20 : 4n-6 (arachidonic acid (ARA)). The COM diet showed the lowest ADC for 20 : 3n-3, probably reflecting the very low dietary content of this fatty acid (Table 1).
Table 3 Apparent digestibility coefficients of total lipid and individual fatty acids(Mean values and standard deviations; n 3)

COM, fish oil/rapeseed oil feed; WCO, wild-type Camelina oil feed; TCO, transgenic Camelina oil feed.
a,b,c Mean values with unlike superscript letters were statistically significantly different between the treatments as determined by one-way ANOVA with Tukey’s post hoc test (P<0·05).
Lipid contents and fatty acid compositions of whole fish and tissues
The lower lipid content of whole fish fed diet TCO compared with fish fed COM (Table 2) was reflected in the lipid content of flesh (whole muscle), although there was no significant difference to fish fed WCO (Table 4). In contrast, diet had no effect on the lipid contents of liver and head kidney (Table 5).
Table 4 Lipid contents (percentage of wet weight) and fatty acid compositions (percentage of total fatty acids) of total lipid of whole body and flesh (muscle) of Atlantic salmon after feeding the experimental diets for 12 weeks(Mean values and standard deviations; n 3)

COM, fish oil/rapeseed oil feed; WCO, wild-type Camelina oil feed; TCO, transgenic Camelina oil feed; LC- PUFA, long-chain PUFA (sum of 20 : 4n-3, 20 : 5n-3 22 : 5n-3 and 22 : 6n-3).
a,b,c Mean values with unlike superscript letters within a row were significantly different among diets as determined by one-way ANOVA with Tukey’s comparison test (P<0·05).
* Contains 14 : 0, 15 : 0, 18 : 0, 20 : 0 and 22 : 0
† Contains 16 : 1n-7, 18 : 1n-7, 20 : 1n-9, 22 : 1n-11, 22 : 1n-9 and 24 : 1.
‡ Contains 20 : 2n-6 and 20 : 3n-6.
§ Contains 18 : 4n-3, 20 : 3n-3 and 20 : 4n-3.
Table 5 Lipid contents (percentage of wet weight) and fatty acid compositions (percentage of total fatty acids) of total lipid of liver and head kidney of Atlantic salmon after feeding the experimental diets for 12 weeks(Mean values and standard deviations; n 3)

COM, fish oil/rapeseed oil feed; WCO, wild-type Camelina oil feed; TCO, transgenic Camelina oil feed; LC-PUFA, long-chain PUFA (sum of 20 : 4n-3, 20 : 5n-3, 22 : 5n-3 and 22 : 6n-3).
a,b,c Mean values with unlike superscript letters within a row were significantly different among diets as determined by one-way ANOVA with Tukey’s comparison test (P<0·05).
* Contains 14 : 0, 15 : 0, 18 : 0, 20 : 0 and 22 : 0.
† Contains 16 : 1n-7, 18 : 1n-7, 20 : 1n-9, 22 : 1n-11, 22 : 1n-9 and 24 : 1.
‡ Contains 20 : 2n-6 and 20 : 3n-6.
§ Contains 18 : 4n-3, 20 : 3n-3 and 20 : 4n-3.
Fatty acid compositions of whole fish and tissues
The proportion of total n-3 LC-PUFA in whole body of Atlantic salmon fed diet TCO was around double that of fish fed diets WCO or COM (Table 4). Specifically, the relative contents of EPA, DPA and DHA were highest in fish fed TCO, with fish fed COM and WCO showing similar lower values. The proportions of 18 : 2n-6, ARA and n-6 PUFA were also highest in TCO-fed fish, with COM-fed fish showing the lowest proportions of 18 : 2n-6 and total n-6 PUFA. Differences were also observed in total SFA and monoenes, with COM-fed fish showing the lowest and highest contents, respectively.
Flesh of fish fed TCO displayed the highest contents of the n-3 LC-PUFA, EPA, DPA and DHA, and ARA (Table 4). In COM-fed fish, flesh showed the highest proportions of total saturates and 18 : 1n-9, and the lowest contents of 18 : 3n-3, whereas WCO-fed fish contained the highest percentage of this fatty acid. Relative levels of total n-3 PUFA, EPA and DPA in liver and head kidney were highest in fish fed TCO, although total n-3 LC-PUFA levels in TCO-fed fish were not different from those of WCO-fed fish. Although DHA level was highest in fish fed TCO in both liver and head kidney, variation in the data rendered the dietary differences not significant (Table 5).
A PCA analysis was applied to the whole fish and tissue fatty acid profiles (percentage) of fish fed the three experimental feeds. The first two principal components explained 82·8 % of variance (Fig. 1). The score plot showed some separation between tissues of fish fed COM and those fed both WCO and TCO. There was an overlap between tissues of fish fed WCO and TCO, although liver from fish fed TCO showed a distinct profile, clustering at the left side of the plot (red diamonds). The fatty acid vectors representing the MUFA 16 : 1n-7, 18 : 1n-7, 18 : 1n-9 and 22 : 1n-11 appeared to be correlated with fish fed the COM diet. The n-6 and n-3 PUFA (18 : 2n-6, 18 : 3n-3 and 18 : 4n-3) vectors lie towards fish fed WCO, whereas the n-6 and n-3 LC-PUFA (20 : 4n-6, 20 : 5n-3 and 22 : 6n-3) point towards TCO-fed fish, as well as livers from WCO-fed fish.
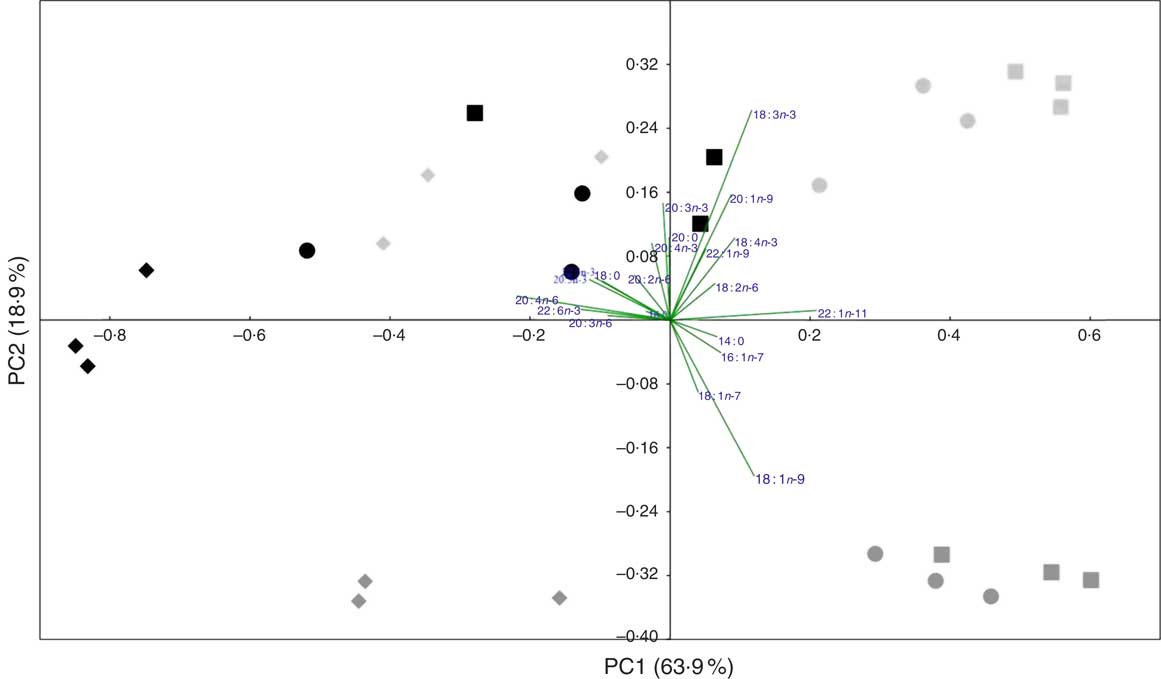
Fig. 1 Principal component analysis (PCA) of fatty acid profiles (percentage of total fatty acids) of tissues from Atlantic salmon fed the experimental feeds for 12 weeks. ![]() ,
, ![]() and
and ![]() , Fish fed fish/rapeseed oil;
, Fish fed fish/rapeseed oil; ![]() ,
, ![]() and
and ![]() , fish fed wild-type Camelina oil;
, fish fed wild-type Camelina oil; ![]() ,
, ![]() and
and ![]() , fish fed transgenic Camelina oil;
, fish fed transgenic Camelina oil; ![]() ,
, ![]() and
and ![]() , head kidney;
, head kidney; ![]() ,
, ![]() and
and ![]() , flesh;
, flesh; ![]() ,
, ![]() and
and ![]() , liver.
, liver.
Liver transcriptome
In liver, a total of 312 unique genes were differentially expressed (P<0·05; fold-change (FC)>1·3) in salmon fed the TCO diet v. the COM diet, whereas 249 genes were affected when comparing WCO-fed fish with COM-fed fish (Table 6). The highest number (506) of differentially expressed genes (DEG) was observed when comparing the hepatic transcriptomes of TCO-fed and WCO-fed fish. Among these unique probes, eighty-six DEG were commonly regulated when comparing fish fed TCO with fish fed either COM or WCO, whereas forty-five were found when TCO- and WCO-fed fish were compared with COM-fed fish and only thirty-seven when fish fed TCO and COM were compared with those fed WCO (Fig. 2(a)).
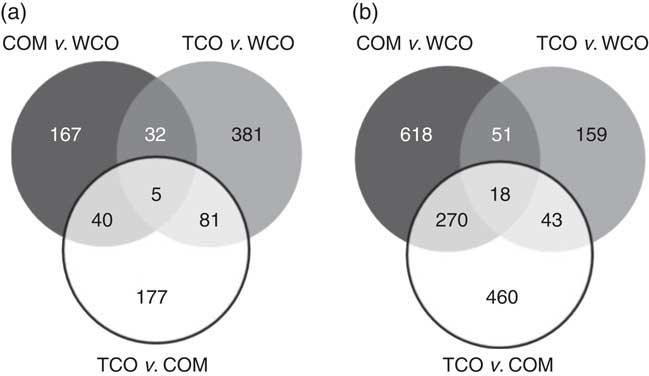
Fig. 2 Venn diagram representing genes differentially expressed in liver (a) and pyloric caeca (b) of Atlantic salmon fed the experimental diets (Welch t test; P<0·05, fold-change>1·3). Non-annotated genes and features corresponding to the same gene are not represented. COM, fish/rapeseed oil feed; TCO, transgenic Camelina oil feed; WCO, wild-type Camelina oil feed.
Table 6 Summary of liver and pyloric caeca microarray analysis after removing duplicated probes(Numbers and percentages)

COM, fish oil/rapeseed oil feed; WCO, wild-type Camelina oil feed; TCO, transgenic Camelina oil feed; DEG, differently expressed gene; FC, fold-change.
To elucidate the genes exclusively affected by TCO, KEGG Orthology numbers were assigned to the 86 genes commonly affected by TCO (online Supplementary Table S3), and genes mapped to a known compendium of metabolic pathways (KEGG). Enrichr, an integrative web-based software application( Reference Kuleshov, Jones and Rouillard 33 ), was used to build a network with the enriched gene sets (Fig. 3(a)). Many of the categories represented belonged to metabolism with high representation of lipid metabolism including ‘fatty acid degradation’, ‘sphingolipid metabolism’ and ‘terpenoid backbone biosynthesis’, as well as amino acid metabolism including ‘alanine, aspartate and glutamate metabolism’ and ‘other glycan degradation’. Genes belonging to other categories such as ‘protein processing in the endoplasmic reticulum’ and ‘DNA replication’ were also highly represented. At a gene level, all the genes presented the same direction of regulation (up or down) between both contrasts and a similar FC. Expression of a set of candidate LC-PUFA biosynthesis genes was determined by qPCR with fads2d5 and fads2d6 showing up-regulation in fish fed WCO, with no difference between fish fed TCO and COM (Fig. 4). No differences were observed among the expression of the other LC-PUFA biosynthesis genes evaluated by qPCR.
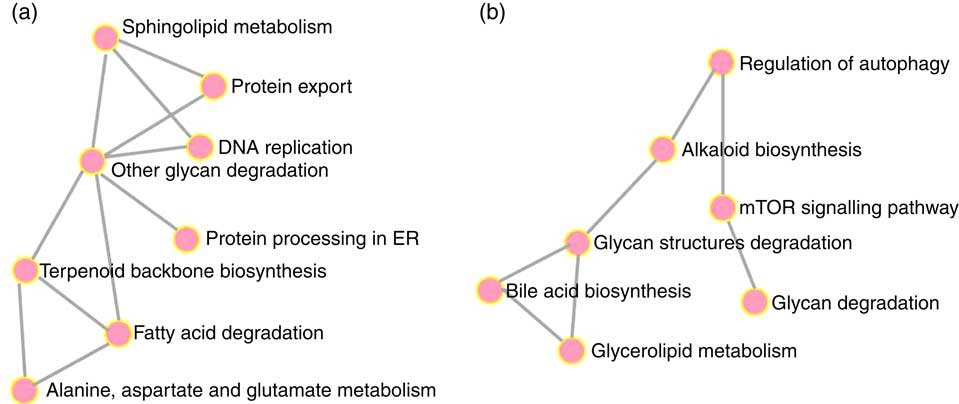
Fig. 3 Metabolic categories enriched with genes commonly regulated in fish fed transgenic Camelina oil. Gene networks in liver (a) and pyloric caeca (b) were produced using the Enrichr web application. ER, endoplasmic reticulum; mTOR, mammalian target of rapamycin.
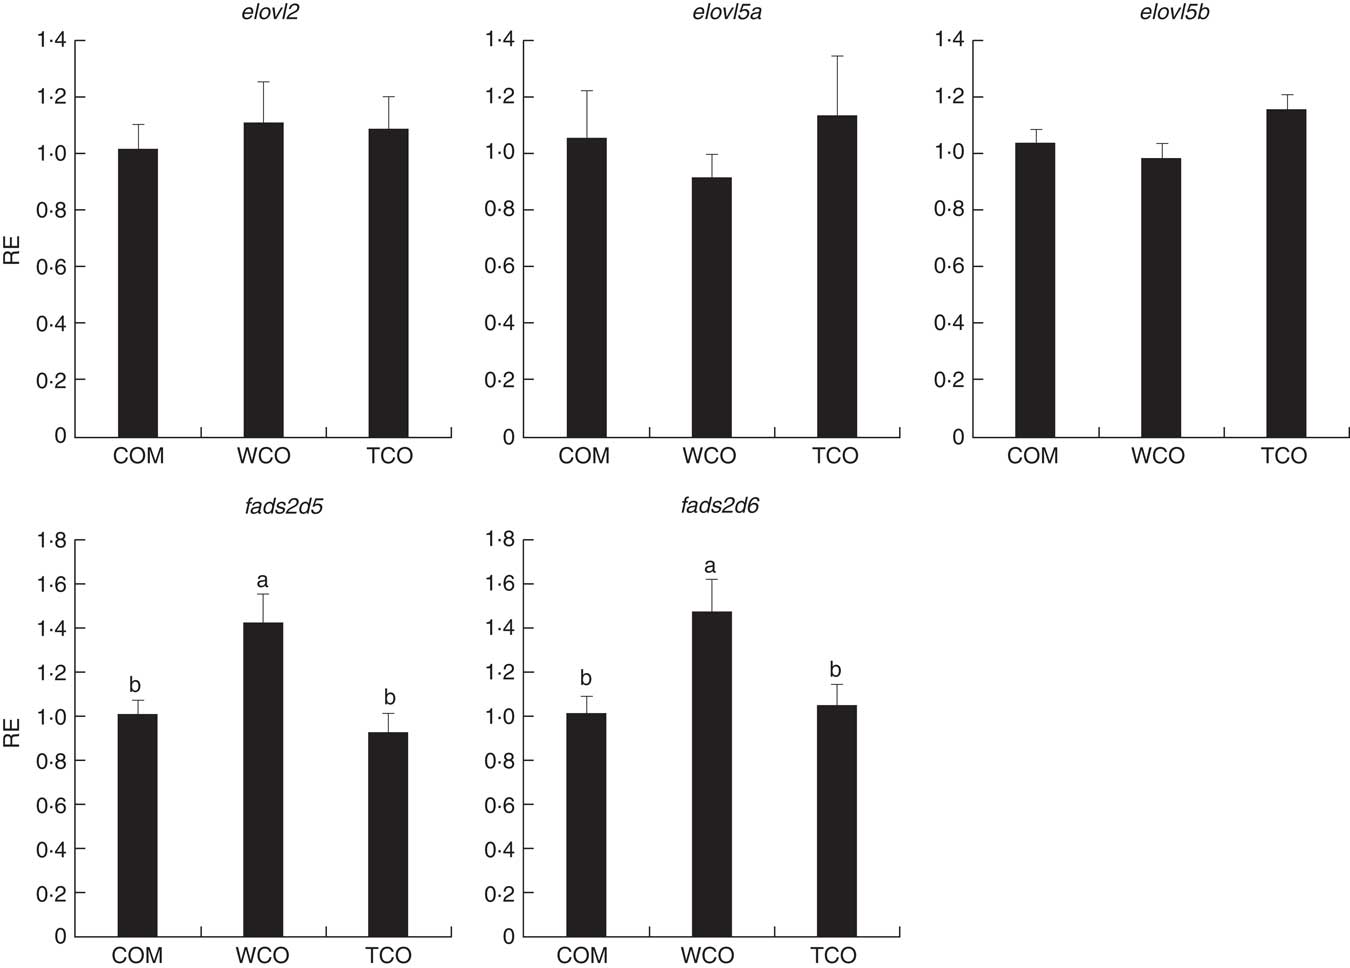
Fig. 4 Relative expression (RE) of genes of the n-3 long-chain PUFA (LC-PUFA) biosynthesis pathway in the liver of Atlantic salmon as determined by quantitative PCR. Values are means (n 6), with their standard errors represented by vertical bars (normalised expression ratios). COM, fish/rapeseed oil feed; TCO, transgenic Camelina oil feed; WCO, wild-type Camelina oil feed; elovl2, fatty acyl elongase 2; elovl5a, fatty acyl elongase 5 isoform a; elovl5b, fatty acyl elongase 5 isoform b; fads2d5, delta-5 fatty acyl desaturase; fads2d6, delta-6 fatty acyl desaturase. a,b Mean values with unlike letters were different among treatments as identified by one-way ANOVA.
Pyloric caeca transcriptome
A greater number of DEG was found in PC compared with liver when comparing fish fed either diets TCO or WCO with fish fed COM (804 and 971 DEG, respectively) (Table 6). However when comparing fish fed TCO with fish fed WCO, the number of DEG was much lower in PC compared with liver (279 v. 506). There were differences in the distribution of genes depending on FC, with a high number of DEG showing FC>2·5, particularly among down-regulated genes.
Only sixty-one genes were commonly regulated in the PC of fish fed TCO compared with fish fed COM and WCO (Fig. 2(b)). Network analysis of the enriched categories showed that most of the genes were related to metabolism, although many also belonged to ‘mTOR signalling pathway’ and ‘regulation of autophagy’ (Fig. 3(b)). After removing non-annotated genes, twenty-four unique genes could be identified as being commonly affected by TCO in PC (online Supplementary Table S4). All the genes presented the same direction of regulation and similar FC in both contrasts (TCO v. COM and TCO v. WCO). High FC were observed particularly in genes related to carbohydrate metabolism (N-acetylgalactosaminide alpha-2,6-sialyltransferase and β-mannosidase), which were up-regulated in TCO-fed fish, particularly when compared with WCO-fed fish (FC of 12·7 and 6·8, respectively). In PC, although there appeared to be a trend for lower expression of most of the LC-PUFA biosynthesis genes in fish fed TCO compared with fish fed COM, this was only significant with elovl5b (Fig. 5).
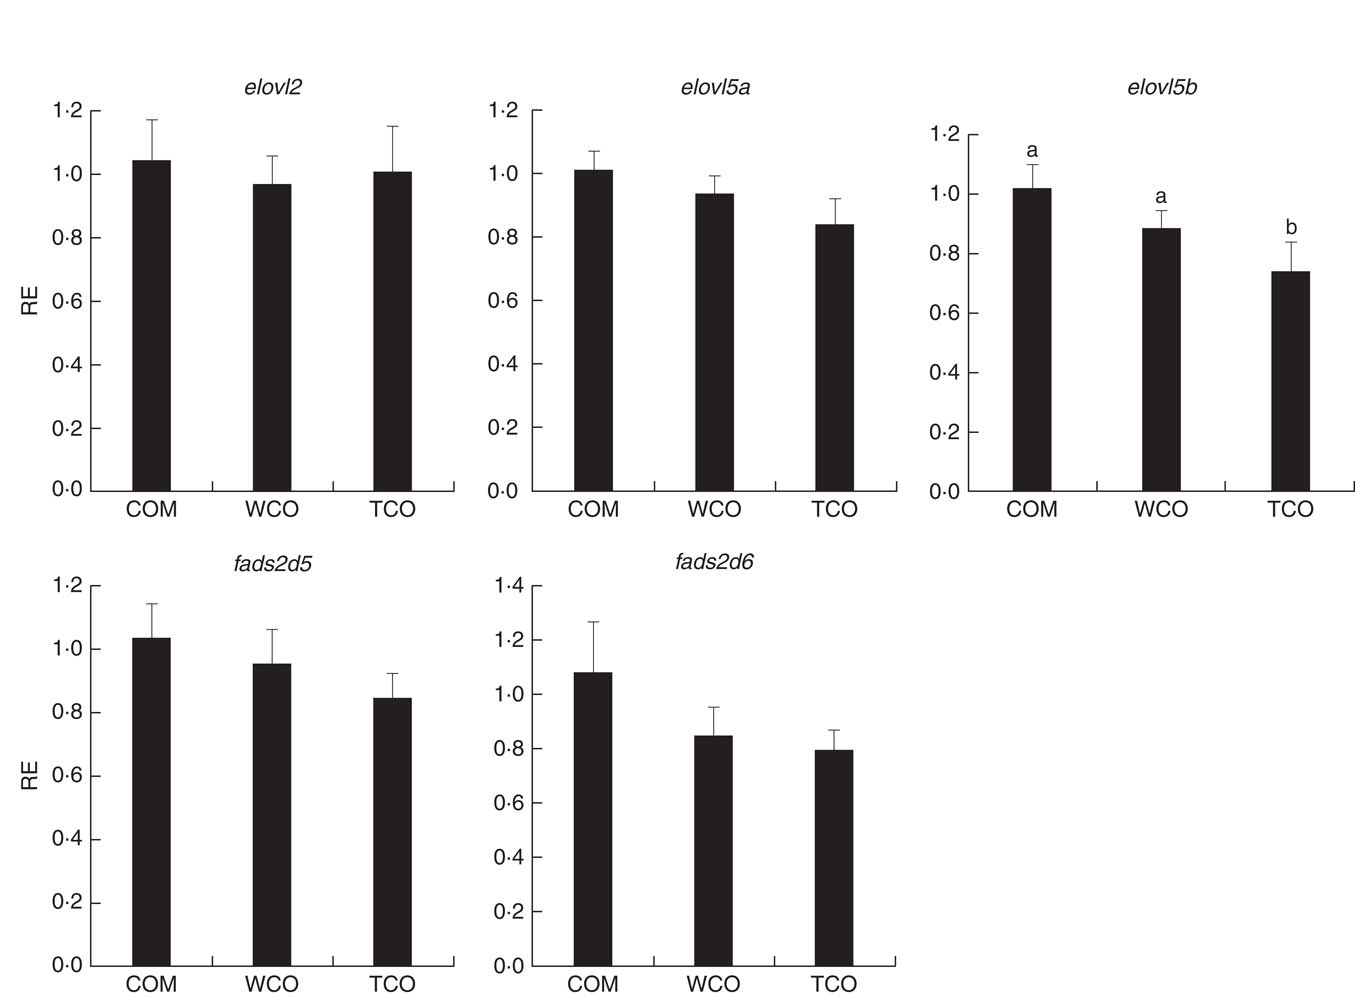
Fig. 5 Relative expression (RE) of genes of the n-3 long-chain PUFA (LC-PUFA) biosynthesis pathway in pyloric caeca of Atlantic salmon as determined by quantitative PCR. Values are means (n 6), with their standard errors represented by vertical bars (normalised expression ratios). COM, fish/rapeseed oil feed; TCO, transgenic Camelina oil feed; WCO, wild-type Camelina oil feed; elovl2, fatty acyl elongase 2; elovl5a, fatty acyl elongase 5 isoform a; elovl5b, fatty acyl elongase 5 isoform b; fads2d5, delta-5 fatty acyl desaturase; fads2d6, delta-6 fatty acyl desaturase; a,b Mean values with unlike letters were different among treatments identified by one-way ANOVA.
Head kidney cell lipopolysaccharide challenge and gene expression
Diet did not significantly affect leucocyte respiratory burst activity, although there was a trend towards lower values in TCO-fed fish (P=0·057; Table 7). Similarly, no differences were observed in phagocytic activity of monocytes/macrophages from fish fed the three dietary treatments (P=0·854; Table 7).
Table 7 Respiratory burst (absorbance per 1×10⁵ cells) and phagocytic activity of macrophages isolated from experimental fish after 12 weeks of feeding the experimental diets(Mean values and standard deviations)

COM, fish oil/rapeseed oil feed; WCO, wild-type Camelina oil feed; TCO, transgenic Camelina oil feed.
Atlantic salmon monocytes were exposed to LPS to study the effect on gene expression at 0, 6 and 24 h after addition. The exposure to LPS triggered a response in all of the genes evaluated, with highest expression levels observed 24 h after application of the challenge (Fig. 6). The FC varied among the studied genes, with the strongest regulation in cox2 (approximately 2500 FC) and the lowest in inos (approximately 4 FC). Two-way ANOVA showed that gene expression was highly affected by sampling time (P<0·001), but diet did not affect expression of any of the studied genes and there was no interaction between diet and sample time.
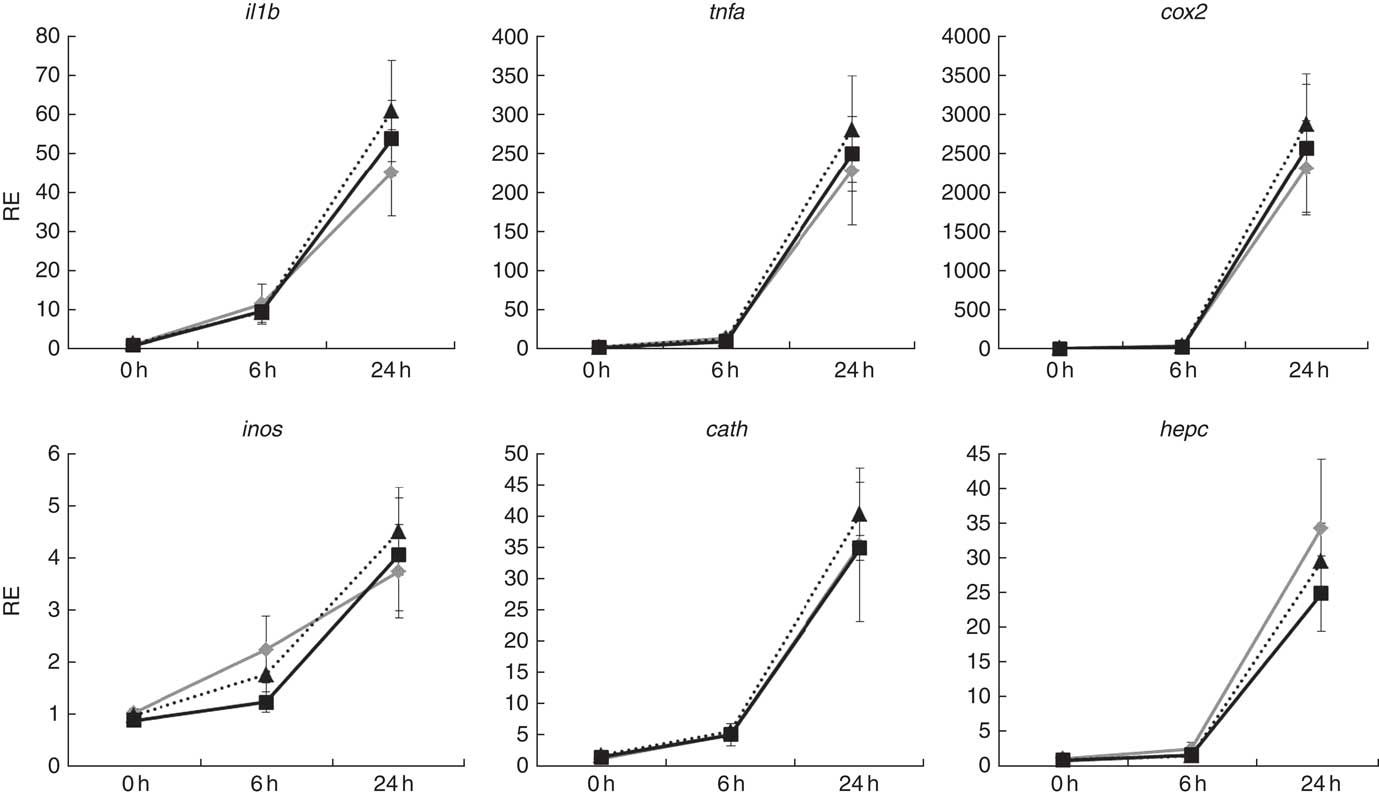
Fig. 6 Relative expression (RE) of genes of inflammation and anti-bacterial activity in head kidney monocytes/macrophages of Atlantic salmon at the end of the experimental trial before (0 h), or 6 h and 24 h after, challenging the cells with lipopolysaccharides. Values are means (n 6), with their standard errors represented by vertical bars (normalised expression ratios). ![]() , Fish/rapeseed oil feed;
, Fish/rapeseed oil feed; ![]() , wild-type Camelina oil feed;
, wild-type Camelina oil feed; ![]() , transgenic Camelina oil feed; cox2, cyclo-oxygenase 2; inos, inducible nitric oxide synthase; cath, cathelicidin; hepc, hepcidin.
, transgenic Camelina oil feed; cox2, cyclo-oxygenase 2; inos, inducible nitric oxide synthase; cath, cathelicidin; hepc, hepcidin.
Discussion
The benefits of n-3 LC-PUFA on several aspects of human health are widely known and appreciated( Reference Calder 2 ). However, recent studies have highlighted the gradual decrease of these essential fatty acids in the flesh of farmed salmon, reflecting the necessary development of sustainable feeds increasingly formulated with lower levels of marine ingredients that supply the n-3 LC-PUFA( Reference Sprague, Dick and Tocher 4 ). Previous studies demonstrated the feasibility of oils obtained de novo from transgenic C. sativa to supply n-3 LC-PUFA in feeds for Atlantic salmon and sea bream, maintaining growth and enhancing n-3 LC-PUFA contents in fillet compared with fish reared on feeds formulated with conventional VO( Reference Betancor, Sprague and Usher 10 – Reference Betancor, Sprague and Montero 14 ). The earlier oils from transgenic Camelina supplied either 20 % EPA or 6 % each of EPA and DHA and were compared with feeds formulated with high fishmeal and FO as ‘gold standards’( Reference Betancor, Sprague and Usher 10 – Reference Betancor, Sprague and Sayanova 12 , Reference Betancor, Sprague and Montero 14 ) and also a feed with lower fishmeal and FO( Reference Betancor, Li and Sprague 13 ). In this study, the latest generation of transgenic oil supplied levels of EPA, DHA and total n-3 LC-PUFA as high as many FO, or higher than those from the northern hemisphere, and was specifically tested in order to evaluate its capability to maintain the sustainability of feeds while simultaneously restoring levels of n-3 LC-PUFA in farmed salmon to those of a decade ago, before the development of low marine feeds( Reference Sprague, Dick and Tocher 4 ).
In the present study, the COM diet was formulated to reflect current commercial feed formulations for salmon and thus included levels of fishmeal and FO that resulted in a dietary n-3 LC-PUFA level of around 7 % of total dietary fatty acids. Replacing the added oil with the oil from transgenic Camelina resulted in the n-3 LC-PUFA content of the TCO diet being almost 24 % of total fatty acids that, in turn, almost doubled the EPA+DHA and n-3 LC-PUFA contents of flesh of the TCO-fed fish compared with fish fed the COM diet. Although the fish in the present trial were not market size and thus the data obtained are not directly comparable with the data presented in Sprague et al.( Reference Sprague, Dick and Tocher 4 ), they nonetheless indicate the potential of this third-generation transgenically derived oil to supply sufficient n-3 LC-PUFA to restore EPA+DHA levels in farmed salmon to levels last seen a decade ago, thus retaining all the positive health benefits associated with the consumption of fish.
As in previous trials, no differences in terms of growth were observed between fish fed the different feeds, which was not unexpected given that the levels of n-3 LC-PUFA contained in all the feeds were sufficient to cover the requirements for this species. For instance, total n-3 LC-PUFA in fish fed diet WCO was still approximately 5·5 % of total fatty acids representing about 1·1 % of diet, already above the reported EFA requirement level without even considering the high dietary level of 18 : 3n-3( 34 ). In agreement with previous trials, Atlantic salmon fed TCO showed a reduced deposition of lipid in whole body and flesh, and, although not always significant, other tissues( Reference Betancor, Sprague and Sayanova 12 ), which could be attributed to the higher contents of EPA and DHA that are known to have anti-adipogenic effects in mammals( Reference Dentin, Benhamed and Pégorier 35 ). In addition, the microarray revealed that acsl, a gene involved in lipid biosynthesis, was commonly down-regulated in TCO-fed fish when compared with fish fed COM or WCO, which could indicate inhibition of lipogenesis. Interestingly, the expression of lpl was also down-regulated in TCO-fed fish, which may or may not be consistent with lower lipid levels in tissues. However, at least three different transcripts exist for lpl in Atlantic salmon, and different patterns of nutritional regulation for each isoform have been demonstrated( Reference Morais, Pratoomyot and Torstensen 36 ).
Although there were no effects on growth performance, some differences were observed in lipid and fatty acid digestibility. The ADC for lipid was generally high and affected by dietary lipid source, being slightly higher in the COM and WCO feeds than in TCO feed. Previous studies in several teleost species generally reported highest lipid ADC in feeds containing FO( Reference Menoyo, Lopez-Bote and Diez 37 , Reference Martins, Valente and Lall 38 ). Indeed, in our previous studies, feeds for Atlantic salmon formulated with either wild-type or TCO displayed higher lipid ADC than feeds containing FO( Reference Betancor, Sprague and Sayanova 11 , Reference Betancor, Sprague and Sayanova 12 ). However the FO-based feeds were formulated with high levels of fishmeal (49 %) and FO (18 %), and thus the content of n-3 LC-PUFA was much higher than in the VO-based feeds, whereas in the present trial diet TCO contained the highest contents of n-3 LC-PUFA. These data suggest that lipid ADC is dependent on the fatty acid profile of the feeds and high contents of n-3 LC-PUFA enhance lipid digestibility as these fatty acids generally have high ADC( Reference Sigurgisladottir, Lall and Parrish 39 , Reference Caballero, Obach and Rosenlund 40 ). Consistent with this, the ADC for the n-3 LC-PUFA were high in this trial and highest in fish fed the TCO diet. Individual fatty acid ADC were also consistent with previous studies where digestibility decreased with increasing chain length, but increased with increasing degree of unsaturation( Reference Sigurgisladottir, Lall and Parrish 39 , Reference Johnsen, Grahl-Nielsen and Roem 41 – Reference Ng, Sigholt and Bell 42 ). Although water temperature can also affect the ADC of fatty acids, particularly when dietary FO is substituted by VO( Reference Ng, Sigholt and Bell 42 ), the trial was performed at a constant controlled temperature throughout, and thus differences in digestibility of individual fatty acids between diets cannot be attributed to water temperature. Overall, diet TCO had no major negative effects on fatty acid digestibilities, and differences between diets could be attributed to the different fatty acid profile of the feeds.
Although diet WCO contained the lowest levels of DHA and n-3 LC-PUFA, fish fed this feed did not show major differences in the contents of DHA in whole fish or tissues compared with fish fed the COM diet. Anadromous species, such as the salmonids, have the capability to biosynthesise LC-PUFA, with liver and intestine being the most active metabolic sites( Reference Morais, Monroig and Zhen 43 , Reference Monroig, Zheng and Morais 44 ). In this respect, fish fed WCO showed up-regulation of hepatic fads2d6 and fad62d5, as well as intestinal elovl5b, which could have contributed to the levels of n-3 LC-PUFA being similar in COM- and WCO-fed fish. Although the COM diet had only a slightly higher level of DHA compared with WCO (3·7 and 2·7 %, respectively) and much lower than in TCO (9·0 %), expression levels of desaturases and elongases were similar to those in fish fed TCO. However, the level of 18 : 3n-3 was almost four times higher in diet WCO than in the COM diet, and it has been suggested that up-regulation of the LC-PUFA biosynthetic pathway in fish fed VO was induced by the level of dietary precursor (18 : 3n-3), as well as low levels of pathway products (e.g. DHA)( Reference Vagner and Santigosa 45 ). Therefore, the lower expression of these enzymes in liver and PC of fish fed COM compared with fish fed WCO could be related to the low dietary level of the substrate 18 : 3n-3.
The PCA analysis partly reflected the physiological functions of each tissue. In general terms, the fatty acid profiles of whole fish and tissues largely reflected that of the diet, consistent with previous studies in Atlantic salmon( Reference Betancor, Howarth and Glencross 31 , Reference Bell, Tocher and Henderson 46 , Reference Bransden, Carter and Nichols 47 ). The four distinct quarters of the plot represent significantly different fatty acid profiles, distinguishing three groups, one per dietary treatment. The fatty acid vectors representing n-6 and n-3 LC-PUFA have significant loadings on the ‘TCO’ side of the plot, which is directly related to the diet fatty acid profiles. This also explains why 18 : 1n-9 vector is placed towards ‘COM’ as this fatty acid is in high concentration in rapeseed oil, which constitutes 75 % of the added oil in that diet. Liver fatty acid profiles from fish fed WCO are located towards the left side of the plot, where fish fed TCO are placed, which reflects the capacity of liver for the synthesis of LC-PUFA. Head kidney of fish fed diet TCO tended to cluster on the left panel reflecting differences in head kidney DHA contents among fish fed the different diets. Although these differences were not significant in the present trial, they were consistent with previous studies in Atlantic salmon, which showed that DHA levels in head kidney reflected the reduced DHA content of VO-based diets( Reference Gjøen, Obach and Røsjø 48 ).
The head kidney in fish is an integral tissue of the immune system( Reference Tort, Balasch and Mackenzie 49 , Reference Gjøen, Kleveland and Moya-Falcón 50 ), and dietary lipid and PUFA content are known to influence immune function and thus health status of fish( Reference Waagbø 51 – Reference Martínez-Rubio, Wadsworth and Vecino 53 ). In this study, no differences were observed in the cellular immune functions evaluated, such as monocyte phagocytic activity or respiratory burst. Previous studies with sustainable feeds have found contradictory results regarding these immune parameters. Although Atlantic salmon fed diets with different VO (100 and 50 % substitution of FO, respectively) did not show altered phagocytic activity nor respiratory burst( Reference Bell, Ashton and Secombes 54 , Reference Seierstad, Haugland and Waagbø 55 ) and rainbow trout (Oncorhynchus mykiss) fed increasing concentrations of ARA showed no differences in phagocytosis( Reference Dantagnan, Gonzalez and Hevia 56 ), sea bream fed diets containing VO (100 % substitution of FO) showed reduced phagocytic activity( Reference Montero, Grasso and Izquierdo 57 ). Differences in the dietary ARA:EPA ratio can alter the production of immunologically active eicosanoids derived from these fatty acids( Reference Ganga, Bell and Montero 58 ), affecting signal transduction and regulation of gene expression( Reference Yaqoob 59 ). Despite this, the functional assays show no negative effects of the oil from transgenic Camelina on the fish immune system. Furthermore, the expression of several genes related to inflammation and anti-bacterial activity evaluated in monocytes isolated from fish after LPS challenge showed no differences in any of the genes among the dietary treatments at either sampling point. Previously, the expression of the pro-inflammatory cytokines il1b and tnfa was not changed 12 h after LPS stimulation in Atlantic salmon after modulation of membrane lipids( Reference Seierstad, Haugland and Waagbø 55 ). Therefore, our results were consistent with replacement of dietary FO by VO in Atlantic salmon feeds having relatively little influence on inflammatory functions of leucocytes. However, in other teleost species, dietary VO can have adverse effects on health/immune system through increasing time to moderate the response up to 7 d after challenge when 70 % of FO was substituted by VO( Reference Montero, Mathlouthi and Tort 60 ). In this respect, the expression of several inflammatory cytokines, as well as the anti-bactericidal gene cath, started to return to basal levels only 72 h after challenging Atlantic salmon monocytes with LPS( Reference Seppola, Mikkelsen and Johansen 61 ).
Transcriptomic analyses showed that diet regulated the expression of a lower number of genes in liver than in PC, with most of the pathways enriched in liver belonging to metabolism, which was consistent given the functions of this tissue. One of the genes commonly regulated by TCO was acsl, which was down-regulated in fish fed TCO compared with fish fed the other two diets. This gene was also down-regulated in salmon fed a similar EPA+DHA-containing Camelina oil in a previous trial( Reference Betancor, Sprague and Sayanova 12 ). After LC-PUFA enters a cell, acsl converts them to fatty acyl-CoA that can have numerous metabolic fates, including incorporation into TAG or phospholipids, or substrates for β-oxidation and protein acylation( Reference Mashek, Li and Coleman 62 ). Interestingly, a recent study reported up-regulation of acsl3 in hepatopancreas of grass carp (Ctenopharyngodon idellus) with increasing levels of dietary ARA( Reference Tian, Lei and Ji 63 ), which is the opposite trend to that described here, as the TCO feed contained a higher level of ARA compared with the other diets. However, previous studies in Atlantic salmon showed no differences in the expression of acsl in liver between fish fed FO and VO, which had different dietary ARA contents( Reference Torstensen, Nanton and Olsvik 64 ). These authors suggested that this gene may function as a general fatty acid activator for several lipid metabolism pathways that are not directly related to β-oxidation. This was consistent with the present results, given that TCO-fed fish had the lowest lipid content in body and flesh that, in turn, could be related to enhanced β-oxidation in fish fed this diet. Among the DEG commonly regulated in fish fed TCO, a transcription factor, pparα, was down-regulated in TCO compared with fish fed the other diets. Up-regulation in the expression of this enzyme, concomitant with the expression of fads2, was observed previously in rainbow trout after substitution of dietary FO with VO( Reference Dong, Tan and Cai 65 ).
The intestine is not only the site of nutrient uptake, but also plays an active role in metabolism. Indeed, two genes of carbohydrate metabolism were up-regulated in fish fed TCO compared with fish fed the other diets despite the feeds not differing in carbohydrate content. In an earlier trial with salmon fed a previous version of TCO, intestinal expression of genes of carbohydrate metabolism such as glucose-6-phosphate isomerase and glycerol kinase 5 was up-regulated( Reference Betancor, Li and Sprague 13 ). Previous studies also reported similar effects, probably reflecting that pathways of lipogenesis, lipolysis, glycolysis, gluconeogenesis and pentose phosphate shunt are all interrelated in the regulation of energy homoeostasis( Reference Morais, Pratoomyot and Taggart 66 ). No genes were found to be commonly regulated in liver and PC in fish fed TCO, probably reflecting the differing functional roles of each tissue.
This study showed that salmon fed the new oil from transgenic C. sativa supplying approximately 24 % n-3 LC-PUFA could accumulate almost double the level of EPA and DHA in their body and fillet compared with fish fed a feed reflecting current commercial formulations containing low levels of marine ingredients. This oil also supported good growth without apparently compromising fish health and immune response, as shown by the ex vivo macrophage challenge and tissue transcriptomic responses. Although fish were not of harvest size (final weight, approximately 400 g), these data suggest that the new oil from a transgenic oilseed crop has the potential to provide a new generation of salmon feeds that, while maintaining current levels of sustainability, are also able to restore the EPA+DHA levels in harvest-size (approximately 4–5 kg) farmed salmon to those last seen a decade ago before the development of low marine feeds.
Acknowledgements
The authors thank Dr John B. Taggart for advice and direction with the microarray analyses.
This project was funded by a Research Council of Norway – Havbruk Programme Award (project no. 245327). The Research Council of Norway had no role in study design, data collection and analysis, decision to publish or preparation of the manuscript.
The authors contributed as follows to the manuscript – study concept and design: J. A. N., O. T., D. R. T. and R. E. O.; formal analysis: M. B. B., K. L., M. S. and L. H.; funding acquisition: J. A. N., D. R. T. and R. E. O.; writing the original draft: M. B. B. and D. R. T.; writing the review and editing: K. L., M. S., O. S., S. U., F. N., O. T., J. A. N. and R. E. O.
The authors declare that there are no conflicts of interest.
Supplementary material
For supplementary material/s referred to in this article, please visit https://doi.org/10.1017/S0007114518001125


