


Introduction
Identifying influential people – those who have a disproportionate ability to affect group- or community-wide behavior, norms or attitudes – has been a long-standing scholarly and practical interest. Influential people may affect others through persuasion, by providing information or by serving as an example for other people in their community. They have been variously labeled by different researchers as ‘social referents’, ‘opinion leaders’, ‘informal leaders’, ‘early adopters’, ‘information leaders’, ‘influencers’, ‘gatekeepers’, ‘taste-makers’ and, as we use here, ‘influentials’ (Rogers & Catano, Reference Rogers and Cartano1962; Watts & Dodds, Reference Watts and Dodds2007).
Researchers and policy and program designers have developed different approaches to finding influential people in a community, such as a workplace, a village or a school. These approaches include asking individuals to nominate other people in their community, identifying individuals through observation or asking key informants with expertise about the community to identify influentials (see Valente & Pumpuang, Reference Valente and Pumpuang2007). Social scientists can describe a community in terms of its social network – a representation of community members’ repeated interactions and relationships (Wasserman & Faust, Reference Wasserman and Faust1994).
These different approaches to finding influential people could be broadly grouped into two categories: approaches that use reports from ‘network insiders’ and approaches that use reports from ‘network observers’. Network insiders are the individuals involved in the repeated interactions and relationships that define the network, whereas network observers are those who have knowledge about the network but do not have the same types of interactions or relationships, and thus are not part of the network in the same way.Footnote 1 Asking humans to identify influential people presents many challenges, and different approaches have different strengths and biases. While existing research documents these various approaches and the success of many of them, very little research has directly compared the relative efficacy of different methods.
In this research, we present findings from a unique study that consulted both network insiders (people belonging to the network) and network observers (those who have some connection to the group but who are not themselves part of the network) about influential people in a community. An experimental intervention measured the causal impact of a group of influential individuals on peer conflict both on their whole school and among their local network peers (Paluck et al., Reference Paluck, Shepherd and Aronow2016). The experiment revealed the prosocial influence of those individuals who had been collectively identified by network insiders.
This paper draws on new data (Paluck et al., Reference Paluck, Shepherd and Aronow2013) to compare the impact of individuals who were identified by network observers to the previously reported impact of individuals identified by network insiders. We also examine differences in the processes by which network insiders and network observers identify influential people. This paper poses the following questions: Can network observers identify people who can significantly influence behavior in a network? How does the influence of individuals who are identified by observers compare to the influence of individuals who are identified by insiders? Finally, what kinds of people do network observers perceive to be influential, and how do they differ from the people identified through the nominations of network insiders?
Answering these questions addresses both theoretical issues about social perception (How do people perceive someone as influential in their community? What are the traits or behaviors of people perceived to be influential?) and practical problems of policies and programs. For many projects that seek to utilize influential group members, consulting a few network observers (versus interviewing many network insiders) is a more convenient and cost effective way to identify influential people in a network.
In this study, we use data from 56 US public schools that vary greatly in terms of their demographic and economic characteristics. In our case, network insiders are students within the schools and network observers are the adults (teachers, administrators, counselors) who work in these schools. These data allow us to examine the task of identifying influential individuals through different methods and under the following conditions: when there is a clear hierarchy stratifying network insiders and observers, and when networks have relatively clear boundaries, inside of which members interact frequently and repeatedly.
We find that network insiders and observers identify substantially different individuals as influential. These different types of individuals also exert different types of influence. Individuals identified by aggregating information from insiders exert a prosocial effect on community-wide and network peer behavior, whereas those identified through observers do not have a significant impact on behavior and, for some outcomes, exert influence in the opposite direction of the intended intervention goals. Our analyses of the characteristics that network observers use to identify influential people suggest that observers could be trained to see like network insiders, which is a potential next step for research and intervention.
Theoretical motivation
A range of methodological approaches consult people who belong to the network under study to find influential network members. In these approaches, individuals who belong to the network participate in the identification of influentials. These network insiders can either directly nominate others they believe to be influential or provide information about their own network relationships (e.g., their friends) that researchers aggregate to identify central people. As an example of direct nominations of influentials, researchers studying the use of peer leaders for HIV prevention among injecting drug users recruited community members and asked them, after discussing the meaning of leadership together, to provide a list of individuals they considered ‘leaders’ (Latkin, Reference Latkin1998). As an example of the aggregation of insider network information, some studies use aggregated friendship nominations to identify high-status students in schools (e.g., Faris & Felmlee, Reference Faris and Felmlee2011) or aggregate reports of sources of gossip in a village to identify central actors (Banerjee et al., Reference Banerjee, Chandrasekhar, Duflo and Jackson2019).
Other approaches identify influentials by consulting network observers. Observers are individuals who are experts on the network or who interact with network members regularly but do not belong to the network in the sense of having similar interactions or relationships with network members. These network observers can nominate influentials directly or provide information about the network. Because the size of a community usually makes it infeasible to ask a network observer to map an entire network, most research asks network observers to nominate the group members that they perceive to be most influential. A study exemplifying this approach involved a community HIV risk reduction program, in which researchers asked bartenders in gay bars to identify influential individuals in the gay community. The individuals identified by the observers (bartenders) were then recruited to become peer leaders in an effort to change sexual practices (Kelly et al., Reference Kelly, St Lawrence, Diaz, Stevenson, Hauth, Brasfield and Andrew1991).
All methods that rely on humans to identify influential people in a network are subject to errors in human judgment, whether those errors are unsystematic or systematic. The biases in judgment that complicate the task of accurately describing a social network and its influential members include network insiders’ imperfect memory of their own connections and network observers’ imperfect perception of interactions and relationships (Breza et al., Reference Breza, Chandrasekhar and Tahbaz-Salehi2018). For example, people often misperceive their own position in the network (assessed by the number of people connected to them), as well as the position of their peers (Kumbasar et al., Reference Kumbasar, Rommey and Batchelder1994).
People also have varying levels of accuracy in perceiving the relationships among network members (Krackhardt, Reference Krackhardt1987). Among network insiders, individuals who are more central (have more connections to others), who are more socially similar to people they are assessing and who occupy lower positions in the formal hierarchy of a group are more accurate in perceiving social network structure (Bondonio, Reference Bondonio1998; Casciaro, Reference Casciaro1998). Network observers, by contrast, may be more accurate judges of a network because they are less entangled in the social dynamics of the group (e.g., Kelly et al., Reference Kelly, St Lawrence, Diaz, Stevenson, Hauth, Brasfield and Andrew1991). At the same time, they also have less information and may be biased by the particular role they play as an observer of the network (Valente & Pumpuang, Reference Valente and Pumpuang2007). For example, they may have formal positions of power over network members or they may play a circumscribed role in the community in which they do not observe members interacting across situations.
A more general problem with biased human judgment of networks involves the specific kinds of questions researchers pose to insiders or to observers. Information gathered from humans about social networks can vary stochastically because different people interpret the questions in many different ways – for example, questions about with whom you ‘discuss important matters’ (Bearman & Parigi, Reference Bearman and Parigi2004).
While information from individual network insiders may be biased, aggregating information from insiders about social networks may limit the influence of some of these biases in judgment and perception. Paluck et al. (Reference Paluck, Shepherd and Aronow2016) asked all community members (network insiders) to nominate up to 10 other network members with whom they decided to ‘spend time, face to face or online’ in the past few weeks. This bottom-up approach uses insiders to identify the most perceptually salient network members without directly asking them to make judgments about who is influential. Paluck et al. (Reference Paluck, Shepherd and Aronow2016) demonstrate that the social referents identified by this kind of complete network analysis – those with a high number of nominations from others, or ‘central’ people, for short – indeed influence others’ perceptions and behaviors. This method, however, is resource-intense and difficult to scale as a policy solution.
We know little about the correspondence between different types of approaches. In particular, how similar are influential community members identified using network insider and network observer approaches? One study on the adoption of innovations by dairy farmers in central Ohio used both network insiders and network observers (‘key informants’) to identify the most influential members of the network (Havens, Reference Havens1962). This study found a strong correlation (r = 0.88) between the individuals identified by insiders and observers. However, we do not know how specific this finding is to the case, and the study was unable to compare the causal impact of individuals identified as influential farmers through these different methods on the adoption of innovations by other farmers.
To our knowledge, no study has compared the influence of central individuals identified using different methods, particularly in terms of their causal impact on other network members or on the network as a whole. This question is best addressed using a multi-method assessment of influential individuals, paired with a randomized experiment that assesses the causal influence of central individuals by mobilizing a random subsample of them to change the attitudes, norms or behaviors of others in their network. We leverage just such a design to assess the relative efficacy of insider- and observer-identified individuals.
By comparing these two identification methods, we evaluate whether a complete-network survey of insiders is necessary in order to identify influentials. If fewer observers can identify influentials who exert influence on others, then this more efficient method can be used to initiate and scale up network-based interventions. This project contributes to theoretical questions on social perception by comparing network observers’ perceptions of who is influential to the aggregated experiences of network insiders.
We describe differences in the characteristics of central students, identified through the insiders (students), and teacher nominees, identified as influencers by the observers (teachers). Some students were both central and teacher nominees; we describe the extent and nature of this overlap. We then compare the influence of the central students and the teacher nominees who participated in the year-long anti-conflict group on other students’ perceived norms and conflict behaviors.
We find that the pool of teacher nominees overlaps very little with the pool of central students, and that the two groups of students differ in various ways. Furthermore, in contrast to the prosocial effects of central students on peer conflict, teacher nominees have no, or even antisocial, influence on their peers’ behaviors. Teachers generally nominated students who were most salient to them, suggesting that observer roles may systematically bias their selection of influential individuals.
Method
Study overview
Paluck et al. (Reference Paluck, Shepherd and Aronow2016) designed a field experiment aimed at reducing peer conflict in US middle schools.Footnote 2 We draw on data from that field experiment to identify a set of central students based on complete social network data from students at each of 56 middle schools at the beginning of the school year. Central students were those in the top 10% of their school in terms of the number of nominations received from other students as someone they choose to spend time with. Also at the beginning of the school year, teachers in each school completed a survey that asked them to nominate influential students – the teacher nominees. The field experiment randomly assigned students within each school to participate in an anti-conflict group through the school year. Some of these anti-conflict group students were central students and some were teacher nominees. This design allows us to experimentally test the relative influence of these two types of students on other students’ perceptions of conflict and conflict behaviors.
Experimental design
After conducting surveys with all students in 56 public middle schools, the researchers identified students eligible to participate in the anti-conflict group using a deterministic algorithm to select 15% of the school population, blocked by grade and gender, and capped at 64 students per school. After schools were blocked into similar groups of four,Footnote 3 half of the 56 schools were randomly assigned within blocks to the intervention condition (treatment or control). A randomly selected half of the eligible students were invited to participate in the anti-conflict intervention program. These randomly selected students – ‘seeds’ – were trained to generate their own solutions for taking a stance against conflict and spreading anti-conflict norms and behaviors in their school (see brief description of the anti-conflict program below and more details in Paluck et al., Reference Paluck, Shepherd and Aronow2016). Across the 28 treatment schools, 728 students were selected as seeds (an average of 26 students per school). Because the seed students were randomly selected from the pool of seed eligible students, the composition of the intervention groups varied between treatment schools.
The anti-conflict intervention
The anti-conflict group, led by trained members of the research team, met every other week. These students were prompted to think of typical peer conflicts in the school. They were then encouraged, through a series of activities, to advocate against these types of conflict. For example, groups at each school created hashtag slogans about addressing behaviors they identified as problematic and turned them into online and physical posters. Students from the group also distributed orange wristbands with the intervention logo (a tree) to other students as a reward for engaging in friendly or conflict-mitigating behaviors. Overall, more than 2500 orange wristbands were handed out to students in the 28 treatment schools.
Central students identified through students’ (insiders’) network survey
As part of the all-school survey, which was conducted both at the beginning and at the end of the school year, students were asked to name up to 10 students at their school they ‘decided to spend time with face to face or online in the last few weeks’. They were provided with a roster of all students at the school, alphabetized by first name and sorted by grade and gender, in order to complete the survey. On average, students made 7.6 nominations. Students in the top 10% of their school in terms of the number of nominations they received from other students (i.e., network indegree) at the beginning of the school year are considered the central students. Because these central students are most salient to other students in their everyday interactions (i.e., they are students who many others choose to spend time with), they were hypothesized to be most likely to shape other students’ perceptions and influence their behaviors (Paluck & Shepherd, Reference Paluck and Shepherd2012).
Students identified as influential by teachers (network observers)
Researchers requested that teachers and other school staff take an online survey that asked them to identify specific students who ‘seem to: influence other students (positively or negatively), be respected by other students, or be at the center of things in their group or within the school’. The teachers used the same roster as the students to nominate up to seven such students. On average, teachers nominated 4.7 students. Teacher nominees are those students who were in the top 10% of the number of teacher nominations in their school. Because there were fewer teachers and because teachers nominated fewer students than students did, in practice, any student receiving even one nomination was in the top decile for their school and was designated a ‘teacher nominee’ in the data.
Characteristics of network observers (teachers)
The teacher and staff survey was voluntary. A total of 1565 school staff completed the survey, an average of 30 teachers per school. In 13 out of 56 schools, 10–25 staff members per 100 students completed the survey. In 28 schools, 5–10 staff members per 100 students completed the survey. In the 15 other schools, 2–5 staff members per 100 students completed the survey, except for 1 school in which no teachers completed the survey. This school was excluded from the analyses.
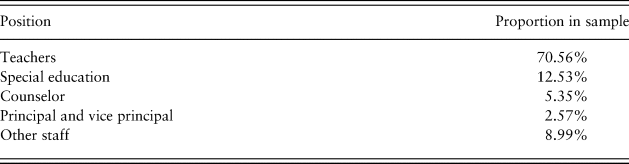
As displayed in Table 1, the sample of respondents included teachers (70.56%), special education teachers (12.53%), counselors (5.35%), principals (2.57%) and other teaching and nonteaching staff such as librarians, medical staff, band directors or administrative secretaries (8.99%). Respondents took the survey between one and two months after the beginning of the school year, and in these schools, teachers often taught multiple grades.
Table 1. Description of the sample of observer respondents.
Overlap analysis
Central students and teacher nominees are not mutually exclusive designations. To quantify the overlap between central students and teacher nominees, we calculate the proportion of teacher nominees who are also central students. In this paper, we do not remove the students who are both central students and teacher nominees from any analyses. Instead, we focus on understanding the differences between the two identification strategies as opposed to examining the characteristics and effects of the students who are seen as influential uniquely by insiders or outsiders. This analytical choice also provides us with additional statistical power.
Comparing the effect of central students and teacher nominees
Because the proportion of central students and teacher nominees in the anti-conflict group at each school varied due to random assignment, we can compare the effect of the proportion of central students and teacher nominees on school-level behavioral outcomes at different treatment schools. Moreover, because the selected seed central students and teacher nominees are comparable to the central students and teacher nominees who were not selected into the anti-conflict groups, as are their local networks, we can rigorously compare the spread of norms and other behaviors through local networks that result from assignment to the anti-conflict group. Throughout the rest of the paper, when we refer to the causal impact of central students and teacher nominees in the anti-conflict group, we are referring to those who were randomly selected as seeds to participate in the anti-conflict group.
Outcome measures
We use both student and teacher survey data and administrative data from the schools in order to: (1) characterize central students and teacher nominees, as well as students who were both central students and teacher nominees; (2) assess the relative influence of these two types of students on other students; and (3) compare the characteristics of central students and teacher nominees to examine the traits associated with the teacher nominations of influentials in the network.
The student surveys included questions on sociodemographic variables such as the students’ race and gender, as well as indicators of their family income and socioeconomic status: the students were asked whether or not their friends usually tell them that they have a nice house (an age-adjusted measure of socioeconomic status), whether their mother went to college and whether they only speak English at home.
Students also reported on their social life, activities and beliefs in the survey. We use data on whether the students have older siblings, take music, theater or drama classes, practice sports inside and outside of school, date someone, use social media, have friends come over to their house or moved in the past year. In order to assess students’ engagement with school, we use questions about whether or not they had college plans, read books for fun or reported doing lots of homework. In order to assess students’ orientations toward conflict, the survey conducted at the end of the school year asked the students about the extent to which they talked with friends about how to reduce conflict in their school (scale of 0–3).
The survey also assessed students’ perception of social norms in their schools. We use data on their perceptions of descriptive norms (e.g., ‘how often do you see students: [threatening, hitting or pushing]’) and prescriptive norms (e.g., ‘how many students think it is [NOT good to threaten, hit or punch]’) (see Appendix AFootnote 4 for the full list of items). Students were asked to answer descriptive norms questions on a scale from 0 to 4, with answers ranging from ‘never’ to ‘every day’, and prescriptive norms questions on a scale from 0 to 5, with answers ranging from ‘almost nobody’ to ‘almost everybody’. Following Paluck et al. (Reference Paluck, Shepherd and Aronow2016), the outcome variable that we use to estimate perceived social norms against conflict in treatment and control schools is the first factor (or component) of a factor analysis that involves all of the descriptive or prescriptive norms questions.
Most schools (n = 49) provided administrative records about which students were disciplined for peer-related conflict events, instances of absences and tardies or various other infractions not targeting peers (e.g., graffiti, drugs and alcohol, cheating or forgery). From these data, we generate three outcome variables that we use in the analyses below, sums of the number of instances of (1) peer conflict, (2) absences and tardies and (3) infractions not targeting peers. We use the first of these measures to evaluate the causal impact of students identified as influential and we use the second two measures to describe the characteristics of students identified as influential using different methods.
Analytical approach
School-level analysis
We conduct school-level analyses to estimate the influence of the central students and teacher nominees on their peers. Again, because students were randomly assigned to the seed groups before the start of the intervention, the proportion of central students and teacher nominees varies between groups. Thus, we can estimate the causal effect of the proportion of central students and teacher nominees in the seed group on four main school-level variables: average peer conflict disciplinary events; average perceptions of norms opposing conflict; average reports of talking with friends about how to resolve conflict; and average reports of wearing an orange wristband. We use linear regression models with interaction terms for the school treatment condition and anti-conflict group composition, either the proportion of central students or teacher nominees in each anti-conflict group.Footnote 5 Confidence intervals and p-values were computed using robust standard errors under a normal approximation.
Local network-level analysis
We use Paluck et al.'s (Reference Paluck, Shepherd and Aronow2016) analysis strategy to estimate the impact of being directly exposed to central students or to teacher nominees on other students’ peer conflict disciplinary events, perceptions of school norms against conflict, probability of talking with friends about how to resolve conflict and wearing an orange wristband. Random assignment of students and schools prior to the intervention allows the retrieval of the exact probability that each student in a school network was exposed to a seed student, and if exposed to a seed student, the probability that the seed was a central student, a teacher nominee or neither. Using inverse probability weighting and weighted least squares regression, we use students’ probabilities of exposure to predict population means of potential outcomes. Differences between these population means of potential outcomes represent average causal effects. As a result, we can compare, for instance, average potential outcomes of students in treated schools to students in control schools, conditional on being exposed to treated teacher nominees or treated central students (Paluck et al., Reference Paluck, Shepherd and Aronow2016). We consider four levels of exposure: (1) students in control schools; (2) students in treated schools for whom no network peers are seeds; (3) students in treated schools for whom at least one network peer is a seed, but no seed is a central student or teacher nominee; and (4) students in treated schools for whom at least one network peer is a central student or teacher nominee seed.
Results
The majority of teacher nominees are not central students
A total of 80% of the student population (n = 1799) received at least one teacher nomination and is thus considered a teacher nominee. Most teacher nominees are not central students: only 28% (n = 506) of the total number of teacher nominees are also central students. In order to better understand the differences between the types of students, we compare central students and teacher nominees to each other on a number of dimensions.
Social visibility of central students and teacher nominees
By definition, central students are significantly more socially visible in their school's network, as assessed by the number of spend time nominations they receive, compared to other students in the network. Teacher nominees are significantly more socially visible than other students in the network by this same standard, but less socially visible than the central students in terms of number of spend time nominations they received. The average indegree of teacher nominees is 10.41 (SE = 0.11, confidence interval [CI] = 10.18–10.64), which is significantly larger than the average indegree of all non-central students (μ = 7.53, SE = 0.03, CI = 7.48–7.58). However, teacher nominees’ indegree is on average significantly lower than the average indegree of central students (μ = 15.96, SE = 0.06, CI = 15.83–16.08).
Teacher nominees are less similar to the school average than are central students
Central students have characteristics more similar to those of the average student in their school than do teacher nominees (Figure 1), where the average student is defined as the average across all students in a school, including central students and teacher nominees. Using difference-in-difference analysis and bootstrapped standard errors, we compared the average difference in the mean of 29 z-scored variables (e.g., Grade Point Average [GPA], disciplinary events, sports, norm perception, race, gender; see Appendix B for the complete list of variables and formal model) first between central students and the average student in a school, then between teacher nominees and the average student in a school. The difference-in-difference analysis is displayed clustered by school block; in 11 out of the 14 school blocks (78%), the teacher nominees are, on average, significantly less similar to the average student than are the central students.
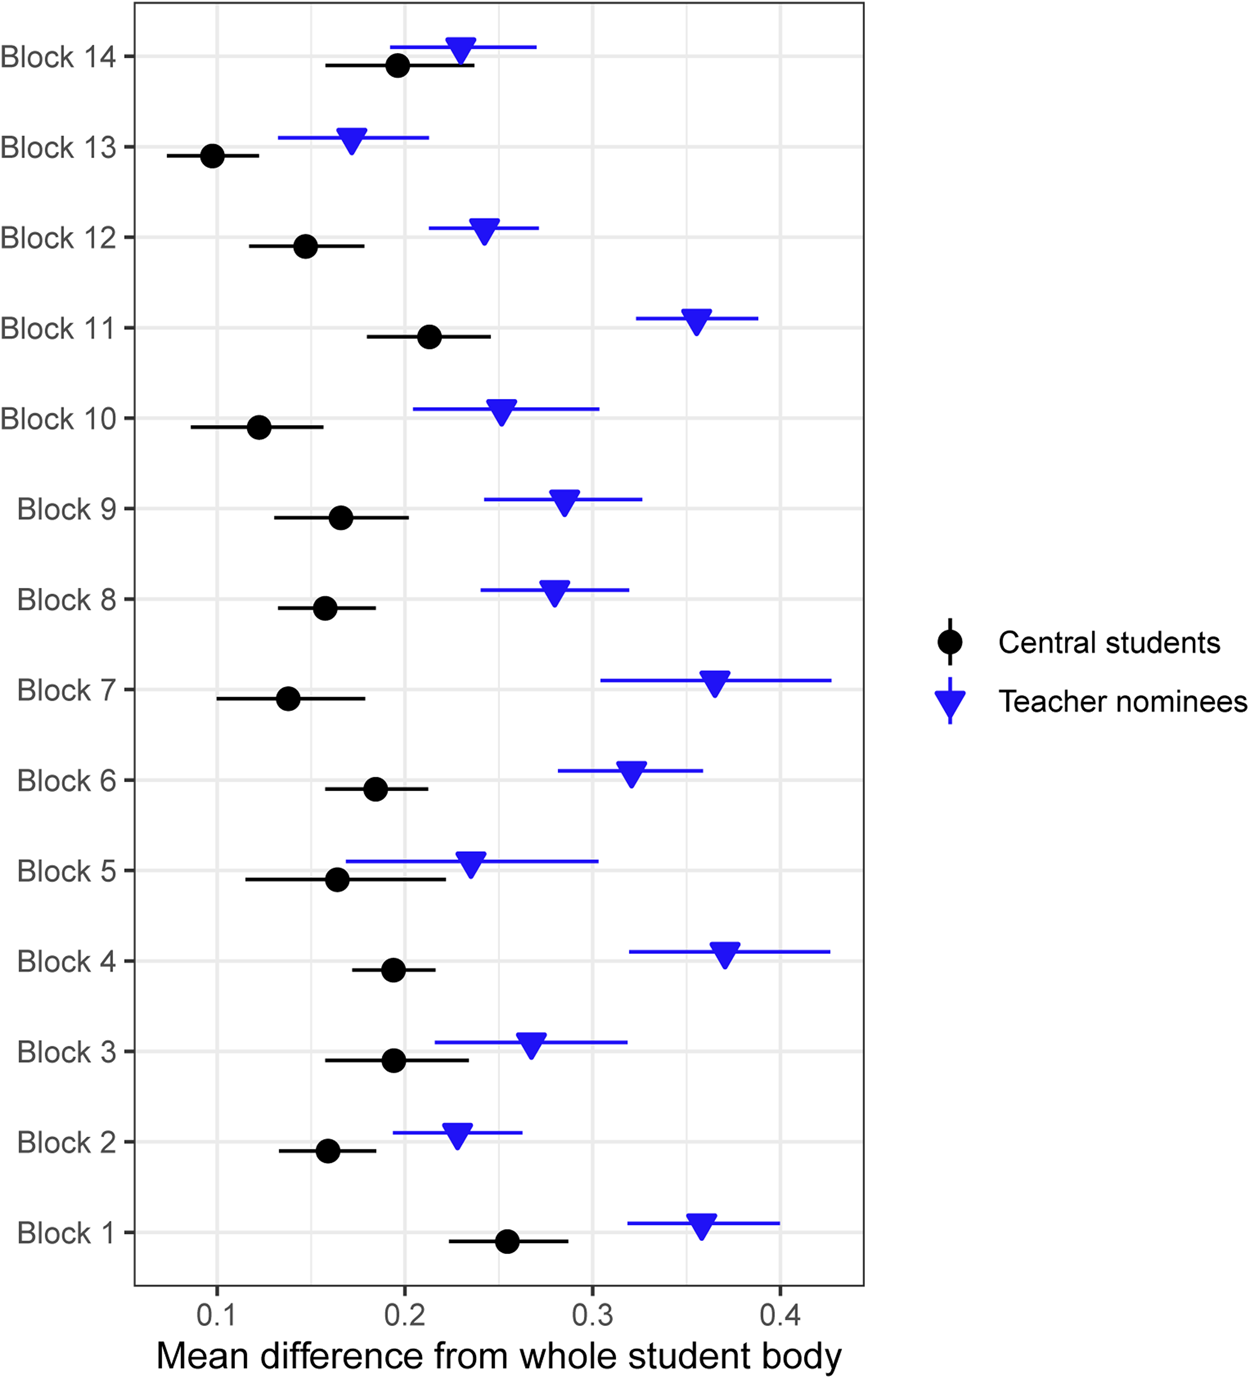
Figure 1. Distance between the school average and the central students (lines with circles) or the teacher nominees (lines with triangles), where 0 is no difference. Distance is calculated for each school block, which was based on sociodemographic, academic, social behavior and norm perception variables. For each school block, we bootstrapped 1000 differences between the mean score of all of the variables (see Appendix B or Figure 4) for (1) central students and all students from the same block and (2) teacher nominees and all students from the same block. We took the 5th and 95th quantiles of each resulting difference in mean distributions to generate the 95% confidence intervals. This difference-in-difference analysis reveals that the central students are, on average, more similar to the school body than are the teacher nominees.
School-level causal impact of proportion of central students and of teacher nominees in anti-conflict groups
Figure 2 illustrates the causal impact of the proportion of central students (left-hand graphs) or teacher nominees (right-hand graphs) in the anti-conflict groups on four different school-level outcomes: average peer conflict disciplinary events; average reports of talking with friends about how to resolve conflict; average reports of wearing an orange wristband; and average perceptions of norms opposing conflict. The predicted values are bounded with 95% CIs represented by dotted lines and calculated using robust standard errors (see tables of coefficients in Appendix C).
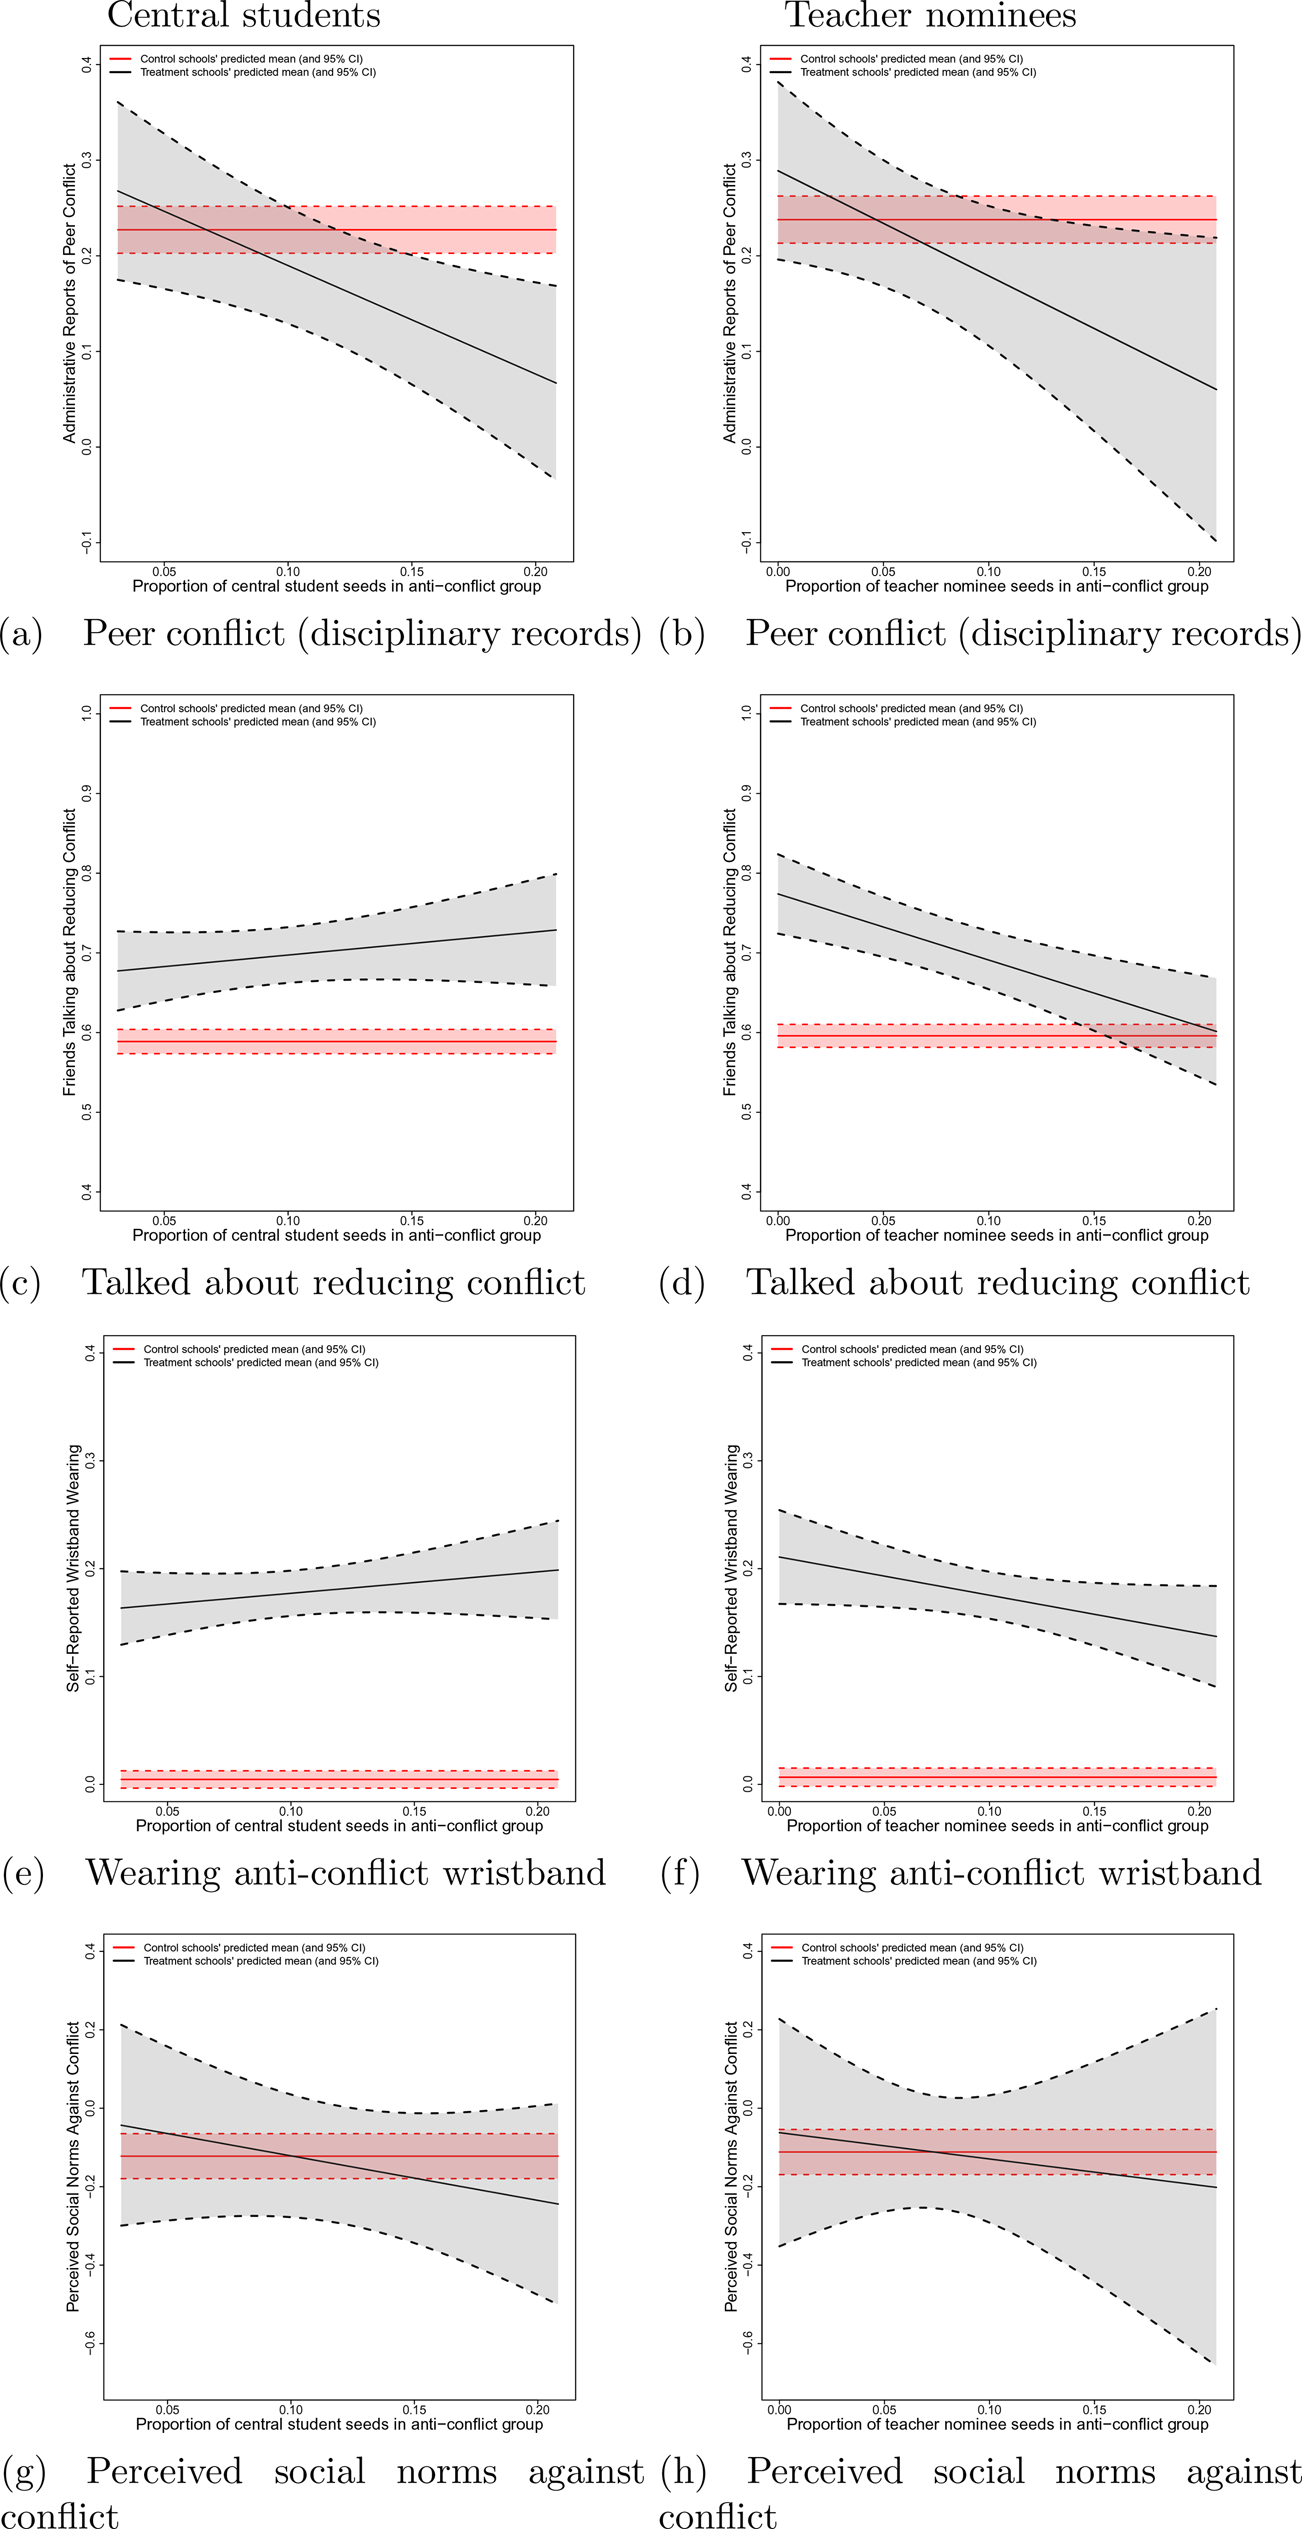
Figure 2. The figures of this panel illustrates the causal effect of the proportion of influential students in anti-conflict groups on school-level climate outcomes, quantified by the difference between treatment and control schools. The x-axis specifies the proportion of central students (left-hand side of the panel) or teacher nominees (right-hand side of the panel).
Despite the differences in the characteristics of central students and teacher nominees, the predicted effects of the proportion of central students and teacher nominees on school-level peer conflict are both prosocial: a higher proportion of either type of student in the group causes lower average peer conflict. However, the difference does not reach statistical significance at the 95% confidence level for the proportion of teacher nominees. As reported in Paluck et al. (Reference Paluck, Shepherd and Aronow2016), the treatment difference is statistically significant for the proportion of central students.
In contrast, the effects of the proportion of central students and of teacher nominees are in opposing directions for the average probability of talking about how to resolve conflict and of wearing an anti-conflict wristband. The proportion of central students in the anti-conflict group increases talking about how to resolve conflict and wearing an anti-conflict wristband, while the proportion of teacher nominees decreases talking about how to resolve conflict and wearing an anti-conflict wristband.
Finally, consistent with the findings of Paluck et al. (Reference Paluck, Shepherd and Aronow2016), neither the proportion of central students nor the proportion of teacher nominees in the anti-conflict group impacts average school-level perceptions of social norms about conflict compared to control schools. The similarity of average school-level social norm perceptions in treatment and control schools could be driven by a number of factors. As Paluck et al. (Reference Paluck, Shepherd and Aronow2016) suggest, even when anti-conflict interventions are effective, their deployment may be interpreted by some community members as a sign of the prevalence or intensity of conflict in the community. The negative perception of norms among students in the treatment schools who were not connected to central students in the program (relative to students who were connected to central students in the program) provides some supporting evidence of this interpretation.
Local network-level causal impact of central students and teacher nominees
We now examine the causal effect of exposure to central students and teacher nominees on their network peers. For each outcome, Figure 3 displays estimates of the predicted means for groups of students with exposure to different types of peers. The estimate for exposure to the anti-conflict groups’ central students appears in the farthest right point on the left-hand graphs; exposure to the anti-conflict groups’ teacher nominees appears in the farthest right point on the right-hand graphs. Peer influence estimates are bounded by 95% CIs computed using random permutations of treatment assignment under an assumption of constant effects.Footnote 6
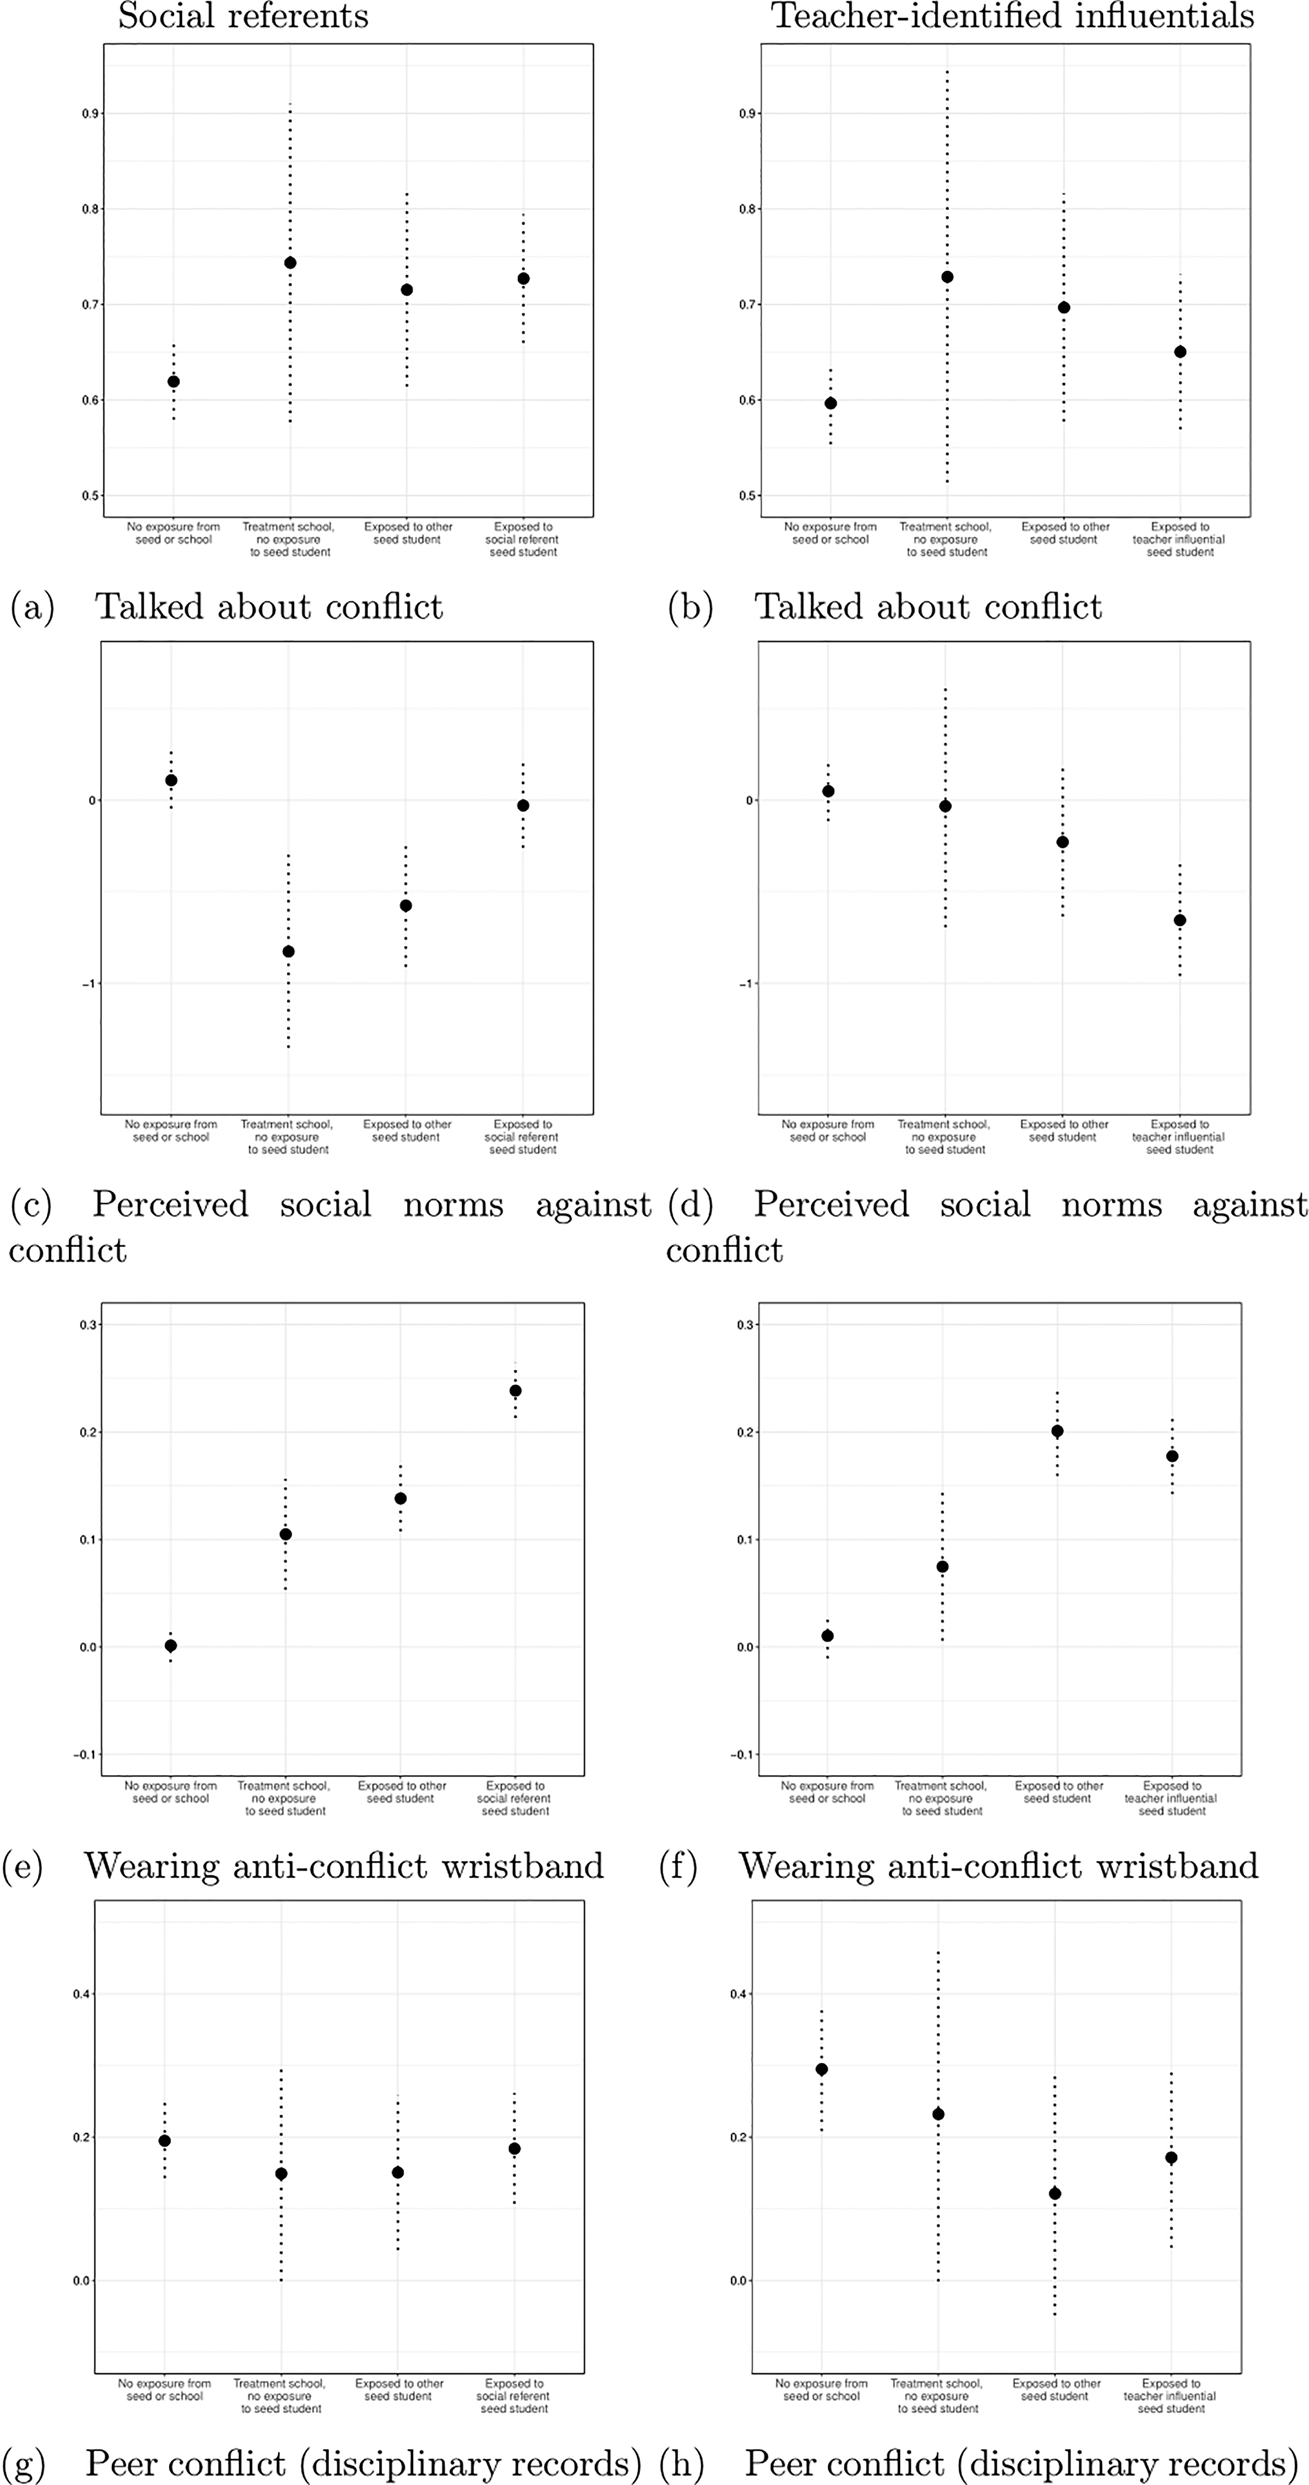
Figure 3. Causal influence effects from central students and teacher nominees. The graphs represent estimates of predicted means under different levels of exposure. We generated the 95% confidence intervals via randomly permuting treatment assignment under an assumption of constant effects. These network analyses are restricted to the subpopulation of students who had a positive probability of all four levels of exposure. This left 2651 students in the central student analysis and 1367 students in the teacher nominee analysis. For this reason, the estimates for ‘no exposure to seed or school’ and ‘no exposure to seed students in treatment schools' differ between the central student and teacher nominee analyses.
Central students have a significant and positive causal impact on their network peers’ probability of talking about how to resolve conflict when compared to students in control schools, perception of social norms about conflict (compared to all other exposure groups in treatment schools) and probability of wearing an anti-conflict wristband (compared to all other exposure groups) (Paluck et al., Reference Paluck, Shepherd and Aronow2016). In contrast to central students in anti-conflict groups, teacher nominees in anti-conflict groups have either no impact or negative impact on their peers’ conflict-related outcomes. The network peers of teacher nominees were as likely to have talked about how to resolve conflict with their friends as the students from any other type of exposure, including students in control schools, and they had significantly more negative perceptions of norms regarding conflict than students in control schools. Finally, the teacher nominees had no more impact on their peers’ probability of wearing an anti-conflict wristband than did other seed students. We find no statistically significant influence of central students (Paluck et al., Reference Paluck, Shepherd and Aronow2016) or teacher nominees on the probability of being disciplined for peer conflict violations.
While teacher nominees have null or negative influence on school-level anti-conflict outcomes and on the anti-conflict beliefs and behaviors of their network peers, central students exert positive influence on anti-conflict school and local network outcomes. These central students are more valuable to group change efforts. This leads us to ask: (1) which teachers are better at identifying students who are more similar to the central students? And (2) what are the systematic differences in who network observers perceive to have social influence in the group?
Which teachers and school staff are most likely to identify central students?
While teachers who are in charge of ‘mainstream’ classrooms (those not targeted to students with special needs) make up the majority of the sample of the staff survey, variability in the role that respondents occupy in their school allows us to examine the relationship between different roles and identifying those influential students identified by nominations from network insiders. We use regression to compare different school staff members’ success at nominating central students (Table 2). To do so, we create a binary variable for whether a teacher nominee is a central student (0 otherwise). We then compute a variable that includes the number of each teacher's nominees who are also central students. We regress this ‘hit score’ variable on the school staff members’ role (mainstream classroom teacher is the default category), controlling for the number of students they identify as influential, and age as a proxy for experience. Staff member role in the school is associated with the likelihood of nominating central students. Special education teachers are significantly less likely to nominate students that overlap with central students compared to mainstream classroom teachers who, on average, nominated one central student. School principals and vice principals, in contrast, are more likely than regular teachers to nominate the central students (Table 2).
Table 2. Relationship between school staff characteristics and their probability of nominating a central student.
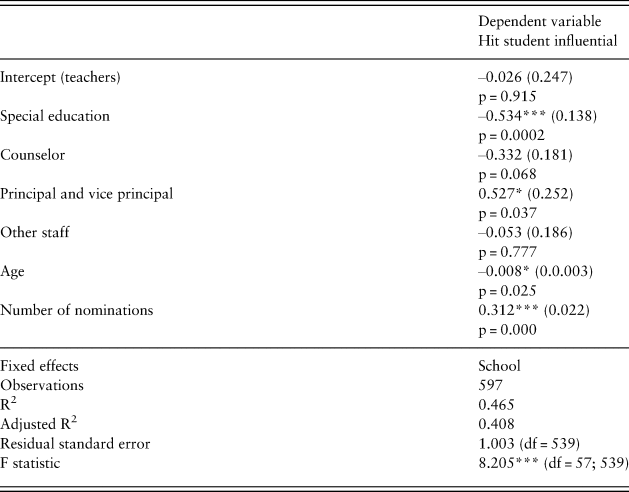
Data are regression coefficients with standard errors in parentheses, unless otherwise states.
*p < 0.05, **p < 0.01, ***p < 0.001.
Observers nominate students with characteristics salient to them
Finally, we turn to the question of what student traits are associated with teacher nominations of influential students. Our analysis can provide some preliminary indications about the processes of social perception that are relevant to the ways outsiders identify influentials. We examine the idea that teachers may use particularly salient (observable) student characteristics in order to identify influential students. We use multiple regression analysis to compare the characteristics of teacher nominees and all other students, then of central students and all other students. We then describe the systematic differences between the characteristics of these two types of students in order to assess which student characteristics teachers use as they think about who is influential. Specifically, using the entire sample of students from control and treatment schools, we regress a binary variable Ycentral (1 if a student is a central student in a treatment school or not, 0 otherwise for all other students in the sample who are not central students) on 29 individual characteristics relevant to describing students, displayed in Figure 4. The model can be written:
 $$central_{ij} = {\rm \beta }_0 + {\rm \beta }_1X_{1ij} + {\rm \beta }_2{\rm X}_{2ij} + \ldots + {\rm \beta }_{29}{\rm X}_{29ij} + {\rm \delta }{\rm Z}_j + {\rm \varepsilon }_{ij}$$
in which centralij is a binary variable indicating whether student i in block j is a central student, Xnij is one of the 29 variables reported on the y-axis of Figure 4, Zj indicates the fixed effect of school blocks and ε is an error term.
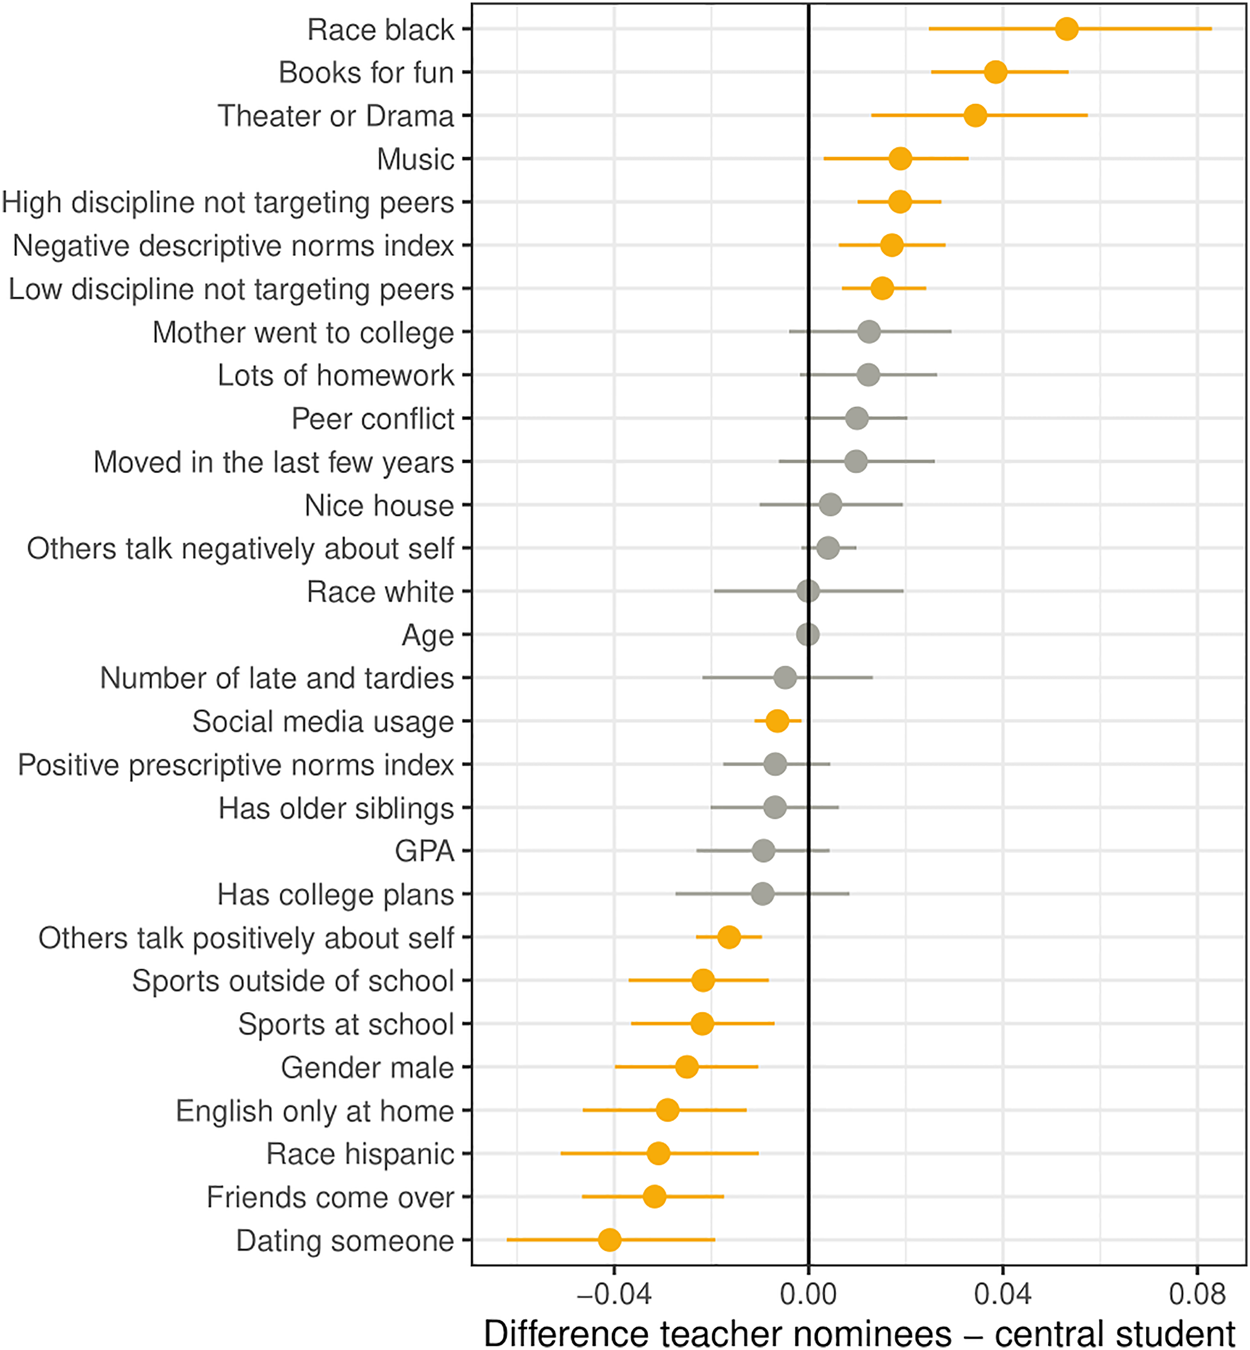
Figure 4. Illustration of the student characteristics associated with teacher nominees in comparison to characteristics associated with central students. The x-axis represents differences in the standardized coefficients between the teacher nominees compared to all other students, and the central students compared to all other students. Estimates are bounded by bootstrapped confidence intervals. GPA = Grade Point Average.
Similarly, we then regressed a binary variable for teacher nominees on the same set of items of variables Xn. The model can be written:
 $$teachernom_{ij} = {\rm \beta }_0 + {\rm \beta }_1{\rm X}_{1ij} + {\rm \beta }_2{\rm X}_{2ij} + \ldots + {\rm \beta }_{29}{\rm X}_{29}{\rm ij\ } + {\rm \delta }{\rm Z}_j + {\rm \varepsilon }_{ij}$$
in which teachernomij is a binary variable indicating whether student i in block j is a teacher nominee, Xnij is the value of one of the 29 variables reported on the y-axis of Figure 4 for student i in school block j, Zj indicates the fixed effect of school blocks and ε is an error term.
We then take the difference between each coefficient βn from eqs. (1) and (2) and use bootstrapped standard errors and CIs to compare the sizes of the coefficients from the two modelsFootnote 7 (Efron & Tibshirani, Reference Efron and Tibshirani1993; Davison & Hinkley, Reference Davison and Hinkley1997; Chihara & Hesterberg, Reference Chihara and Hesterberg2008).
The variables in the top right of Figure 4 are those characteristics that distinguish teacher nominees from all other students, but are less likely to distinguish central students from all other students. We might think of these characteristics as those that teachers overweight, compared to the characteristics of central students, when nominating influential students. In this case, network observers are more likely to associate troublemaking and academic success – characteristics that are salient to teachers in their role at the school – with the students they nominate as being influential. Net of other characteristics, teacher nominees have significantly more instances of both major and minor disciplinary sanctions. Additionally, net of other characteristics, the teacher nominees also tend to report reading more books for fun and being part of theater, drama and music groups (see Figure 4). Teacher nominees are also more likely to report that they are Black relative to all other students, suggesting that these network observers also pay particular attention to Black students.
In the bottom left of Figure 4, we see the characteristics that distinguish central students from all other students, but are less likely to distinguish teacher nominees from all other students; these are the characteristics teachers tend to underweight, compared to the characteristics of central students, when nominating influential students. Net of other characteristics, students who report dating someone, take part in sports activities inside and outside of school and are likely to have friends come over are less represented among teacher nominees. Network observers seem to underweight students’ characteristics that are less salient to them. Ceteris paribus, boys and Hispanic students are also less represented among teacher nominees compared to central students.
Discussion
This paper asks whether network observers, defined as individuals who have knowledge about the network but do not belong to the network, can identify influential members in a social network. We use data collected in the context of a large-scale field experiment conducted in 56 New Jersey middle schools to compare the social influence and characteristics of influentials identified by a complete survey of network insiders (central students) and by network observers (teacher nominees).
Central students were identified through complete network survey asking all of the students of each school to nominate the students they usually ‘choose to spend time with’. Because this procedure comes with high logistical costs, it is difficult to scale up interventions using this method, and this led us to consider whether teacher nominations of influential students could constitute one cost-effective alternative to identifying influential students. Because teachers do not have knowledge of the entire student network, we compare the effects of students identified through ‘spend time’ nominations by insiders (students) to those identified through direct nominations for being influential by observers (teachers).
Student nominees and teacher nominees are largely different students: 28% of the teacher nominees are also central students. Teacher nominees are less socially visible, in terms of number of ties within the student network, and less similar to an average student in a school than are central students.
In contrast to the influence of central students as reported in Paluck et al. (Reference Paluck, Shepherd and Aronow2016), teacher nominees have no or negative influence on other network members’ behaviors and perceptions of norms. Specifically, the proportion of teacher nominees in an intervention group has no significant influence on average peer conflict behaviors school-wide or on other students’ probability of wearing an anti-conflict wristband. At the individual level, teacher nominees have significant negative effects on the probability that students in their school talk about how to resolve conflict, perceive norms against conflict and wear an anti-conflict wristband.
Different types of network observers are more likely to nominate students who are also central students. Principals and vice principals are significantly more likely than the average classroom teacher to nominate students who are also central students, whereas special education teachers and school counselors are significantly less likely to do so. These different rates of identifying central students suggest that different types of observers have different levels and types of exposure to the social network, which affects the nature of their nominees. Specifically, these results suggest that interacting frequently with a broad range of students may provide observers with a broader view of the network and increase their overall propensity to observe and nominate central individuals.
Finally, in conversation with literature on biases in social judgment and perception (Tversky & Kahneman, Reference Tversky and Kahneman1973; Ross & Nisbett, Reference Ross and Nisbett1991), our data analyses allow us to speculate about sources of bias that lead to differentiation between teacher nominees and central students. Net of other variables, teacher nominees are more likely to be involved in disciplinary events or to report engagement in academic behaviors such as reading books for fun. In comparison, central students are more likely to be involved in the social scene of the school through playing sports and dating other students. In the context of this study, the differences between teacher nominees and central students suggest that certain student attributes are more readily observable in the context of a teacher's role; put simply, because of teachers’ duties to teach and to discipline, some traits are more salient to them. Other student attributes represent information blind spots for teachers – in their nomination process they undervalue student attributes that are relatively more hidden to them, such as dating or playing sports. Some of these attributes may be unobservable to teachers (e.g., students and parents may not want teachers to be informed about student dating patterns or whether they live in a ‘nice house’). However, providing teachings with less sensitive student information might increase the acuity of their nominations.
Relatedly, teachers’ roles may motivate them to pay selective attention to certain student characteristics – a more active rather than passive account of this biased person perception process. By nominating students who on average engage in more extreme positive and negative behavior that is relevant to school, teachers seem to be using information about student characteristics that are most salient or relevant to teachers, such as reading books or acting out in school.
Characteristics associated with particular social roles may bias perceptions of who is influential through increasing the availability of some network members in memory (Tversky & Kahneman, Reference Tversky and Kahneman1973, Reference Tversky and Kahneman1974). Individuals who stand out to observers in a social scene, as do those who behave in ways that observers are particularly attuned to, are also perceived as more ‘causal’, or influential (Taylor & Fiske, Reference Taylor and Fiske1978). In addition to these role-relevant characteristics, racial and gender identity also make some students more or less salient to teachers. Given the strong evidence regarding how Black and Latino students and boys received disproportionate punishment in schools, this is unsurprising (Welsh & Little, Reference Welsh and Little2018). While the results we present here are particular to the case of teachers and students in schools, future work might explore the issue of how social roles and the characteristics associated with them systematically bias perceptions in other domains of life in which researchers and policy-makers use influential group members to change behavior.
In contrast to research on human judgment concluding that individuals can make predictions about a broad range of clinical, social and personality outcomes based on exposure to ‘thin slices of expressive behavior’ (i.e., brief observations) (Ambady & Rosenthal, Reference Ambady and Rosenthal1992; Naumann et al., Reference Naumann, Vazire, Rentfrow and Gosling2009), our work points to the value of aggregated information from insiders for identifying influentials. Unfortunately, observers’ lack of success at identifying influential members of a network constitutes a major challenge to scaling up network interventions, and researchers and policy-makers continue to require cost-effective methods for identifying influentials. This research points to one approach: developing strategies to improve the accuracy of observers’ judgments of social influence in outside networks.
For instance, different framings of the nomination question may be more able to mitigate role-relevant bias. For example, questions may direct observers’ attention towards those identified by network insiders by getting them to take the perspective of network insiders and using more concrete, behaviorally specific identification prompts. This might be achieved by asking questions such as: ‘According to [network insiders], who are the most observed members of the social network?’ or “Who are the people who network members tend to spend time with?’. These questions would be more in line with the nomination question asked by Paluck et al. (Reference Paluck, Shepherd and Aronow2016) to insiders in order to identify the central students through insiders.
In order to develop a catalogue of strategies for prompting network observers, researchers should further examine how observers perceive social influence in networks in which they do not directly participate. To do so, social scientists and policy-makers should collect qualitative and quantitative data to understand how people think about social influence. This is likely to be highly dependent on the context (e.g., school, workplace), which should lead researchers to theorize on the various sources of observers’ biases in different settings and improve the general effectiveness of future interventions (Gantman et al., Reference Gantman, Gomila, Martinez, Matias, Paluck, Starck, Wu and Yaffe2018).
Social scientists can also develop programs of research and methods aiming at identifying observers who are most likely to identify influential members of a social network. In the present study, lead school administrators, compared to other types of observers (e.g., regular teachers and counselors), were particularly effective. This may suggest that observers whose role gives them a broader knowledge of the network may be most suited to identifying influential network members. The finding that special education teachers as well as counselors were particularly unsuccessful at nominating central students suggests that certain types of observers should be avoided. These may be observers who have narrower knowledge and interactions with the network.
Social scientists might also explore combining methods of identification as a more cost-effective way to find influential community members. For instance, building on the present results, researchers might collect behavioral nominations from a subset of insiders and combine that information with nominations from specific observers (in schools, this might be lead school administrators who are not new to the school) to identify influential individuals. Valente and Pumpuang (Reference Valente and Pumpuang2007) suggest additional methods for combining identification strategies that merit further research. We note that the most efficient strategy for identifying influential individuals may depend on what influential individuals are trying to spread in a community. For example, asking a random sample of insiders is sufficient for identifying central community members who can effectively diffuse information through the network (Banerjee et al., Reference Banerjee, Chandrasekhar, Duflo and Jackson2019).
We would expect our findings to hold in most schools, where institutional features such as clear, hierarchical role differentiation between insiders and observers limits the observers’ amount and type of exposure to insiders’ social interactions and dynamics. Additionally, the role that observers play in school networks makes them more attuned to types of information (e.g., about academic orientation and behavior that violates school rules and behavioral norms) that may be unrelated to cues about insiders’ relative influence among one another. Future research might examine whether our findings apply in cases where there is less hierarchical differentiation between insiders and observers and when the nature of the observers’ role is more closely aligned with the tasks of observation for the purposes of identifying influential members (e.g., between employees of a workplace as insiders and outside consultants as observers; or between residents of a town and researchers designing an intervention). Another important area for research concerns effective ways of identifying influential members when the network does not have such clear boundaries and the network spans different contexts and populations.
An important and ambitious path for future research is to use experiments to compare the actual impact of individuals identified as influential through different methods on other network members’ behavior. Our study is, to the best of our knowledge, the first field experiment of this kind, and its results should be supplemented by other studies conducted in different contexts.


 Open access