

DISCUSSION POINTS
-
• Sustainable transportation by cars may be feasible only if society is willing to accept a lower degree of comfort.
-
• A worldwide tax on kerosene may be something to consider.
-
• For future aviation, liquid hydrogen deserves serious consideration as a potential energy carrier.
Resistances
The key for determining energy use in transportation is resistance. The reason is that resistance—the force which has to be overcome to move at constant speed—is energy per unit distance: 1 N = 1 J/m. In other words, the resistance gives us directly the energy use in terms of the number of J/m or, more conveniently, kJ/km. For cars, buses, trains, and bicycles, we deal with two types of resistance in transportation, viz., rolling resistance F r, and air resistance or aerodynamic drag F d.
The rolling resistance can be written as
 $${F_{\rm{r}}} = {C_{\rm{r}}} \times mg\quad ,$$
with C r the rolling resistance coefficient (sometimes referred to as RRC), m the mass, and g the acceleration of gravity. Since mg is the weight (in newton), it is seen that the rolling resistance is a fraction C r of the weight. The rolling resistance for cars and other vehicles using rubber tires is mainly caused by the fact that the forces related to compression and expansion of rubber are not equal: there is some hysteresis. Note that the value of C r must be of the order of 0.01, since a slope of approximately 1% suffices to get a car rolling. Extensive measurements by the National Research Council of the National Academy of Sciences 2 showed that values of C r vary from 0.007 to 0.014. Most tire models today, when measured new, have RRCs below 0.009. The value of C r is affected by load and inflation pressure. Higher deformation of the tire results in higher rolling resistance.
Note also that this type of resistance is independent of speed.
When considering drag we must realize that we deal with turbulent airflow, which means that the drag is proportional to the air density ρ and to the square of the velocity v (see Bernoulli’s law). It can be written as
 $${F_{\rm{d}}} = {C_{\rm{d}}} \times A \times {1 \over 2}\rho {v^2}\quad ,$$
where A is the frontal area and C d is the drag coefficient, which depends on the streamline. For a completely nonstreamlined object the value of C d is around unity.
Cars
Values of the drag coefficient for some cars are given in Table 1. It is seen that there has been quite some progress in this area over recent years, but there is still room for improvement.
Table 1. Typical values of the aerodynamic drag coefficient C d (source for specified cars brands: https://en.wikipedia.org/wiki/Automobile_drag_coefficient).

Note that drag increases with the square of the velocity. For a ‘model car’ having a mass of 1000 kg, with C r = 0.01, C d = 0.4, and A = 2 m2 the two resistances behave as shown in Fig. 1. It is seen that rolling resistance and drag are equal at about 50 km/h. In other words, for such a car the rolling resistance dominates in residential areas, whereas the drag is by far dominant on the highway. Most contemporary cars have higher mass (i.e., larger rolling resistance) and smaller C d values (i.e., lower drag), such that the two lines cross at higher speed. The total resistance at higher speed may still be equal to the value of the model car in Fig. 1.

Figure 1. The resistance that a car experiences as a function of speed. It increases dramatically at higher speeds, due to the rapidly increasing air resistance or drag (blue curve). The figure corresponds to a car with a mass of 1000 kg, a RRC of C r = 0.01, a drag coefficient C d = 0.4, and a frontal area A = 2 m2 (reprinted with permission from Ref. Reference Hermans3).
It is now easy to calculate the power which the engine must deliver to maintain a certain speed. From Fig. 1 we see that around 100 km/h or 30 m/s the force is about 500 N. Since power is force times speed, we find that the power needed to drive at a constant speed of 100 km/h is around 15 kW. So two important conclusions are the following:
-
(i) A car on the highway uses some 500 kJ/km of mechanical energy and
-
(ii) A car on the highway needs a power of some 15 kW.
When calculating the fuel consumption from the 1st conclusion we must take into account that the efficiency of the internal combustion is poor: only about 20% for gasoline engines and 25% for diesel engines. This means that the number of 500 kJ/km must be multiplied by a factor of 5 or 4, respectively, to find the fuel consumption.
Buses versus cars
Buses use rubber tires just like cars, so the rolling resistance coefficient C r is quite comparable. It turns out that the mass per seat is also roughly the same as for cars. This means that the rolling resistance per seat for buses is about the same as for cars. The energy to accelerate to a certain speed after a stop, which is relevant in city traffic, is also proportional to the mass. So also here the bus and the car have equal scores. This means that in residential areas the energy use of the two are quite comparable. So what is the advantage of riding a bus? The advantage shows up on the highway. If we look at the drag per seat, a bus beats a car by a factor of 2–3, because the larger frontal area of a bus is more than offset by the large number of seats. The conclusion here is that a full bus beats a full car only on the highway, the difference being a factor of 2–3.
Trains
The advantage of trains above buses is primarily the use of steel wheels, which reduces the rolling resistance considerably. This advantage is not as large as one may expect. This is caused by the nonideal contact between the steel wheels and the rail. Remember that the sides of the wheels can experience considerable friction, especially in curves, which enhances the rolling resistance. This effect depends crucially on the quality of the track. Although the mass per seat is somewhat larger than it is for a car, the net effect is that the rolling resistance of a train per seat beats the car by about a factor of 3. The drag per seat is considerably smaller, mainly because the frontal area per seat is much smaller. Here the train beats the car by about a factor of 20.
There are some drawbacks in train transport efficiency. First, its large mass requires much energy to accelerate back to cruising speed after a stop (if we assume no regenerative braking). Secondly, heating in winter time consumes additional electricity (if we assume electric trains). For cars and buses powered by an internal combustion engine, heating is supplied by waste heat from the engine.
The overall result is that the train is more energy-efficient than the average car by a factor of 3–10, depending on the speed and the average distance between stops.
Aircraft
Aircraft have the advantage that they have no rolling resistance. Moreover, the drag is not as large as one may be tempted to think given the high speed. This is, first, because planes have an excellent streamline, so a small value of C d. In addition, the atmospheric pressure at cruising altitude is a factor of 4 lower than at sea level. The result is that a full plane has a fuel efficiency of 30–35 km per liter of fuel per passenger. This is roughly half the efficiency of a full car, which has about 60 km/L per seat.
An interesting point is that long-haul flights are less efficient than intermediate flights, despite the fact that the fuel-consuming take-off and landing are only marginally important for long flights. The reason is that the fuel adds considerably to the total mass of the aircraft for long flights. For a ten-hour flight the fuel used per passenger is around 300 kg. As an example: a Boeing 747-400 has an empty mass of 180,000 kg and a maximum fuel load of 190,000 kg. In other words, a complete refueling of the empty aircraft doubles its mass. Various data on aircraft performance can be found on www.aircraftcompare.com.
Airships
An airship or zeppelin (named after the German Count Ferdinand Graf von Zeppelin) can remain airborne without any use of energy. In addition, it has no rolling resistance, only drag. Even so, its energy efficiency is quite poor once it gets moving at a speed that is comparable to a car on the highway. The reason is its large frontal area per passenger. If we take the dimensions of the Hindenburg, the airship that made quite some history when it tried to land in New Jersey back in 1937, we find a frontal area of 13 m2 per passenger. This is to be compared with roughly 0.5 m2 per person for a car. Since drag is the leading source of energy use at cruising speed, it is obvious that the airship is beyond hope in terms of energy efficiency.
The bicycle
Riding a bike is not only good exercise, it is also very efficient in terms of energy use. This is nicely illustrated in Fig. 2, in which different modes of transportation and the energy consumption of various animals are compared.
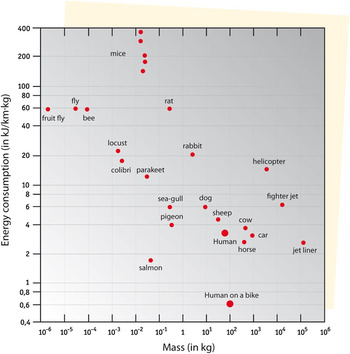
Figure 2. Energy use in terms of kJ per km and per mass, for various modes of transportation including some animals, arranged from light to heavy masses (data from S.S. Wilson, ‘Bicycle Technology’, Scientific American, March 1973, p. 90).
The energy use of a cyclist can be easily estimated by comparing it with climbing the stairs: it uses the same muscles and requires about the same effort as climbing at a pace of one step per second. One finds approximately a power of 100 W. With a speed of 20 km/h this translates into 18 kJ/km. This corresponds nicely with the graph shown in Fig. 3, where the resistance of a cyclist on a common city bike is shown: the value at 20 km/h is approximately 18 N (see also Ref. Reference Wilson4).

Figure 3. The resistance of a cyclist riding a common city bike. It is seen that air resistance (or drag) is dominant above about 15 km/h and that the energy use at 20 km/h is around 18 J/m (reprinted with permission from Ref. Reference Hermans3).
Comparison
When comparing the various modes of transportation we find some interesting results (see Table 2):
Table 2. Energy efficiency in terms of number of passenger-km per liter of fuel, assuming a passenger load factor of 100% and long-distance travel. For electric vehicles, the electricity is assumed to be generated in an oil-fueled power plant, and for the bicycle the energy equivalent of food is expressed in liters of oil.

a Modern planes like the A380 may achieve 35 (Source: Singapore Airlines, 2008).
It is striking that a cruise ship performs so poorly, although it travels at pretty low speed. Part of the reason is the density of water, which causes high drag. But even more important is the fact that cruise ships have an extremely low payload, since most of the mass is taken by ballrooms, swimming pools, shops and the like.
Another conclusion to be drawn from the table is that most other modes of transportation have rather comparable energy efficiencies (except perhaps for the bicycle). One may therefore conclude that the most efficient way to reduce energy use in transportation is to reduce mobility, for example by having small distances between workplace and home. In other words: urban planning provides an important key.
New technologies
When looking beyond the fossil-fuel era we consider mainly alternative energy carriers and alternative energy sources.
Biofuel
This does not seem to be a viable option. First, the efficiency of photosynthesis is only around 0.5% in moderate climates, up to 3% in the most favorable conditions. Second, there is the competition with food supply, at least for the ‘first generation’ biofuels. Third, the CO2 emission is even higher for 1st generation biodiesel than it is for fossil fuels, and hardly lower for bioethanol. 5
Electric vehicles
This route seems to be most promising, but there are still challenges ahead. First, battery performance must be further improved. Presently the energy density of Li-ion batteries is around 0.25 kWh/kg. Reference Crabtree6 Keeping in mind that an average car uses about 15 kWh for 1 h of driving (see “Cars”), it takes about 60 kg of batteries for each hour of driving. Also the price must come down further: it was (in 2014) around 300 USD/kWh for large-scale production of large-format battery packs Reference Nykvist and Nilsson7 and may reach 200 USD/kWh in a few years from now. Reference Ciez and Whitacre8 In addition, charging time is still a problem. Since a standard home power outlet can deliver about 3.5 kW at most if the fuse is to survive, while driving takes about 15 kW, charging from home takes around 4 h for each hour of driving. In addition, the performance of supercapacitors (important whenever high power is involved for rapid charging and discharging during braking and acceleration) must be further improved. Reference Abruna, Kiya and Henderson9
The global-warming advantage of electric cars depends crucially on the electricity generation. If the electricity is generated by a coal-fired plant, for example, the CO2 emission may be larger than it would be for a car powered by gasoline or diesel. This is because the net efficiency of thermal power plants is only around 35% (see 20–25% for gasoline and diesel engines) and coal produces more CO2 than gasoline or oil for the same amount of energy.
Solar-powered transport
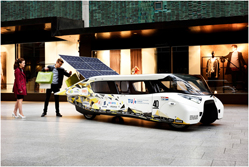
Direct driving using solar power is difficult, even under a clear sky. Since solar irradiance is 1.0 kW/m2 at most, a contemporary car would need 15 m2 of solar panels even with an efficiency of 100% to produce the 15 kW required for driving on the highway. It is clear that heavy compromises are needed to manufacture a solar family car. This challenge was recently taken up by students at Eindhoven University of Technology in the Netherlands. They built a car which can seat 4 persons, has a 1.5 kW electric motor with a 97% efficiency and which can be driven indefinitely under a clear sky at a speed of about 43 km/h. Of course, in practice they also use Li-ion batteries having a capacity of 15 kWh, which enables them to have a range of 1000 km on a sunny day in the Netherlands, and about 650 km at night. The top speed is 125 km/h. But this comes at a price. The car is only 1.12 m high and comfort is marginal (see Fig. 4).

Figure 4. Solar family car ‘Stella Lux’, equipped with 5.8 m2 of solar cells and a 15 kWh battery pack (Photo copyright Bart van Overbeeke; Courtesy: Solar Team Eindhoven).
It may be clear that solar family cars may be feasible only if society is willing to sacrifice some comfort.
Using solar energy to power commercial airplanes seems out of the question. As an example, a Boeing 747 has an engine power of approximately 110 MW. Its wing surface is 550 m2 which, for the sake of the argument, we assume to be completely covered by solar panels. Given a maximum solar irradiance of 1 kW/m2 and a solar panel efficiency of 20%, one arrives at a solar power of 110 kW. This is smaller by 3 orders of magnitude than the engine power mentioned above. The conclusion is that solar aviation may become possible only with revolutionary changes in the aeroplane concept.
Hydrogen-fueled transport
Hydrogen can provide convenient energy storage in the post-fossil-fuel era. It can be produced from electricity by electrolysis or directly from sunlight by some green algae and cyanobacteria. Reference Kruse, Rupprecht, Bader, Thomas-Hall, Schenk, Finazzi and Hankamer10,Reference Purchase and de Groot11 For use in transportation it is less convenient, because of its gaseous state at ordinary temperatures, and its low boiling point (see Table 3).
Table 3. Properties of molecular hydrogen (H2).

a The ‘upper’ value includes the heat of condensation of the water vapor; the ‘lower’ value does not.
Hydrogen can be used to fuel a combustion engine, but also in a fuel cell, which produces electricity directly with an efficiency of up to 60%.
There are three methods to store hydrogen for mobile use:
-
(i) As a gas at high pressure. This option is being used, with pressures of up to 700 bar. Note, however, that the density at such high pressure is not simply proportional to the pressure. Since repulsive forces between the molecules dominate at ambient temperature, the compressibility is poor. As a result the density at 700 bar is only 2/3 of what one would naively calculate. This option requires strong containers. To store the energy equivalent of 50 L of gasoline, storage cylinders have a total mass of some 300–400 kg. The fuel itself has a mass of less than 10 kg in this case. For use in cars, buses, and trucks this seems to be the most attractive option.
-
(ii) Absorbed into some solid. Some metals are capable of absorbing large amounts of hydrogen, even to the extent that the amount of hydrogen per unit volume is larger than in the liquid phase. However, the flip side of the medal is that the ‘tank’ is very heavy compared to the weight of the hydrogen inside. This is obvious because hydrogen is the lightest of the elements and metals tend to be heavy. An example of a metal-hydrogen compound (‘metal hydride’) is LaNi5H6, where hydrogen is stored in an alloy of lanthanum and nickel, both heavy metals. If we look up the masses of La and Ni, we find that the mass ratio of hydrogen to metal is 6–432. But the good news is that 6 kg of hydrogen enables us to travel some 600 km.
-
(iii) As a liquid. As seen in Table 3, hydrogen only turns into a liquid at −253 °C. This makes handling, loading, and transport cumbersome. Moreover, the tank must be superbly insulated to prevent rapid evaporation. Even super-insulation means a ‘boil-off’ of 1–2% per day. These two complications make liquid hydrogen not very suitable for use in car traffic.
For air transport, however, using liquid hydrogen has some specific advantages. First, handling of liquid hydrogen would be done by professionals only. This reduces safety issues to the level of the risk involved in handling kerosene. Second, liquid hydrogen itself is very light, which is an important advantage for air travel. Remember that, for long-haul flights, the weight of the kerosene is equal to the weight of the empty plane (see “Aircraft”). Third, boil-off is much less of a problem, not only because airplanes are airborne only for a limited amount of time, but also because the low outside temperature at cruising altitude reduces the temperature difference with the liquid. One must conclude that using liquid hydrogen as a potential energy carrier for air transport deserves serious consideration.
Given the severe weight limitations for fuel in aircraft, liquid hydrogen may be a viable alternative in the long run. However, nothing beats the convenience and the economy of kerosene. It seems wise, therefore, to extend the availability of oil products as long as possible. In that context it is a defect that kerosene is so irrationally cheap, which triggers much unnecessary air travel. A worldwide tax on kerosene—if at all politically possible—should be something to pursue.
To conclude: achieving sustainable transportation systems in the post-fossil-fuel era is indeed a great challenge, in view of the unique convenience of oil-based liquid fuels. For road transport, batteries assisted by supercapacitors can provide a good alternative. Hydrogen, probably in compressed form, may also be an option, especially in combination with fuel cells. For aviation, liquid hydrogen may provide an excellent option for a number of reasons.
Direct use of solar power is within reach for cars, provided that customers are willing to accept a lower degree of comfort. By contrast, for aviation purposes the direct solar power option seems to be beyond hope.


