


INTRODUCTION
Questions about descriptive representation have anchored normative debates in modern democratic theory and animated empirical studies of how racial and ethnic groups can translate political interests into political action. Do minority group members want to be represented by those who share their race or ethnicity?Footnote 1 Does having such candidates on the ballot make them more likely to engage in politics? Does achieving descriptive representation shape the legislative process and its outputs, and if so, how?
Research on these questions has mainly examined African Americans and, to a lesser degree, Latinos in the United States. Some have looked at Black and Asian representation in the United Kingdom (Nixon Reference Nixon and Saggar1998; Saalfeld and Bischoff Reference Saalfeld and Bischoff2013; Sobolewska, McKee, and Campbell Reference Sobolewska, McKee and Campbell2018) and Muslims and members of Scheduled Castes and Scheduled Tribes in India (Ansari Reference Ansari2006; Jaffrelot Reference Jaffrelot2003; McMillan Reference McMillan2005). On the other hand, we know relatively little about descriptive representation for Asian Americans.Footnote 2 In this paper, we ask where Asian American candidates win and why. We approach this question through the prism of two distinct phenomena: ingroup support and crossover support. The former refers to support for Asian American candidates from Asian American voters—either from within their own ethnic origin group or “panethnic” support from other ethnic groups in the Asian American community—whereas the latter to votes gained from non-Asian American voters. From these basic notions, we advance a number of theoretical propositions about where Asian Americans win at the aggregate (i.e., district) level, and about the psychological roots of support for Asian American candidates in the minds of individual voters. To test them, we bring to bear a new, large aggregate-level dataset of election outcomes matched with demographic data, pre-existing surveys on Asian American political attitudes, and a set of original survey experiments administered to large samples of Asian, white, Black, and Latino voters.
The following emerges in the aggregate: (1) Asian American candidates win with a lower proportion of Asian Americans in their district than other U.S. minority groups win with the same share of their group; (2) the more racially and ethnically diverse a constituency,Footnote 3 the more Asian American candidates win; and (3) ethnic diversity within the Asian American community has no impact on electoral success by Asian American candidates. We find that crossover support for Asian American candidates comes from the absence of anti-Asian discrimination from white, Black, and Latino voters and, indeed, these groups’ slight favorability for Asian over white candidates. With respect to ingroup voting, Asian American candidates benefit from loyalty tied to ethnic origin while simultaneously appealing in panethnic fashion to Asian American voters of other ethnic origins.
Taken together, these results consistently support theories suggesting that multiracialFootnote 4 environments provide more coalition building opportunities for members of small minority groups like Asian Americans. At the same time, they negate competing ideas that Asian American candidates especially benefit from whites’ identifying and supporting them as the “model minority.” Moreover, while Asian Americans may identify more strongly by ethnic origin rather than with “Asian” or “Asian American” as a broader category (Lien et al. Reference Lien, Le, Takeda, Sadhwani and Aoki2021; Lien, Conway, and Wong Reference Lien, Conway and Wong2003; Reference Lien, Conway and Wong2004; López, Ruiz, and Patten Reference López, Ruiz and Patten2017), the latter is sufficiently strong to serve as a basis of political support. More broadly, these findings provide a striking example of how this fast-growing group, and one that is highly ethnically diverse, can gain descriptive representation notwithstanding major challenges.
BACKGROUND AND EXPECTATIONS
A cornerstone of modern democratic theory is descriptive representation, or the notion that minority group interests are furthered with the election of group members to political office (Dovi Reference Dovi2002; Mansbridge Reference Mansbridge1999; Pitkin Reference Pitkin1967). The assumption is that peoples’ interests are more likely to be articulated by representatives who share common experiences, history, and social networks. Racial redistricting in the United States is intended to make it possible for minority groups, especially Black and Latino voters, to elect their candidates of choice. This, in turn, has substantive payoffs: Black and Latino representatives are more likely to reflect the community’s preferences in roll-call votes (Casellas Reference Casellas2011; Lublin Reference Lublin1999; Whitby Reference Whitby1997). By the same token, Black representatives are more likely to serve on committees, participate in oversight hearings, sponsor legislation addressing Black interests, and use liberal policy frames when speaking on these issues (Canon Reference Canon1999; Gamble Reference Gamble2011; Haynie Reference Haynie2001; Minta Reference Minta2011).
Descriptive representation finds widespread support among these communities (Barreto Reference Barreto2010; Manzano and Sanchez Reference Manzano and Sanchez2010; Stokes-Brown Reference Stokes-Brown2006; Tate Reference Tate2003; Reference Tate2004). Their participation and support for the political system tends to increase (Banducci, Donovan, and Karp Reference Banducci, Donovan and Karp2004; Barreto, Segura, and Woods Reference Barreto, Segura and Woods2004; Bobo and Gilliam Reference Bobo and Gilliam1990; Gay Reference Gay2002; Griffin and Keane Reference Griffin and Keane2006; Rocha et al. Reference Rocha, Tolbert, Bowen and Clark2010; Sanchez and Morin Reference Sanchez and Morin2011; Tate Reference Tate2003; Reference Tate2004). Asian, Black, and Latino representatives can also mobilize by activating salient group ties (Barreto Reference Barreto2010; Junn and Masuoka Reference Junn and Masuoka2008; Lai Reference Lai2011; McConnaughy et al. Reference McConnaughy, White, Leal and Casellas2010; Min Reference Min2014). Perhaps election results express this preference most clearly, as Black (and Latino) candidates have won the lion’s share of Black (and Latino) majority districts (Davidson and Grofman Reference Davidson and Grofman1994; Lublin et al. Reference Lublin, Handley, Brunell and Grofman2020).
Restrictive immigration laws kept the Asian American population in check for almost two centuries. Since passage of the Immigration and Nationalities Act of 1965, however, their population has grown sharply. Today, more than 20 million people currently living in the United States trace their origin to a diverse set of Asian countries (López, Ruiz, and Patten Reference López, Ruiz and Patten2017). The concept of an Asian American identity, as opposed to identities rooted in individual Asian ethnic origin groups, only emerged alongside the wave of immigration that began in the 1960s (Cho and Lad Reference Cho and Lad2004; Okamoto Reference Okamoto2014).
Whether or not Asian Americans support or benefit from descriptive representation is less well known. Reviews of extant surveys argue that Asians’ feeling and acting upon “linked fate” is highly context-dependent (Lien Reference Lien2001; Lien, Conway, and Wong Reference Lien, Conway and Wong2004). Another recent study argued Asian Americans appear to think about descriptive representation in much the same way as Latino respondents: favorable in principle, and increasingly as a function of strong ethnic identification, ethnic linked fate, and lower levels of “acculturation” (Schildkraut Reference Schildkraut2013).
Whether (and where) Asian Americans achieve descriptive representation, notwithstanding their preferences, is another matter. Due to the comparative paucity of Asian American elected officials, most of what we know comes from in-depth case studies of local and statewide races (Cho Reference Cho2001; Collet Reference Collet2008a; Reference Collet2008b; Lai and Geron Reference Lai and Geron2006; Ông and Mayer Reference Ông and Mayer2008; Tam Reference Tam1995; but see Cho Reference Cho2002; Hardy-Fanta et al. Reference Hardy-Fanta, Lien, Pinderhughes and Sierra2016; Lai et al. Reference Lai, Cho, Kim and Takeda2001; Min Reference Min2014; Sadhwani Reference Sadhwani2022).Footnote 5 These studies engage, in a localized way, questions of whether Asians appear to be polarized with respect to whites, whether they vote as a bloc to support candidates of their own ethnic origin, and whether they support Asian American candidates regardless of their ethnicity as means of advancing the collective political interests of that larger category (Espiritu Reference Espiritu1992; Okamoto Reference Okamoto2014). Here, our goal is to draw an unprecedentedly wide-ranging picture of Asian American candidates’ political success, under the aegis of two broad themes: Ingroup Support and Crossover Support.
Ingroup Support
A bedrock expectation is that Asian American candidates will find political success where Asian American voters are more numerous (Espiritu Reference Espiritu1992; Hardy-Fanta et al. Reference Hardy-Fanta, Lien, Pinderhughes and Sierra2006; Lai and Geron Reference Lai and Geron2006; Lien Reference Lien2015; Sadhwani Reference Sadhwani2022). Recent empirical research on statewide races in California sustains the idea that support from Asian American voters matters, but also that the relationship is highly contextual (Sadhwani Reference Sadhwani2022). One meaningful theoretical distinction we can draw is between group-centric and non-group-centric motives. By “group-centric,” we mean that the central motive underpinning the willingness to vote for an Asian candidate is tied to perceived group interest and group hierarchy (Masuoka and Junn Reference Masuoka and Junn2013). In the present example, Asian American voters want to vote for Asian American candidates because the former have an intrinsic preference for the latter. If so, we would expect Asian American candidates to do well in districts with proportionately more Asian American voters. At the individual level, we would expect to find a preference (among Asian Americans) for Asian American candidates, holding constant issues of policy and competence.
Ingroup support for Asian American candidates may be subdivided by affinity with ethnic origin group versus panethnic identification with Asian Americans as a broader social category (Collet Reference Collet2008a; Reference Collet2008b).Footnote 6 We know quite a bit about the social and psychological precursors of identity choice among Asian Americans (e.g., Lien, Conway, and Wong Reference Lien, Conway and Wong2003; Reference Lien, Conway and Wong2004). Yet for all that, the link between these identities and voting is not well understood. Past studies find instances of ingroup support deriving from both sources in local and statewide elections, but we find relatively little guidance about which factor results in Asian American candidate victories more and when. Analyzing survey data, Min (Reference Min2014) observes that high levels of panethnic solidarity depress Asian American voter registration and turnout yet also stimulate higher rates of participation in political activities other than voting; on the other hand, Wong et al. (Reference Wong, Ramakrishnan, Lee and Junn2011) find minimal differences in the rates that panethnic and ethnic origin identifiers vote and participate in forms of political activism besides voting. Finally, Sadhwani (Reference Sadhwani2020) finds that Asian American candidates attract higher panethnic turnout, but that the effect on co-ethnics varies.
For our purposes, we might expect Asian American candidates’ ingroup support to be rooted primarily among voters of their own ethnic origin. Surveys show that Asian Americans overwhelmingly identify with their ethnic origin rather than as Asian American (Lien, Conway, and Wong Reference Lien, Conway and Wong2003; López, Ruiz, and Patten Reference López, Ruiz and Patten2017). Furthermore, a relatively homogenous ethnic origin group should provide more cohesion, as well as a tighter network for organizational and financial support. Taken together, these considerations drive the ethnic-origin hypothesis (H1-EOH). At the aggregate level, it implies that Asian American candidates will do better in districts where the Asian American community is largely made up of a single ethnic group. At the individual level, H1-EOH suggests that Asian American voters will, when offered the choice, prefer common-origin Asian American candidates over those of other ethnic origins.
On the other hand, panethnic Asian American identity may drive candidate support, at least in the contemporary era, for a few reasons: first, the Asian American electorate (vs. the population) skews younger and second- or third-generation immigrant, and as such are more likely to opt for a panethnic Asian American identity than their ethnic origin group (Pew Research Center 2013; Sadhwani Reference Sadhwani2022; Tam Reference Tam1995; Wong et al. Reference Wong, Ramakrishnan, Lee and Junn2011). Second, Asian American community financial networks are national rather than local (Cho Reference Cho2003; Cho and Lad Reference Cho and Lad2004), so candidate fundraising is not necessarily driven by co-ethnic supporters within the electoral constituency. Finally, ethnic (and panethnic) voting is always a matter of perspective (Okamoto Reference Okamoto2014). While Asian American voters might prefer someone of their own ethnic origin to another Asian American ethnic group head-to-head, they may still favor the latter over a non-Asian American candidate. For Asian American voters, this is especially likely to matter given their relatively small numbers and very high ethnic diversity. Taken together, these considerations underpin the panethnic hypothesis (H2-PEH). At the aggregate level, the H2-PEH hypothesis would be a better fit than the H1-EOH if Asian American candidates did just as well as (or better) in districts where the Asian American population was diverse rather than monolithic. At the individual level, H2-PEH suggests—again, contra H1-EOH—that support for candidates of other Asian origins should be just as strong as it is for candidates of one’s own Asian origin, and that support for both should be higher than support for candidates of other minority groups.
It may be that Asian American ingroup preferences are not especially group centric in the way defined here, if (for example) their motives are not intrinsically tied to conceptions of group identity and interest, but rather reflect informational assumptions about competence or the kinds of policies candidates of various ethnic groups are likely to support. The non-group centric hypothesis (H3-NGC) has two key individual-level implications: First, we would find comparable levels of ethnic and panethnic support, and neither especially stronger than support for white candidates. Second, we would find that, when offered the choice between purely descriptive ethnic representation and substantive representation, the latter wins out. Of course, these do not have to be mutually exclusive.
Crossover Support
Because Asian American voters almost never form a majority, that they succeed politically at all suggests that they must generate crossover appeal, that is, electoral support from other minority groups (e.g., Espiritu Reference Espiritu1992; Hardy-Fanta et al. Reference Hardy-Fanta, Lien, Pinderhughes and Sierra2006; Lien Reference Lien2015; Sriram and Grindlife Reference Sriram and Grindlife2017; Takeda Reference Takeda and Menifield2001). A useful and natural benchmark in assessing this is how likely an Asian American official is to hold a district for a given Asian share of the population relative to the share held by members of other minority groups. In other words, do Asian Americans succeed disproportionately—versus America’s other major racial and ethnic groups—in generating crossover support? There are reasons to think that they might. In general, the literature has emphasized Asian American candidates’ crossover appeal to non-Asian voters in winning both mostly white and more multiracial districts (Lien et al. Reference Lien, Pinderhughes, Hardy-Fanta and Sierra2007). Some have described the crossover appeal of Asian American candidates as stemming from their ability to “toggle” between ethnic and panethnic appeals (Collet Reference Collet2008a), or, on the other hand, to adopt a “deracialized” strategy (Franklin Reference Franklin and Gillespie2010; Gillespie Reference Gillespie and Gillespie2010; Reference Gillespie2012; King-Meadows Reference King-Meadows and Gillespie2010; Lewis Reference Lewis and Gillespie2010; Sriram and Grindlife Reference Sriram and Grindlife2017; Yon Reference Yon and Gillespie2010).
Yet we have little systematic knowledge of where and how crossover helps Asian American candidates win at the district level, or the psychological foundations of their crossover appeal. We return, as before, to the theoretical distinction between group-centric and non-group-centric motives. For a white voter, a group-centric crossover vote for an Asian candidate would occur if Asians are perceived as less ethnically “threatening” to whites than candidates of other minority groups. This is the model minority hypothesis (H4-MMH) (see, e.g., Visalvanich Reference Visalvanich2017a; Reference Visalvanich2017b).Footnote 7 Empirically, at the aggregate level, we would expect, if this hypothesis is valid, that Asian American candidates should do better in districts with white majorities. At the individual level, evidence for H4-MMH would consist of white voters preferring Asian candidates to Black or Hispanic candidates, all else equal.
Other ethnic or racial minority voters might also have group-centric reasons to crossover to Asian American candidates.Footnote 8 It is plausible, for instance, that the crossover appeal of Asian American candidates to Black and Latino voters lies in shared experience as minority group members in America’s racial hierarchy (Hardy-Fanta et al. Reference Hardy-Fanta, Lien, Pinderhughes and Sierra2016; Masuoka and Junn Reference Masuoka and Junn2013; Phillips Reference Phillips2021). This is the shared minority status hypothesis (H5-SMSH). Another possibility is that group members would prefer one of their own, but rate Asian Americans more highly than they rate all other competing groups. This is the next best choice hypothesis (H6-NBCH). Both H5-SMSH and H6-NBCH suggest that—contra H4-MMH—at the district level, Asian American candidates will do better in multiracial districts than in mostly white ones. If they have similar aggregate implications, however, the two minority crossover hypotheses have different implications at the individual level: if other minority voters pick Asian American candidates at comparable rates to themselves, but prefer any minority candidate to white candidates, this would be consistent with H5-SMSH. On the other hand, if other minority voters rate Asian American candidates less highly than themselves, but more highly than all other groups, this would support H6-NBCH.
The previous hypotheses are all premised on crossover support for Asian American candidates as a function of people voting their group interests. But crossover appeal may lie less in notions of racial or ethnic competition and threat, and more in judgments of competence or substantive similarity on issue preferences. That is, group preferences are not intrinsically tied to conceptions of group identity and interest, but rather reflect informational assumptions about competence or the kinds of policies candidates of various ethnic groups are likely to support. Indeed, the variant of H4-MMH presented by Visalvanich (Reference Visalvanich2017a; Reference Visalvanich2017b) is primarily of this character rather than racial per se: in short, whites’ preferences are tied to their stereotypes about Asian competence as held against negative stereotypes of members of other minority groups. This echoes a well-established understanding in the literature that Asian American political preferences are more or less in line with whites on many key issues (Cho and Cain Reference Cho, Cain and Chang2001; Uhlaner, Cain, and Kiewet Reference Uhlaner, Cain and Kiewet1989). This lack of polarization with whites implies that, overall, Asian American candidates should succeed at winning office disproportionately versus candidates of other minority groups. This argument also, in principle, applies to preferences of other minority voters if they view Asian Americans as (on average) holding similar ideological and political interests. Together, we label these motivations Non-Group-Centric Crossover (H7-NGCC). Empirically, this pattern would be consistent with a finding that, in the aggregate level (i.e., district level), Asian American candidates do better in districts with white majorities (versus multiracial ones). At the individual level, however, we would find—contra the group-centric hypotheses raised above—the absence of strong group differences, once we have controlled for the informational roots of whites’ putative preference for Asian American candidates—assessments of competence and issue preferences.
DATA AND APPROACH
Our empirical approach triangulates based on comprehensive, aggregate-level data and national opinion surveys that extensively overrepresent minority groups. For the former, we identified Asian Americans elected in regular state legislative elections held for both chambers between 2011 and 2020 for 33 states: 21 with the highest Asian American populations along with 12 more with high Black or Latino populations to facilitate comparisons between groups.Footnote 9 Data were similarly collected on Asian Americans elected to the two federal houses from 2012 to 2020. We also gathered information on the ethnic origin of Asian American officials. These data were obtained from a variety of sources, including the National Asian Pacific American Political Almanac (Nakanishi and Lai Reference Nakanishi and LaiN.d.), the Asian Pacific American Institute for Congressional Studies, various Asian American legislative caucuses, and examination of photos and biographies on legislative websites.Footnote 10
We matched data on legislator race and ethnicity with district demographic data from the American Community Survey (ACS) conducted by the U.S. Census Bureau. The ACS is preferable to the decennial census as this annual survey better tracks changes in the quickly evolving Asian American population. While most states held elections under the same district boundaries across the decade, some changed their boundaries mid-decade. Generally, the ACS provided data for both old and new boundaries, but observations were dropped when data were unavailable.Footnote 11
For individual-level evidence, we turn to two public opinion surveys. The first is the 2016 pre-election round of the National Asian American Survey, or NAAS (Ramakrishnan et al. Reference Ramakrishnan, Jennifer, Taeku and Janelle2016), which interviewed a large, nationally representative sample of Asian American adults (n = 2,787), as well as sizable samples of white (n = 501), Black (n = 520), and Hispanic respondents (n = 514). The second is an online survey we conducted in September 2021 targeting a nationally representative sample of Asian American adults from the six largest ethnic origin groups in the United States (Chinese, Indian, Filipino, Japanese, Korean, and Vietnamese, total n = 1,000), as well as comparison national samples of whites (n = 502), Blacks (n = 501), and Latinos (n = 500).Footnote 12
These two sources of evidence complement each other. The aggregate data provide a thorough picture of where Asian American candidates win seats, and how this relates back to district demography. The limitations are that it is: (a) purely observational in nature and, thus, limits our ability to make strong causal inferences; (b) relatively ill-suited to getting at what are, fundamentally, psychological motives without making strong ecological assumptions tying these to district-level characteristics; and (c) by necessity focused on election winners versus election candidates or campaigns, meaning that we are unable to see those who prevailed ran against, and what kind of campaign it took to get them over the finish line. By contrast, the survey evidence sacrifices the “big picture,” but it addresses the weaknesses of the aggregate data by: (a) implementing experimental strategies that allow for stronger causal identification; (b) focusing explicitly on individual-level analysis of motives; and (c) focusing, as we describe further below, on respondents’ evaluations of prospective candidates rather than simply observing election winners, and thus not being vulnerable to the same censoring problems of the aggregate data.
EXPLORING THE PREVALENCE OF ASIAN AMERICAN LEGISLATORS
Figure 1 shows the total number of Asian American state and federal legislators broken down by party from 2011 to 2020.Footnote 13 The number of state representatives increased from 70, or 2.2%, in 2012 to 114, or 3.2%, in 2020. Similarly, the share of state senators rose from 2.2% to 3.4% (29–45). Asian Americans, however, comprised 7.4% of the Asian population in these 33 states.Footnote 14 The only Asian majority state, Hawaii, accounts for a disproportionate, albeit declining, share of Asian American state legislators. Over the decade, the Hawaiian share of Asian American legislators declined from 54% to 32% between 2012 and 2020.

Figure 1. Asian American Legislators by Election Year and Party
Note: State legislators include only the 33 states as described in the text. Numbers based on election results and do not include appointments or special elections. Source: Data gathered by authors.
Table 1. Random Effects Logistic Regression Models of the Election of Asian American State Legislators

Note: VAP is the voting-age population. The dependent variable is Asian American winner with Asian American legislators coded as 1 and others as 0. Asian American winners include legislators with multiple racial origins, but their exclusion does not alter the substantive results. The model includes both state house and state senate elections for the states outlined in the text. Our estimator is multilevel logistic regression with random effects by district to address error clustering. We estimated all specifications with and without year fixed effects to account for the possibility that time trends may confound any results. Since all results are consistent regardless, we present the version without year fixed effects. Source: Data on the percentage of Asians from the American Community Survey. Data on legislator race gathered by author. See the text for more detail.
Outside Hawaii, there is a great deal of variation in Asian American success across states. California, the state with the second highest Asian population at 17.1%, now has the most Asian American state legislators—14 or 11.7%. But six states—Arkansas, Delaware, Louisiana, Mississippi, Rhode Island, and South Carolina—elected no Asian American state legislators over the entire decade. Meanwhile, 11 states where Asians comprise under 5% of the population elected at least one Asian American state legislator.Footnote 15 Just 4.9% Asian American, Georgia elected two senators and four representatives in 2020.
Asian American state legislators win overwhelmingly (almost 90% of the time) as Democrats. Eleven of the 24 states that elected at least one Asian American legislator—Alaska, Illinois, Maryland, Michigan, Minnesota, New Mexico, New York, North Carolina, Oregon, Pennsylvania, and Washington—did not elect any Asian American Republicans. Some states are exceptions to this pattern. The single Asian American legislators who won in Colorado, Florida, and Tennessee were all Republicans. In heavily Democratic California, Republicans leapt from 0% to 29% of Asian American state legislators over the decade.
Asian American representation in the U.S. House rose from 2.0% to 3.4% (9–15 members). The number of Asian American U.S. Senators tripled from one to three in 2016 but declined to two after Kamala Harris became Vice President. Until two Republican representatives won in 2020, all had been Democrats.Footnote 16
The extent to which Asian Americans have achieved parity in descriptive representation—that is, a parity ratio (seats over population) of 1—depends upon the population measure. We rely on the proportion Asian alone or in combination with another race in the population.Footnote 17 Figure 2 shows parity ratios in the wake of the 2020 elections.Footnote 18
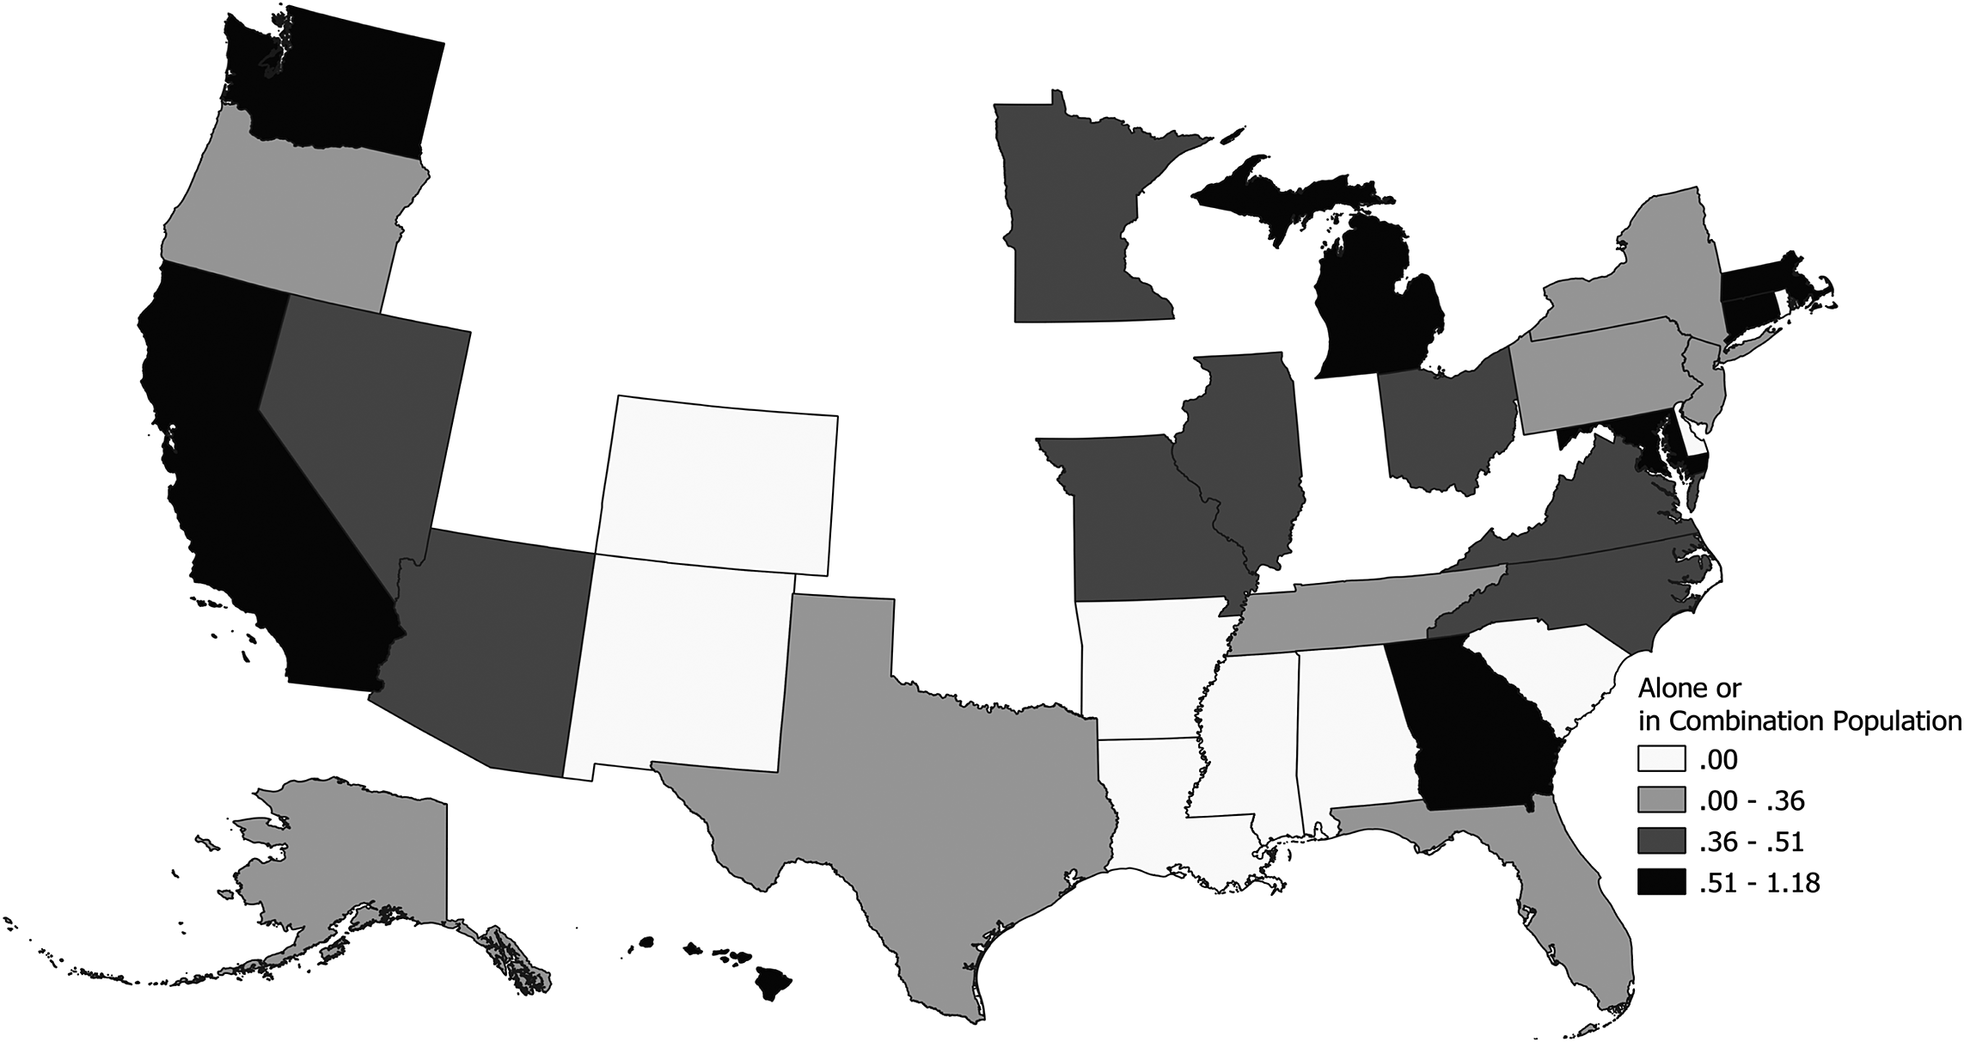
Figure 2. Ratio of Asian American State Legislators to Asian Population after the 2020 Elections, 33 States
Note: Ratio equals the share of Asians in the state legislature divided by the share of Asians alone or in combination of the population. Includes the 33 states as described in the text. Excluded states are not outlined. Source: Data on legislator race gathered by authors. Data on Asian alone and combination population from the American Community Survey. See Supplementary Table 3 for the descriptive data used to create this map.
Hawaii is the only state in which Asian Americans were continuously overrepresented, holding an average of 21% more seats than expected based on population during the 2010s. This high level of electoral success partly reflects that Asian Americans, especially Japanese Americans, are disproportionately active within the state’s Democratic Party, which wins an overwhelming share of elections (Coffman Reference Coffman2003). Moreover, the winner-take-all electoral system usually advantages majority groups like Asian Americans in Hawaii.
Elsewhere, the picture was more mixed. Asian Americans did not achieve parity based on population in both houses in any other state. Only the Connecticut, North Carolina, and Ohio Senates reached parity in 2020. Ten state houses (Arizona, California, Illinois, Maryland, Massachusetts, Michigan, Minnesota, Nevada, Oregon, and Washington) and five state senates (Alaska, Georgia, Maryland, Michigan, and Washington) were above one-half of parity at the decade’s end.
In the U.S. Congress, Asian Americans have narrowed the gap but still fall well short of parity. Their share there was just 35% of the total population in 2012 and 51% by 2020. At 17% of parity, the share of Asian American senators was even lower than that expected based on total population after the 2012 elections. That rose to 44% in 2018 before Kamala Harris left the Senate to become Vice President.
Figure 3 presents the ethnic origin of Asian American state legislators over the 2010s.Footnote 19 Eight legislators with origins in more than one ethnic group are counted twice. Though composing 6.4% of Asians, Japanese Americans led the state legislative numbers throughout the decade due to their strength in Hawaiian politics. By 2020, however, their numbers dropped overall by two among state legislators and from five to three among federal legislators. Always heavily Democratic, only one Republican Japanese American state legislator remained after the 2018 elections.

Figure 3. Asian American State Legislators by Ethnic Origin and Year
Note: Includes only the 33 states as described in the text. Source: Data gathered by authors.
Chinese Americans, who comprise the largest share of Asians at 23.2%, consistently had the second highest numbers, and do (relatively) well in California, Hawaii, Illinois, and Massachusetts. Unlike Japanese Americans, more serve as Republicans and the GOP share remained stable at 19% as the number of Chinese American legislators grew from 26 to 37 over the decade. The number of federal legislators rose from 3 to 4, including the election of Illinois Sen. Tammy Duckworth in 2016.
Indians now form 18.8% of Asians and the number of Indian state legislators more than quadrupled from 6 to 27 during the last decade. They are not concentrated in any state, with three apiece serving in Michigan, North Carolina, and Washington and four in New York after the 2020 elections. As their numbers shot up, the Republican share fell from 33% to 11%. Four Indian Americans now serve in the U.S. House. Sen. Kamala Harris was the first Indian American ever to win election to the U.S. Senate in 2016.
Other ethnic origin groups had lower levels of representation. Filipino Americans are 18.1% of the Asian population. During the 2010s, the number of Filipino American state legislators rose from 14 to 18 with the number of Republicans holding steady at 2. Like Japanese American legislators, most win in Hawaii. After the 2020 elections, there are no U.S. senators but one U.S. House member with Filipino origins, a decline of one from 2018.
Only 8.2% of the Asian population, the number of Korean American state legislators increased from 11 to 16 over the decade. Two states, Hawaii and Maryland, elected more than one Korean state representative. Vietnamese Americans, who form 9.4% of the Asian population, saw a steep increase in state legislators, rising from 1 to 10. Around one-fifth of Koreans and Vietnamese sit as Republicans, but the numbers are small. In 2016, Florida Rep. Stephanie Murphy was the second Vietnamese American, and first Democrat, to win election to the U.S. House. Similarly, in 2018, New Jersey Rep. Andy Kim became the second Korean American, and first Democrat, to serve in that body. No Korean or Vietnamese Americans have ever won a U.S. Senate seat. Hmong, who form 1.4% of the Asian population, were the only other ethnic group to elect three state legislators simultaneously. All are Minnesota Democrats with five serving currently in the House and one in the Senate.Footnote 20
Asian Americans overwhelmingly win as Democrats with the number of Democratic state legislators increasing from 87 to 142 between 2011 and 2020. Meanwhile, the number of Republicans rose from 12 to 17 and their share of all legislators fell from 12.1% to 10.7%. All the Asian American federal legislators during this period were Democrats until two Republicans, Reps. Young Kim and Michelle Steel, won election in 2020.
EXPLAINING ASIAN AMERICAN POLITICAL SUCCESS: INGROUP SUPPORT
Aggregate-Level Evidence
Figure 4 shows the share of Asian Americans elected to state legislatures after the 2020 elections by the share of Asian alone and combination population for Hawaii and the 32 states in the dataset besides Hawaii.Footnote 21 In support of the bedrock idea that there is strength in numbers, Asian American legislators are more likely to hold districts as the Asian population share increases. The sole exception—the dip in 50%–60% range for the 32 states—reflects the small number of cases where one additional Asian American candidate success would result in the data fitting the general pattern. Asian American candidates win below their share of the population in state legislative districts roughly until reaching the 30%–40% range for the Asian alone or in combination population.Footnote 22
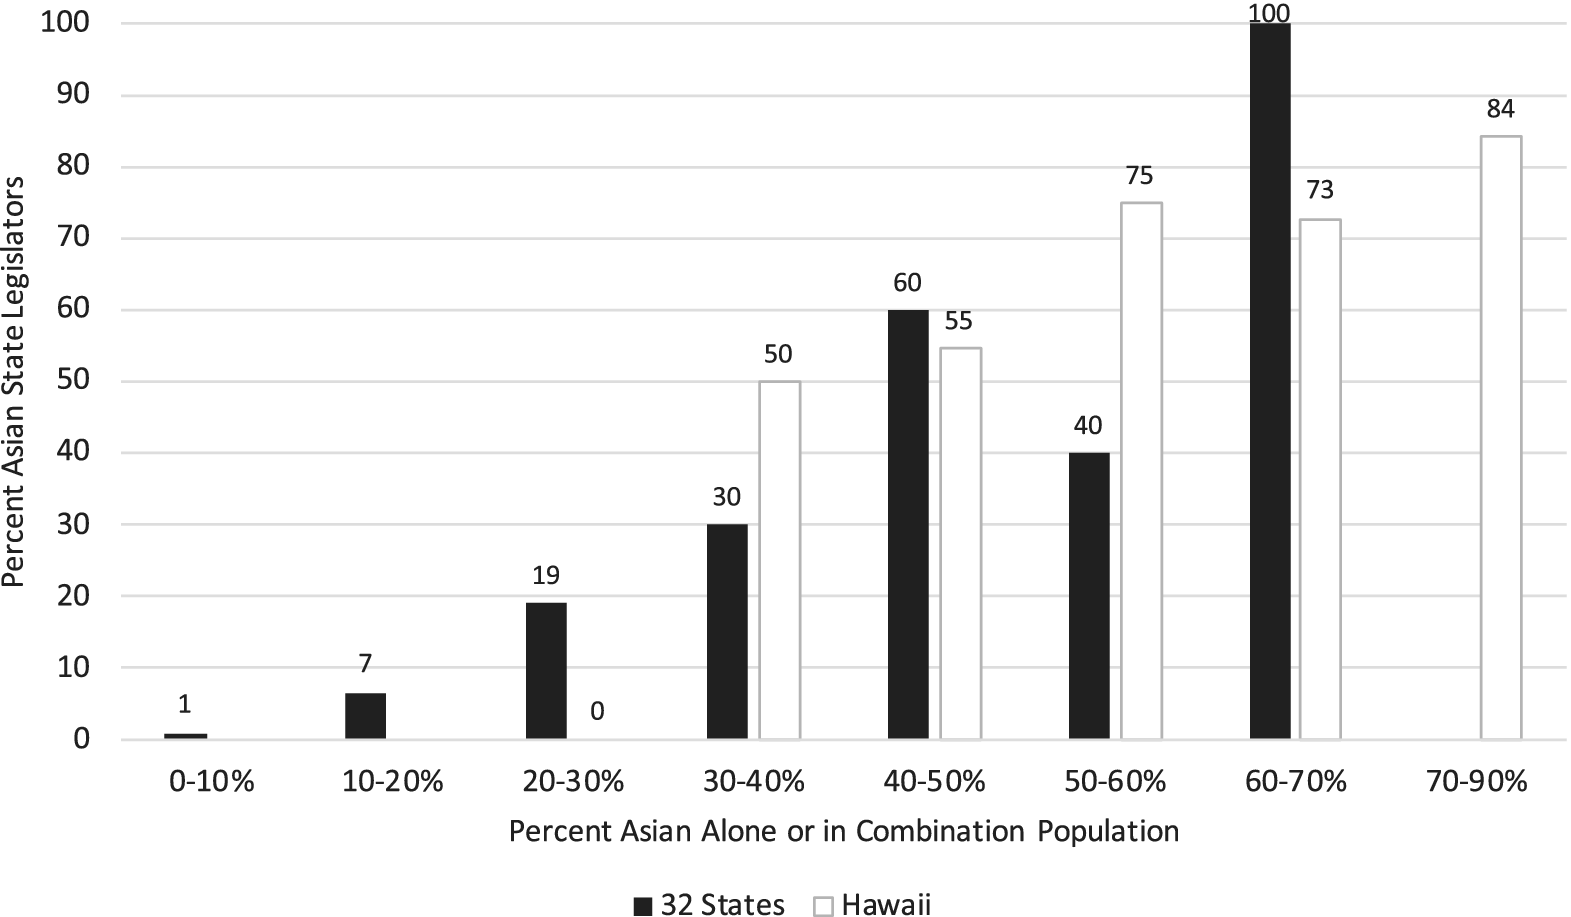
Figure 4. Percent Asian American State Legislators by Asian Alone or in Combination Population
Note: See the text for information on the 32 included states. Source: Data on legislator race gathered by authors. Data on Asian alone and combination population from the American Community Survey.
No matter how the share of Asian Americans is measured,Footnote 23 outside of Hawaii, Asians form a majority in no more than six state legislative and one congressional district. Unlike for African Americans and Latinos (Lublin Reference Lublin1997; Lublin et al. Reference Lublin, Handley, Brunell and Grofman2020), the intentional creation of Asian majority districts does not account for the bulk of officials elected to state legislatures or the U.S. House. The vast majority of Asian American legislators elected outside of Hawaii represent districts where Asian Americans, let alone their ethnic origin group, do not represent either a majority or even a near majority. Lower rates not just of citizenship but also turnout among Asian Americans further suggest that the data overstate the share of Asian American voters.
We turn now to multivariate analysis of this aggregate-level dataset. The unit of analysis is state legislative seats in 33 states, from 2011 to 2020. The dependent variable is whether a seat is held by an Asian American legislator and the main predictors are district-level demographics. Our estimator is multilevel logistic regression with random effects by district to address error clustering. We estimated all specifications with and without year fixed effects to account for the possibility that time trends may confound any results. Since all results are consistent regardless, we present the version without year fixed effects.
We use four different measures of the share of Asians Americans—Asians alone or in combination population, Asian alone population, Asian alone voting-age population (VAP), and Asian alone citizen voting-age population (CVAP)—and examine Hawaii separately. The bottom row displays the estimated proportion of Asians required for a district to have a 50–50 probability of having an Asian American legislator. Figure 5 shows the predicted probability of an Asian American legislator in a district based on the proportion of Asians.Footnote 24 Regardless of measure, the positive relationship is unambiguous.

Figure 5. Percent Asian and the Estimated Probability of an Asian State Legislator in Hawaii and 32 Other States
Note: VAP is the voting-age population. CVAP is the citizen voting-age population. Each curve shows the estimated probability of an Asian American state legislator based on the models in Table 1. Asian American winner is the dependent variable in all models with the only independent variables being different measures of the share of Asians. The estimator is multilevel logistic regression with random effects by district to address error clustering. The estimates based on the models including Asian Alone VAP and total population as independent variables are virtually identical, so only the former is shown here.
Having established the fact of Asian Americans’ elevated ingroup support, at least in the aggregate, the nature of that support remains to be seen. Does it flow mainly from voters of a given Asian American official’s own ethnic origin, or are Asian American officials equally adept at drawing panethnic support from other Asian origin groups? In the aggregate, the question is how diversity within a district’s Asian American community effects the probability of an Asian American candidate winning. Model 1 in Table 2 tests the impact of this by including a measure of diversity within the Asian American community—in this case a Herfindahl index ranging from 0 (maximally homogenous with respect to ethnic origin diversity) to 1 (maximally diverse)—and an interaction of this measure with the share of Asian Americans (since any negative effect of intragroup diversity should increase as their numbers grow).Footnote 25 Asian American community diversity has no effect, all else equal, and, if anything, the probability of an Asian American legislator slightly increases with intragroup diversity, which flatly contradicts theories that suggest ethnic origin diversity among Asian Americans hinders their election.Footnote 26
Table 2. Random Effects Logistic Regression Models of the Election of Asian American State Legislators that Include Intergroup or Intragroup Diversity, Excludes Hawaii

Note: VAP is the voting-age population. The dependent variable is Asian American winner with Asian Americans coded as 1 and other as 0. Asian American winners include legislators with multiple racial origins, but their exclusion does not alter the substantive results. The intergroup diversity Herfindahl index equals 1 − Σ(xi/population)2 with xi being the standard census racial categories with Hispanics excluded and treated as a separate category. The non-Hispanic multiracial population is also treated as a distinct category. The intragroup diversity Herfindahl index equals 1 − $ \Sigma $
(xi/population)2 with xi being the census ethnic origin categories. We have, however, combined Chinese and Taiwanese as well as Japanese and Okinawans. The model includes both state house and state senate elections for the 32 states outlined in the text. The estimator is multilevel logistic regression with random effects by district to address error clustering. We estimated all specifications with and without year fixed effects to account for the possibility that time trends may confound any results. Since all results are consistent regardless, we present the version without year fixed effects. The number of cases is lower for the intragroup diversity model due to missing data on ethnic origin for cases where racial data are available. Source: Data on the percentage of Asians from the American Community Survey. Data on legislator race gathered by author. See the text for more detail.
$ \Sigma $
(xi/population)2 with xi being the census ethnic origin categories. We have, however, combined Chinese and Taiwanese as well as Japanese and Okinawans. The model includes both state house and state senate elections for the 32 states outlined in the text. The estimator is multilevel logistic regression with random effects by district to address error clustering. We estimated all specifications with and without year fixed effects to account for the possibility that time trends may confound any results. Since all results are consistent regardless, we present the version without year fixed effects. The number of cases is lower for the intragroup diversity model due to missing data on ethnic origin for cases where racial data are available. Source: Data on the percentage of Asians from the American Community Survey. Data on legislator race gathered by author. See the text for more detail.
Lack of common identity and even antagonistic relationships between countries of origin have apparently not prevented the construction of a panethnic Asian American identity (Espiritu Reference Espiritu1992; Okamoto Reference Okamoto2014). These results may also reflect the disproportionate weight of young and non-first-generation Asian Americans among Asian American voters who are more likely to identify as Asian Americans (Tam Reference Tam1995; Wong et al. Reference Wong, Ramakrishnan, Lee and Junn2011). They also reflect “points of convergence on a key set of public policies” across Asian American ethnic origin groups (Wong and Shah Reference Wong and Shah2021, 75).
Individual-Level Evidence
Do these patterns hold up when we examine the preferences of Asian American voters? Figure 6 shows responses to a battery of questions fielded in both the 2016 NAAS and our 2021 survey, prompting respondents as follows: “Thinking about the next Congress and who should be elected. Please tell me how important the following statements are.” Respondents were then asked, in sequence, about their own racial/ethnic group, women, their own party identification, and “people in Congress who represent the issues I care about most.” As an added twist, Asian American respondents in both surveys were prompted, at random, to consider either their own ethnic origin group or “Asian Americans,” allowing for a clean test of relative support for the two categories.
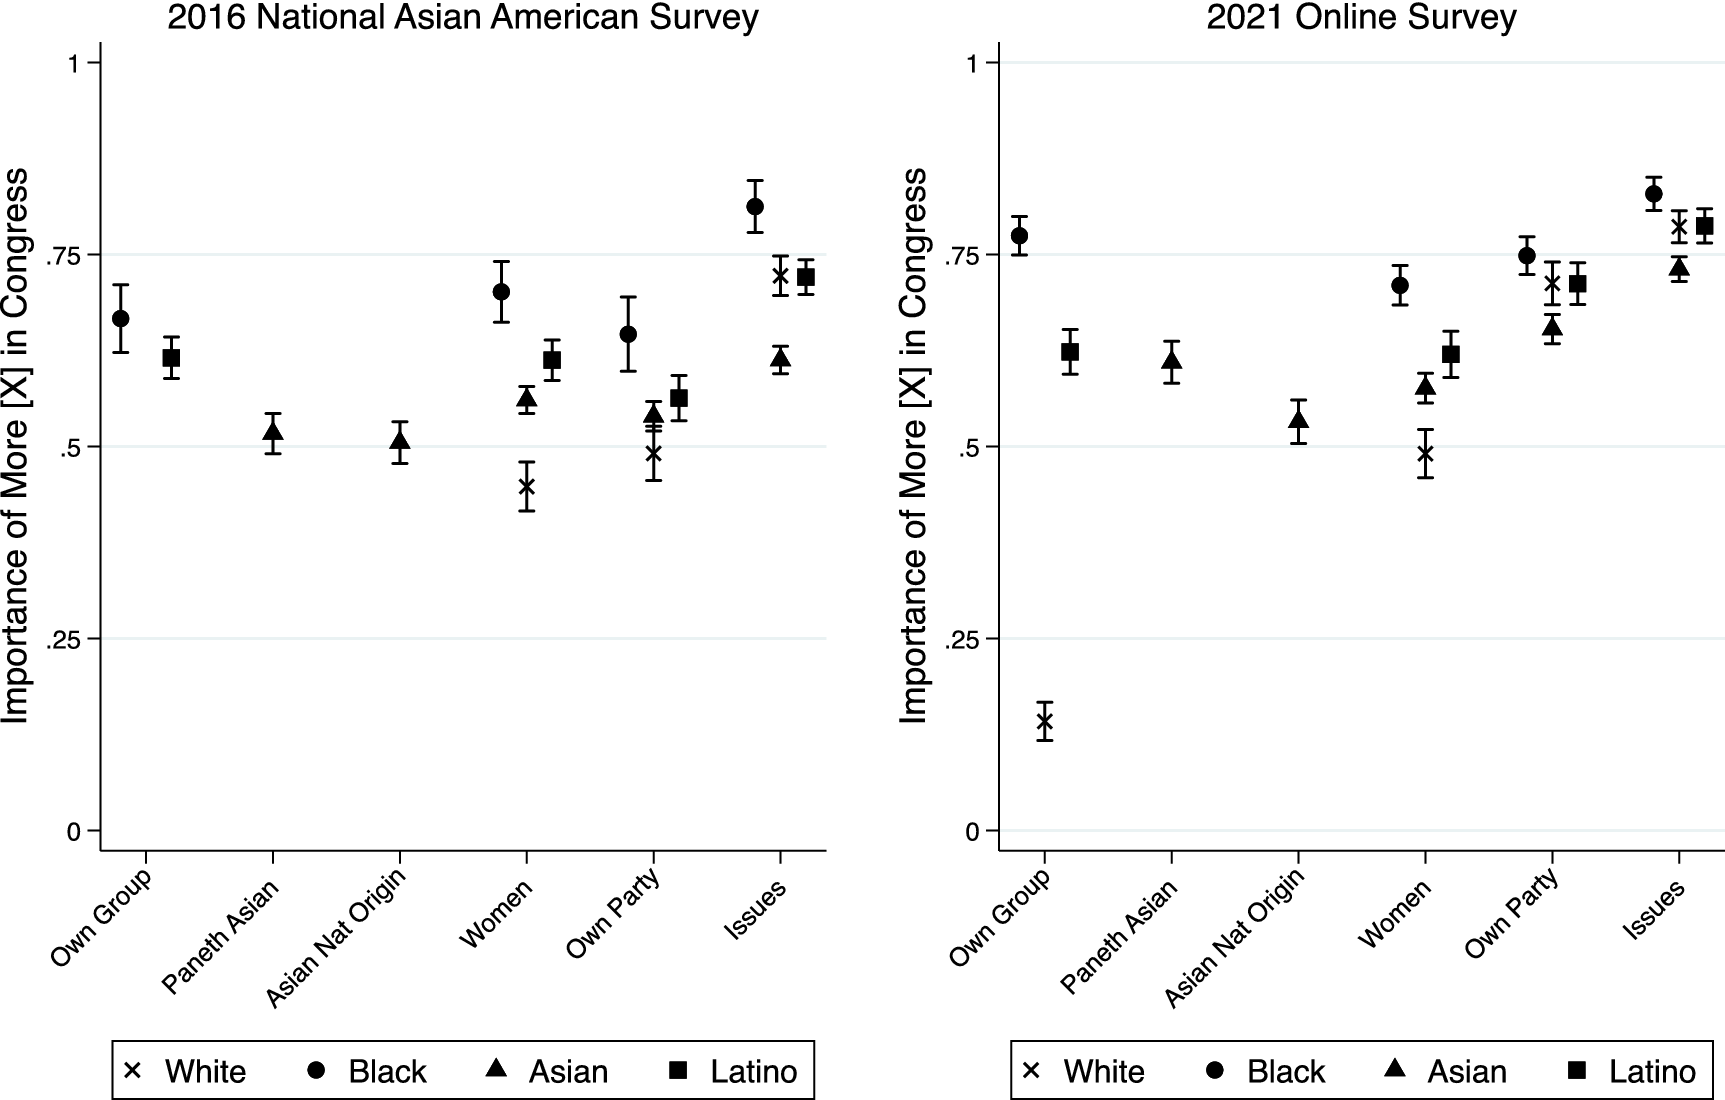
Figure 6. Preferences on Different Kinds of Representations in Congress by Group
Note: Points represent means with 95% confidence intervals. Each x-axis value is a different item in the representation battery asked identically in both surveys. Possible scores range from 0 = not at all important to 1 = extremely important. Note that the “Paneth Asian” and “Asian Eth Origin” items were asked only of Asian respondents; these respondents saw either “Asian Americans” or their own ethnic origin, respectively, assigned at random. The figure was produced from the following tables, posted as individual files in the Harvard Dataverse associated with this article: “2021 Online Survey Aggregates for Figure 6.dta” and “NAAS 2016 Aggregates for Figure 6.dta.” Each table was generated from 2021 Online Internet Survey and 2016 NAAS (respectively) per detailed instructions provided in the posted do-file “Survey Analysis Code.do.” Source: 2016 NAAS and 2021 Online Internet Survey.
What emerges is striking consistency across surveys, all the more remarkable given that they were fielded 5 years apart using very different modes of sampling and administration. Three results stand out in both cases: (1) across all minority groups, there is fairly strong support for more descriptive representation in Congress, with Asian respondents comparable to those who are Latino but less supportive than those who are Black; (2) all groups tend to favor substantive representation (i.e., partisan and issues) over descriptive representation; and (3) across categories of ingroup support, Asian American respondents do not appear to discriminate strongly between their own ethnic origin and “Asian American” representation, with no difference in the NAAS and a slight preference for the latter in our survey.
This last point is relatively strong evidence for our panethnic hypothesis (H2-PEH), and fully consistent with the aggregate-level findings shown earlier: Asian American candidates find as much support from Asian American voters outside their own origin group as from inside. To test this further, we turn to a vignette experiment embedded in our 2021 online survey asking respondents to evaluate hypothetical U.S. House candidates. We vary the candidate’s race/ethnic origin according to nine possible combinations—the six Asian origin groups for whom we have respondents, plus white, Black, and Latino—using a combination of surname, parent’s country of birth, and origin ethnicity. We also vary, in tandem with this information, the candidate’s panethnic identity (“Asian American,” “Anglo American,” “African American,” and “Hispanic American”).Footnote 27 Finally, we varied the candidate’s job history, toggling either a community organizer interested in protecting workers’ rights or a small business owner devoted to reducing regulations to create jobs. Political experience is held constant as all candidates have “spent the last 3 years on his local city council.” The basic vignette is as follows:
This is Michael [surname], who is preparing to run for a seat in the U.S. Congress. Born in the U.S. to parents who immigrated from [ethnic origin], he is currently 37 years old, and married with two children. He is college-educated, and [work background]. While proud of his [ethnic origin] roots and his [panethnic] identity, if elected he pledges to work hard on behalf of all those he represents.
Respondents are then asked three agree-disagree questions, which we combined into an additive favorability index based on their strong overall commonality (Cronbach’s alpha = 0.89):
-
• “Michael [surname] is the kind of candidate that understands the political issues that matter to me.”
-
• “If he won, Michael [surname] would represent my district well in Congress.”
-
• “I would like to see more people like Michael [surname] in Congress.”
Our interest is specifically in how our Asian American respondents evaluate candidates of different ethnic origins, plotted in Figure 7. The most relevant comparisons are among the three left-most bars, which reference candidates of the respondent’s own ethnic origin group (“R’s Eth Origin”), another of the five Asian origin groups (“Other Asian Origin”), and the average of all non-Asian groups (“Non-Asian W-B-L”). Bars to the right indicate mean scores for Asian respondents applied to white, Black, and Latino candidates separately. Altogether, the results best fit the panethnic hypothesis: Asian Americans tend to favor Asian American candidates over others all else equal, contra the non-group-centric hypothesis (H3-NGC). And, while there is a slight preference for their own ethnic origin, the difference is not statistically significant as the ethnic origin hypothesis (H1-EOH) would have anticipated. In short, Asian Americans do seem to have group-centric political preferences and they are willing to support candidates of other Asian ethnic origins almost as much as candidates of their own.
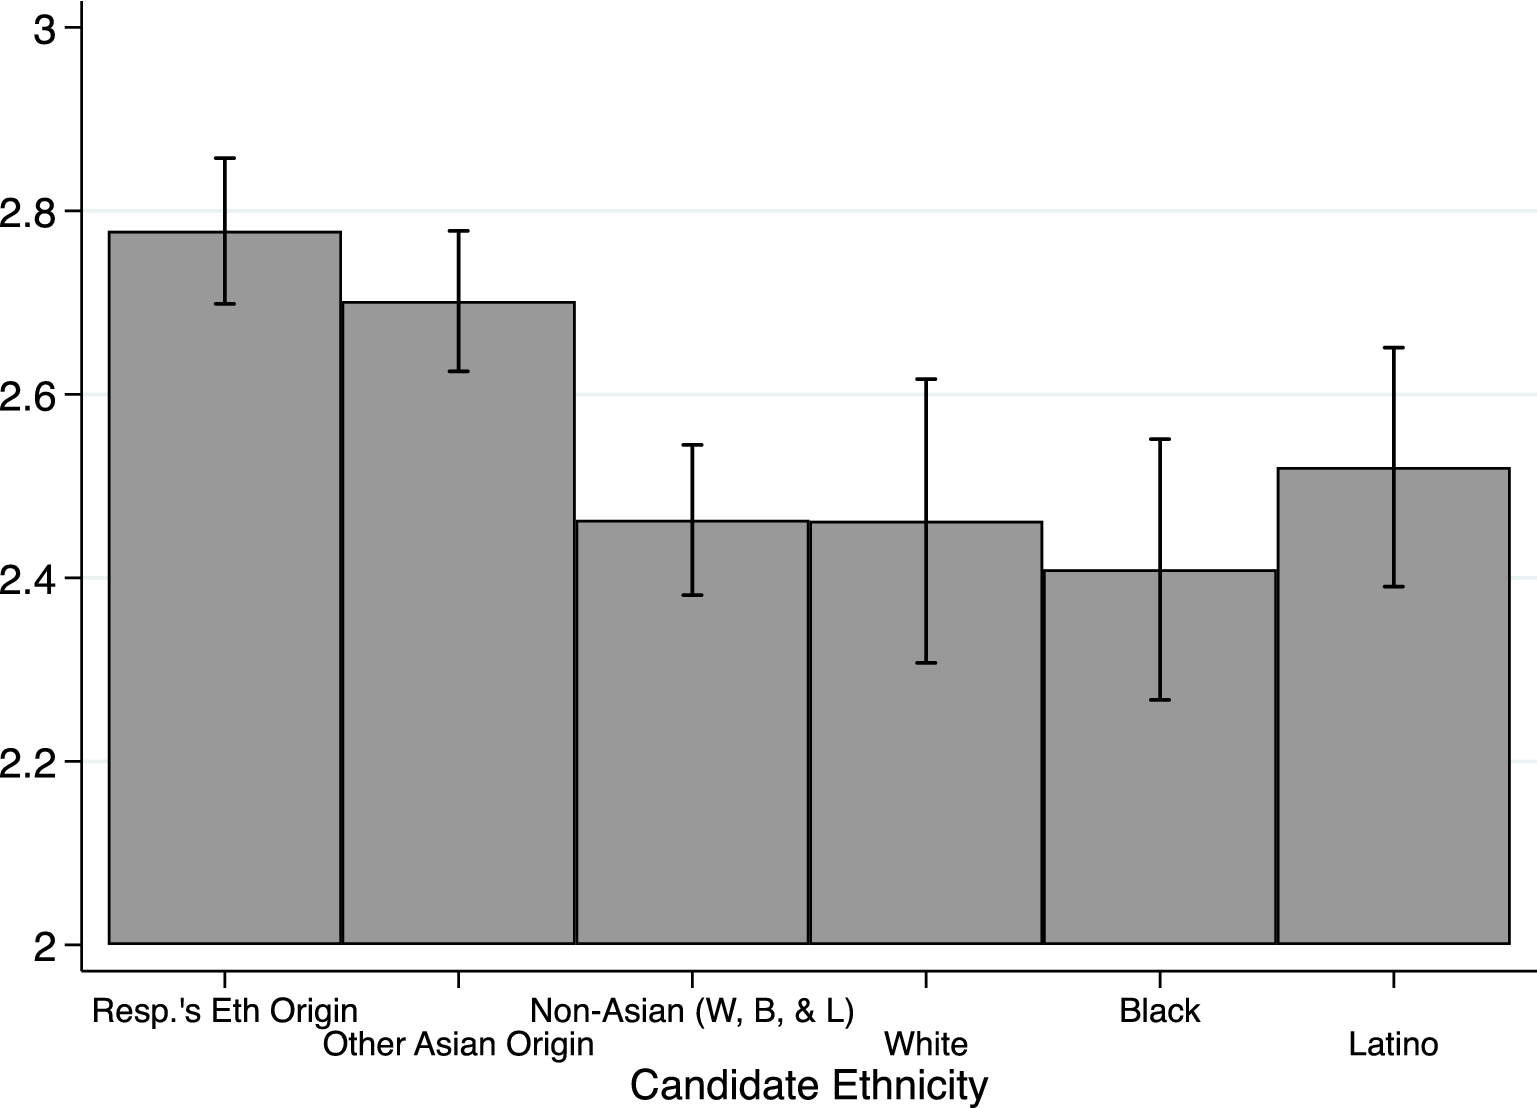
Figure 7. Asian Voter Candidate Preference by Race/Ethnicity of Candidate
Note: This figure maps support for vignette candidate (and additive index of three favorability questions asked), with scores ranging from 0 = completely unfavorable to 3 = completely favorable. Only Asian respondents are included. “W,” “B,” and “L” stand for “white,” “Black,” and “Latino,” respectively. Spikes represent 95% confidence intervals. The figure was produced from the following table, posted in the Harvard Dataverse associated with this article: “2021 Online Survey Aggregates for Figure 7.dta.” This table was generated from the 2021 Online Internet Survey per detailed instructions provided in the posted do-file “Survey Analysis Code.do.” Source: 2021 Online Survey.
EXPLAINING ASIAN POLITICAL SUCCESS: CROSSOVER VOTING
Aggregate-Level Evidence
How do Asian American candidates fare, versus candidates of other minority groups, for a given underlying prevalence of that group in the district electorate? In contrast to the many studies indicating that Black and Latino candidates require districts with at least majority of their group (or close to it) to win election in most areas (e.g., Davidson and Grofman Reference Davidson and Grofman1994; Lublin et al. Reference Lublin, Handley, Brunell and Grofman2020; Parker Reference Parker1990; Whitby Reference Whitby1997), Asian American candidates become more likely than not to emerge victorious at lower levels. The odds shift in favor of an Asian American legislator once Asians alone or in combination form more than 41% of the total population. The same is true when Asians alone surpass 33% of CVAP, a share that rises to 39% for the VAP and the total population. For Hawaii, the required proportion of Asian alone or in combination population for Asian American legislators to have an equal shot of holding the district is 40%, close to that outside the islands.
Looking at Asian CVAP, the measure that most closely mirrors the Asian American share of the electorate outside Hawaii, models indicate that Asian candidates should win one in seven contests in 20% Asian districts—odds that increase to one in four at 25% Asian. The chances of an Asian American candidate winning are lower for broader measures of the Asian population that include many noncitizens, 1 in 10 for 20%, and 1 in 6 for 25% Asian alone VAP or total population districts. The probabilities decline to 1 in 13 at 20% and 1 in 7 at 25% based on the model using the population of Asians alone or in combination, the most expansive measure of the Asian population.
These figures matter because, outside Hawaii, there are far more districts between 20% and 30% Asian than greater than 30% Asian—2.5 times as many based on the broadest measure of Asians alone or in combination.Footnote 28 As a small, dispersed minority, Asian American candidates need to win in contexts where they are far from the majority to gain representation. Asian Americans can only very rarely leverage the Voting Rights Act (VRA) to create more electoral opportunities due to the inability to create Asian majority districts.
Similar models of the election of Black and Latino legislators confirm that Asian legislators succeed disproportionately for any percentage of Asians compared to equivalent percentages of Blacks or Latinos.Footnote 29 Figure 8 shows the predicted relationship between the proportion of same-group CVAP and the probability of an Asian, Black, or Latino state legislator. The probability of an Asian legislator is higher at any given proportion than for Black or Latino legislators. Due to much higher citizenship rates in the Black than Asian or Hispanic population, the probability of a Black legislator trails that of an Asian legislator by much less and roughly matches that for a Latino legislator for any proportion of same-group VAP (not shown here).Footnote 30

Figure 8. Estimated Probability of Asian, Black, or Latino Legislator by Group CVAP
Note: CVAP is the citizen voting-age population. Each curve shows the estimated probability of either an Asian, Black, or Latino state legislator based on the appropriate models in Table 1 and Supplementary Table 9. In these models, the dependent variables are Asian, Black, or Latino winner with the corresponding CVAP for that group included as an independent variable. The model of Black winner also includes Hispanic CVAP. The estimator is multilevel logistic regression with random effects by district to address error clustering. Results are based on data from the 32 states included in the dataset as described in the text other than Hawaii.
A small group that is diverse within its own ranks, Asian American politicians must swim in political pools that vary considerably in racial and ethnic composition. Here, we leverage our aggregate-level data onto our specific hypotheses about crossover support for Asian American candidates. The core question is: do Asian American candidates get crossover support primarily from whites, or from members of other minority groups? Figure 9 shows the share of Asian Americans elected outside of Hawaii at different levels of intergroup diversity as measured by a Herfindahl index that ranges from 0 to 1 with higher numbers indicating greater diversity.Footnote 31 Despite occasional dips in the proportion of Asian American officials as intergroup diversity rises, Asian Americans clearly hold a much higher share of state legislative and congressional districts at high levels of intergroup diversity.

Figure 9. Percent Asian American Legislators in 2020 by District Diversity, Excluding Hawaii
Note: All states but Hawaii included for the U.S. House. See the text for information on the 32 included states for state legislators. The intergroup diversity index equals 1 − Σ(xi/population)2 with xi being the standard census racial categories with Hispanics excluded and treated as a separate category. The small non-Hispanic multiracial population is also treated as a distinct category. Source: Data on legislator race gathered by authors. Data on race and ethnicity from the American Community Survey.
The low rate of Asian American candidate success in the 0–0.1 category is not especially surprising. Outside Hawaii, there are no heavily Asian American districts, so these are homogenous districts populated by another racial or ethnic group. The failure of Asian American candidates to win a greater share of seats in the 0.1–0.4 range is more interesting. If Asian Americans fared best in districts that contained only one other racial or ethnic group, such as whites, we would expect to see more Asian American winners in this range. Instead, Asian American candidates clearly experience their highest rates of success in multiracial districts with intergroup diversity scores above 0.6.
The descriptive data provide preliminary evidence against the model minority hypothesis (H4-MMH), which suggests that Asian American candidates should do better in white majority districts, and in favor of both the shared minority status (H5-SMSH) and next best choice (H6-NBCH) hypotheses, in that Asian American candidates do better in multiracial districts than in mostly white ones. Assessing the solidity of any relationship between intergroup diversity and the probability of an Asian American official requires a multivariate model, as the figure does not control for the share of Asian Americans. Model 2 in Table 2 presents a random effects multilevel logistic regression model that does so.
The marginal effect of intergroup diversity is expressed graphically in Figure 10. Even after controlling for the share of Asian Americans, intergroup diversity has a strong effect. An increase from a moderately low 0.25 to a moderately high 0.55 in intergroup diversity spurs a jump in the probability of an Asian American legislator from 0.58% to 1.00%—a substantively meaningful 72% gain considering that Asian Americans comprise only 2.5% of all cases.Footnote 32 The results exhibit the same pattern for the U.S. House but are not statistically significant due to the smaller number of cases.

Figure 10. Estimated Probability of an Asian American State Legislator as Intergroup Diversity Varies with 95% Confidence Intervals
Note: Estimated probability of an Asian American winner based on Model 1 in Table 2. The independent variables in the model are proportion Asian voting-age population, intergroup diversity, and an interaction of the two variables. The estimator is multilevel logistic regression with random effects by district to address error clustering. Results are based on data from the 32 states included in the dataset other than Hawaii.
Tests of alternative models reveal that these results cannot be explained by changes in the share of any individual racial group. We examined models that, in addition to the percentage Asian VAP, controlled separately for the percentage of non-Hispanic white VAP, Black VAP, and Hispanic VAP. None of the models accord with the hypothesis that Asian Americans are more likely to win in districts with more non-Hispanic whites or the alternative that they fare better in districts with higher Black or Latino populations. Beyond falling well short of statistical significance, increasing the share of any of these non-Asian groups beyond a comparatively low level always results in a decline that has no effect on the probability of an Asian American legislator.Footnote 33
Asian American candidates benefit from greater intergroup diversity rather than the presence of members of any one other major racial or ethnic group. This aligns with theories suggesting that Asian American candidates have greater electoral opportunities the less a constituency is seen as “belonging” to any one racial or ethnic group. It does not support the notion that Asian American candidates do better in areas with more whites due either to favorable perceptions by whites of the so-called “model minority” or to frictions between Asian Americans and other minority community members. Nor do the results support the conclusion that Asian American candidates receive more support from other communities of color.
Individual-Level Evidence
Now, we examine Asian American candidates’ crossover appeal to voters of different racial or ethnic groups, using our 2021 online survey. For this, we return to the candidate choice vignette, described above. Figure 11 leverages this vignette onto crossover voting by showing mean candidate support among white, Black, and Latino respondents, across every permutation of candidate race or ethnicity. Bars are labeled by respondent race/ethnicity (WR, BR, and LR) and candidate race/ethnicity (WC, AC, BC, and LC) such that, for example, “BR, AC” refers to mean support among Black respondents for an Asian candidate.

Figure 11. Non-Asian Voter Preferences by Candidate Race/Ethnicity
Note: This figure maps support for vignette candidate (an additive index of three favorability questions asked), with scores ranging from 0 = completely unfavorable to 3 = completely favorable. Bars represent permutations of respondent (R) race (W for “white,” B for “Black,” and L for “Latino”) and candidate (C) race (W, A, B, and L). Only non-Asian respondents are included. Spikes represent 95% confidence intervals. The figure was produced from the following table, posted in the Harvard Dataverse associated with this article: “2021 Online Survey Aggregates for Figure 11.dta.” This table was generated from the 2021 Online Internet Survey per detailed instructions provided in the posted do-file “Survey Analysis Code.do.”
Assessments are broadly favorable and there is very little difference across the various combinations. There is some evidence of Asian American candidates’ disproportionate crossover support in that white, Asian, and Latino respondents all seem to prefer Asian American candidates to whites all else equal; here, then, there is perhaps a hint of evidence for our model minority hypothesis (H4-MMH) in whites’ preference for Asian American candidates over those who are members of other minority groups. There is also support for the shared minority status hypothesis (H5-SMSH) in Black and Latino preference for Asian over white candidates, all equal. But none of these differences are substantively large or statistically significant. Ultimately, then, evidence here is more consistent with the non-group-centric crossover story (H7-NGCC): there seems to be virtually no group differentiation per se, in the presence of other contextual information about the candidate and the election.
Taken together, unlike our evidence on ingroup support, the evidence on crossover presents a somewhat mixed picture. In the aggregate, we find no evidence of whites’ preference for Asian Americans as a “model minority” (H4-MMH) and some suggestion that Asian American candidates do better in diverse, multiracial districts. This seems tentatively in favor of the notion that Black and Latino voters exhibit some kind of preference for Asian American candidates, either because of shared minority status (H5-SMSH) or as second preference versus a candidate of their own group (H6-NBCH). But at the individual level, the picture is somewhat different: there, we see very little in the way of statistically significant group differences, all else equal. This leaves us, at least tentatively, most closely in line with the non-group-centric-crossover model (H7-NGCC).
ROBUSTNESS IN THE AGGREGATE-LEVEL EVIDENCE
Beyond racial composition and diversity, we separately looked at a variety of alternative models designed to assess other theories. Some of these are tied to factors internal to the Asian American community that might be expected to amplify resources and turnout.Footnote 34 To explore the effect of institutional arrangements, we also looked at single versus multimember districts, term limits, legislative professionalism, and population. Unlike in Casellas’ (Reference Casellas2011) study of Latino legislators, none demonstrated a significant relationship to the election of Asian American officials.Footnote 35 Finally, we considered models that controlled for the education, as measured by the share of college graduates of non-Asian Americans, as education has been linked to greater racial tolerance. These models revealed that education has a substantively and statistically meaningful positive link to the election of Asian American officials.Footnote 36 Including this factor does not alter the central findings regarding the relationships of either intergroup or intragroup diversity to the election of Asian American legislators.
CONCLUSIONS
This paper has aimed to provide a comprehensive picture of descriptive representation of Asian Americans. Built on a new and unprecedented data collection effort, we map out where Asian American candidates have been able to succeed over the past few decades, how this success relates to district demographics, and, finally, gain some insight into why. In so doing, we build on a literature that has, for the most part, focused on deep dives on specific districts and specific races. For all the theoretical richness these studies provide, we simply have not known much—until now—about Asian American descriptive representation or the underlying dynamics of the election of Asian American legislators in the big picture. Nor do we know whether the claims made from these studies are generalizable.
In the aggregate, we show that: (1) Asian Americans have yet to attain descriptive parity with their population size in most U.S. contexts, but when they win, they are able to do so with a lower proportion of Asian Americans in their district than other U.S. minority groups win with theirs; (2) the more multiracial a constituency, the more Asian American candidates win; and (3) Intracommunity diversity has no impact on Asian American electoral success. Consistent with the aggregate-level findings, individual-level evidence shows a strong element of panethnic support for Asian American candidates that extends beyond the boundaries of that candidate’s ethnic origin group. Because the experiments controlled for candidate policy position and competence, we interpret this difference as reflecting group-centric motives. In terms of crossover, we find—also consistent with the aggregate-level evidence—that Asian American candidates do not do especially well among white voters; rather, all racial groups exhibit a slight bias toward Asian American candidates (vs. white candidates), but the lack of statistically significant differentiation indicates that Asian American candidates’ crossover support is less about race per se and more about other political attributes they bring to bear. The picture is less clear than it was with ingroup voting, however, and thus more evidence, especially at the individual level, is called for.
In this paper, we brought to bear a diverse yet complementary array of evidence on the drivers of support for Asian American candidates. This gives us substantial leverage to make claims about the demographic factors that help or hinder descriptive representation for this group, and some of the psychological factors predisposing voters in favor of or against its candidates. Yet of course much remains to be learned, especially with respect to campaign-related dynamics: we cannot say much about structural features of American politics (its two-party system and various institutional arrangements), nor can we address in depth campaign-related dynamics such as candidate and opponent rhetoric, media coverage, and so on.
The broader implications of these findings are, perhaps most significantly, that the electoral patterns of Asian American legislators are profoundly different than what has been found for Black and Latino legislators. The overwhelming evidence is that Black and Latino candidates win in districts where their group composes a majority. Asian Americans are more dispersed and, outside Hawaii, rarely form a majority in legislative districts. Their success nonetheless is broadly in agreement with the idea, established in the case studies cited earlier, that they are better able to achieve crossover support. Second, this crossover support is limited neither to whites and white majority districts nor to people of color and districts where they form a majority. Indeed, Asian Americans perform even better in districts that are broadly diverse, signaling crossover potential not just with whites but with Black and Latino voters as well. Like African Americans and Latinos, Asian Americans face barriers to representation, but the nature of these barriers is not the same (Kim Reference Kim2018).Footnote 37
All of this bodes well for increased representation of Asian Americans as demographic change works to diversify districts. The effects of more targeted political efforts to achieve representation, on the other hand, have been less uniformly positive. The federal VRA has mandated ballots and other voting materials in Asian languages where the size of the language group is sufficiently large.Footnote 38 But Asian Americans have not benefited from favorable redistricting maps that have aided Black and Latino efforts to overcome institutional barriers, including those of the electoral system (Chen and Lee Reference Chen and Lee2013; Phillips Reference Phillips2021).
In the bigger picture, this study has triangulated a great deal of evidence on theoretical questions about the nature of crossover voting, and the power of panethnic political support. Legislative representation is of perennial interest both inside and outside of academic debates and our findings here not only shed light on one particular fast-growing (yet still understudied) group, but also point to a broader understanding of how minority communities can make their voices heard in legislatures across political contexts.
SUPPLEMENTARY MATERIAL
To view supplementary material for this article, please visit http://doi.org/10.1017/S0003055423000242.
DATA AVAILABILITY STATEMENT
Research documentation and data that support the findings of this study are openly available in the American Political Science Review Dataverse at https://doi.org/10.7910/DVN/NYOXTE.
ACKNOWLEDGMENTS
Thanks to Marissa Klass, Henry Lin, and Kumail Wasif for their research assistance, Carl Klarner for improving the accuracy of the state legislative data, and Wendy Tam Cho, Ken Meier, and three anonymous reviewers for commenting thoughtfully on versions of this research. All errors remain our own.
FUNDING STATEMENT
This research was funded by the School of Public Affairs and the Summer Scholars and Artists Research Fellowship at American University.
CONFLICT OF INTEREST
The authors declare no ethical issues or conflicts of interest in this research.
ETHICAL STANDARDS
The authors declare the human subjects research in this article was deemed exempt from review by the University of British Columbia and American University.


 Open access
Comments
No Comments have been published for this article.