


In the past decades the worldwide prevalence of overweight and obesity has increased dramatically in both adults and children(Reference Ebbeling, Pawlak and Ludwig1–Reference Wang, Monteiro and Popkin3). Despite much research and multiple efforts for intervention, the increase is still ongoing(Reference Popkin4, 5). By 2015 the worldwide number of overweight and obese adults is expected to be approximately 2·3 billion and more than 700 million, respectively(5). In the Netherlands the prevalence of overweight and obesity is expected to increase from 36 % and 12 %, respectively, in 2004 to 41 % and 18 % in 2024(Reference Bemelmans, Hoogenveen and Visscher6). Overweight and obesity are well-established risk factors for the development of a wide range of disorders including type II diabetes, CVD, musculoskeletal disorders and several cancers(Reference Haslam and James7). In addition, serious psychological problems (e.g. depression) can arise from obesity due to social discrimination, particularly in children(Reference Ebbeling, Pawlak and Ludwig1, Reference Haslam and James7–Reference Must and Strauss9). Therefore overweight and obesity are serious public health hazards for both the present and the future.
Overweight children have a high risk of becoming an overweight adult(Reference Kvaavik, Tell and Klepp10–Reference Freedman, Khan and Serdula13), therefore primary prevention should preferably start early in life. Hence it is important to establish which lifestyle factors that are modifiable in childhood are related to overweight and obesity later in life. Concerns have been raised about the current high intake of sugar-containing beverages (SCB) in both adults and children(Reference Malik, Schulze and Hu14–Reference Wang, Bleich and Gortmaker17). These drinks are high in energy content, while the majority have no nutritional benefit. It is hypothesized that consumption of SCB (i.e. liquid carbohydrates) leads to low satiety levels and incomplete compensation for the ingested energy at subsequent meals(Reference DiMeglio and Mattes18, Reference Mattes19). This results in higher total energy intakes and, eventually, weight gain.
The question whether or not the intake of SCB is related to weight status has been the subject of numerous studies and the issue has been evaluated in reviews frequently(Reference Malik, Schulze and Hu14, Reference Bachman, Baranowski and Nicklas20–Reference Vartanian, Schwartz and Brownell24). Most reviews conclude that there is a positive relationship(Reference Malik, Schulze and Hu14, Reference Harrington22–Reference Vartanian, Schwartz and Brownell24), while others find the evidence inconclusive(Reference Bachman, Baranowski and Nicklas20, Reference Forshee, Anderson and Storey21). Unfortunately, the majority of studies performed on this subject have a rather short follow-up period: only two studies have a follow-up from childhood into adulthood(Reference Viner and Cole12, Reference Nissinen, Mikkila and Mannisto25). Another limitation of previous studies is that most studies use only BMI as the outcome measure of adiposity, and this is a rather limited measure(Reference Romero-Corral, Somers and Sierra-Johnson26). Furthermore, dietary intake is commonly assessed through self-administered questionnaires, which is prone to under-reporting. Therefore, we investigated the relationship between the intake of SCB during adolescence (at the age of 13 years) and adult weight status up to 30 years later. We measured percentage of total body fat (%total fat) and percentage of trunk fat (%trunk fat) with dual-energy X-ray absorptiometry (DXA) and used these as the outcome measures of adiposity as well as BMI. Intake of SCB was assessed thoroughly through cross-check dietary history face-to-face interviews by a trained dietitian.
Experimental methods
Study design and population
All analyses were performed with the use of data from the Amsterdam Growth and Health Longitudinal Study (AGAHLS). The AGAHLS is a longitudinal observational cohort study about lifestyle and health with 30 years (1976–2006) of follow-up from adolescence to adulthood(Reference Kemper27). The initial cohort included a sample of 409 adolescents (195 boys and 214 girls) with a mean age of 13 years at baseline from two secondary schools in Amsterdam and the surrounding area(Reference Kemper and van 't Hof28). The study started by following this sample with four annual measurements (1976–1979)(Reference Kemper27). The follow-up was then extended with measurements at the ages of 21, 27, 29, 32, 36 and 42 years. The latest measurements took place in 2006. The AGAHLS was approved by the medical ethical committee of the VU University Medical Center and all subjects gave their written informed consent.
For the current analysis, participants were included when they had: (i) attended the first dietary assessment interview in 1976 (baseline); (ii) data available on weight status and all covariates at baseline; and (iii) data available from DXA measurement (%total fat and %trunk fat) and data on BMI in 2000 and/or 2006. These criteria led to the inclusion of 238 participants (Table 1).
Table 1 Characteristics of participants of the Amsterdam Growth and Health Longitudinal Study with data available on adolescent dietary intake, lifestyle and weight status in 1976 (age 13 years) and data available on adult weight status in 2000 and/or 2006 (age 36 and/or 42 years)

SCB, sugar-containing beverages; MET, metabolic equivalents.
Data are means and standard deviations unless indicated differently.
*According to international cut off points for BMI defined by Cole et al. (2000)(Reference Cole, Bellizzi and Flegal34).
†Overweight is defined as BMI ≥ 25 kg/m2; obesity is defined as BMI ≥ 30 kg/m2 according to WHO standards.
Assessment of intake of sugar-containing beverages
At baseline (1976) dietary intake was assessed through cross-check dietary history face-to-face interviews by a dietitian. Subjects were asked to recall the frequency of use and the amount of different foods and beverages during the previous month. In addition, all parents were questioned on the details of different food items and preparation(Reference Kemper and van 't Hof28–Reference Kemper, Post and Twisk30). For the current analysis the beverage intake was calculated in servings per day (220 ml = 1 serving) as this is easy to interpret in daily practice. Furthermore, sugar-containing beverages were divided into two categories:
1. Total sugar-containing beverages (total SCB): carbonated and uncarbonated sugar-sweetened drinks such as soda, lemonade, iced tea, sports drinks and energy drinks, fruit drinks (diluted and sugar-sweetened fruit juices) and 100 % fruit juices.
2. Sugar-containing beverages (SCB) excluding 100 % fruit juices.
Diet (low-energy) soft drinks, other non-caloric beverages, alcoholic beverages, milk and other liquid dairy products were not included in the analyses.
Anthropometric measurements
In 2000 and 2006, total body fat mass was measured using DXA. Since this is one of the most accurate techniques to measure adipose tissue(Reference Kennedy, Shea and Sun31–Reference Salamone, Fuerst and Visser33), %total fat and %trunk fat were chosen as the primary outcome measures. BMI (defined as body mass (kg) divided by body height squared (m2)) was also included as outcome measure, as it is most frequently used in epidemiological studies as the only measure of obesity. At all time points (1976, 2000 and 2006), measurements of body height and body weight were done by a trained nurse according to standard procedures with participants wearing only underwear(Reference Kemper, Post and Twisk30). If data were available from both 2000 and 2006, the mean of these two values was calculated and further used in the analysis. If only data from 2000 or 2006 were available, this single value was used in the analysis.
Overweight in adulthood was defined as BMI ≥ 25 kg/m2 and obesity as BMI ≥ 30 kg/m2, according to the WHO standards(5). For the definition of overweight and obesity at the age of 13 years, we used the international cut-off points for BMI defined by Cole et al.(Reference Cole, Bellizzi and Flegal34).
Covariates
For determination of total energy intake at baseline, all food and beverages consumed were converted into nutrients by use of the Dutch Food and Nutrition Table(Reference Kemper, Post and Twisk30). Subsequently, the total energy intake was calculated (kJ/d).
During childhood, body composition changes substantially with age due to the child's growth. At the age of 13 years, body composition and the level of maturation can differ considerably between participants. An attempt was made to correct for this through adjustment for developmental age. This measure was based on the level of maturation of the bones of the left hand and wrist on X-ray. For the estimation of skeletal ages the method of Tanner and Whitehouse (TW-II) was applied(Reference van Lenthe, Kemper and van Mechelen35).
Physical activity level (PAL) at baseline was assessed through cross-check standardized interviews based on a questionnaire. The interview was retrospective over the previous 3 months and covered the following areas: organized sports activities, unorganized sports activities (e.g. playing in the street), active transportation (e.g. bicycling) and activities at home, school and at work. PAL was calculated as the metabolic intensity of performed activities(Reference Kemper27).
No adjustments were made for smoking or alcohol use, because only few participants smoked or used alcohol at baseline. Adjustment for socio-economic status (SES) was considered not relevant here as all participants came from the same neighbourhood and had a similar SES (moderate to high).
Statistical analysis
We conducted multivariable, linear regression analyses to examine the relationship between level of SCB intake in adolescence and adult weight status. Separate analyses were performed for total SCB and SCB excluding 100 % fruit juices. %Total fat, %trunk fat and BMI were the outcome measures. Potential effect modification by gender was tested by using interaction terms (SCB × gender). Subsequently the following linear regression analyses were performed: (i) crude analysis; (ii) additional adjustment for BMI at baseline; and (iii) additional adjustment for developmental age and adolescent physical activity level; and (iv) additional adjustment for total energy intake.
For all analyses the SPSS for Windows statistical software package version 15·0 (SPSS Inc., Chicago, IL, USA) was used. Associations with a P value of 0·05 or less were considered as statistically significant.
Results
Characteristics of included participants
A total of 238 participants were included in this analysis. They had a mean age of 13 (sd 0·6) years at baseline (1976). Table 1 shows descriptive information on all included participants. Except for one overweight female, all other participants had a normal weight at baseline. In contrast, in adulthood eighty-seven participants (36·6 %) were overweight and fourteen (5·9 %) were obese.
Intake of beverages
Mean (sd) intake of total SCB for the total group at baseline was 223·3 (sd 172·1) ml, so approximately 1 serving (220 ml) per day. Females consumed slightly less than males: respectively 212 (sd 148) ml/d v. 235 (sd 195) ml/d (Table 1). Of all participants, 140 (59 %) consumed <1 serving SCB/d at baseline, while ninety-eight (41 %) consumed ≥1 serving SCB/d and twenty-six participants (11 %) consumed ≥2 servings SCB/d.
Sugar-containing beverage intake during adolescence and adult weight status
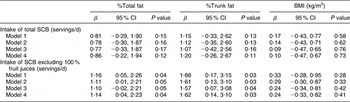
Because a significant interaction was found in most analyses between SCB intake and gender (data not shown), separate analyses were performed for males (Table 2) and females (Table 3). In males, but not in females, each additional daily serving of SCB excluding 100 % fruit juices at age 13 years was associated with 1·14 % higher %total fat (95 % CI 0·04, 2·23 %) and 1·62 % higher %trunk fat (95 % CI 0·14, 3·10 %) in adulthood after correction for confounders (Table 2). No statistically significant relationships were found between intake of SCB excluding 100 % fruit juices and BMI in both sexes.
Table 2 Results of linear regression analysis on the relationship between intake of total SCB/SCB excluding 100 % fruit juices at age 13 years and adult weight status (%total fat, %trunk fat and BMI) 25–30 years later in 114 males of the Amsterdam Growth and Health Longitudinal Study
SCB, sugar-containing beverages; %total fat, percentage of total body fat; %trunk fat, percentage of trunk fat.
Model 1, crude model; Model 2, adjusted for BMI at baseline; Model 3, adjusted for BMI at baseline, developmental age and physical activity level; Model 4, adjusted for BMI at baseline, developmental age, physical activity level and total energy intake.
Table 3 Results of linear regression analysis on the relationship between intake of total SCB/SCB excluding 100 % fruit juices at age 13 years and adult weight status (%total fat, %trunk fat and BMI) 25–30 years later in 124 females of the Amsterdam Growth and Health Longitudinal Study

SCB, sugar-containing beverages; %total fat, percentage of total body fat; %trunk fat, percentage of trunk fat.
Model 1, crude model; Model 2, adjusted for BMI at baseline; Model 3, adjusted for BMI at baseline, developmental age and physical activity level; Model 4, adjusted for BMI at baseline, developmental age, physical activity level and total energy intake.
Intake of total SCB at the age of 13 years was not related to measures of adult weight status (%total fat, %trunk fat and BMI) in both sexes (Tables 2 and 3).
Discussion
The present study showed a significant positive relationship between the intake of SCB excluding 100 % fruit juices at age 13 years and adult %total fat and %trunk fat in males but not in females. No significant relationship was found for BMI. In addition, no significant relationship was found between the intake of total SCB and adult weight status (%total fat, %trunk fat or BMI) in both sexes.
Interestingly, our results only show a positive relationship between adolescent SCB intake and adult %total fat and %trunk fat in males after exclusion of 100 % fruit juices from the definition of SCB. Like other SCB, 100 % fruit juices contain liquid carbohydrates and would theoretically also contribute to overweight development. However, a recent systematic review concluded that there was no clear positive relationship between the intake of 100 % fruit juices and overweight(Reference O'Neil and Nicklas36). Consumption of 100 % fruit juices generally coincides with other healthy lifestyle factors(Reference O'Neil, Nicklas and Kleinman37, Reference O'Neil, Nicklas and Zanovec38). Complete adjustment for all lifestyle factors is not possible, so residual confounding is inevitable.
We found two other longitudinal studies that used body fat as an outcome measure to investigate the relationship between adolescent intake of SCB excluding 100 % fruit juices and weight status. Results from these studies are not in line with our results. In the DONALD (Dortmund Nutritional and Anthropometric Longitudinally Designed) Study, a large German cohort study among 244 children aged between 9 and 18 years, Libuda et al.(Reference Libuda, Alexy and Sichert-Hellert39) found that baseline intake of SCB excluding 100 % fruit juices did not predict a change in %body fat during follow-up. However in that study body fat was measured through skinfold measurements, while we used DXA measurements which are more accurate. In a Canadian study with 208 participants aged between 8 and 19 years old, Mundt et al.(Reference Mundt, Baxter-Jones and Whiting40) reported that intake of SCB excluding 100 % fruit juices was not related to fat mass development assessed through DXA measurements. Both studies described above had a follow-up of only 5 years, while participants in our study were followed for 30 years, from adolescence into adulthood. Increases in – particularly trunk – adipose tissue are more likely to occur during the life phase from adolescence into adulthood than during 5 years in the adolescent phase(Reference van Lenthe, Kemper and van Mechelen41).
Among the longitudinal studies on the relationship between SCB intake (either total or excluding 100 % fruit juices) and weight status, only two other studies had a follow-up from childhood into adulthood, as in our study(Reference Viner and Cole12, Reference Nissinen, Mikkila and Mannisto25). Both studies used BMI as the primary outcome measure of weight status. Our results are in accordance with the results of the longitudinal Cardiovascular Risk in Young Finns Study by Nissinen et al.(Reference Nissinen, Mikkila and Mannisto25) who also found no relationship between sugar-sweetened soft drink intake at baseline (age ranging from 3 to 18 years) and BMI after a follow-up of 21 years(Reference Nissinen, Mikkila and Mannisto25). On the contrary, Viner and Cole(Reference Viner and Cole12) found that intake of two or more carbonated soft drinks daily at the age of 16 years predicted an increase in BMI between 16 and 30 years(Reference Viner and Cole12). Of importance here is that BMI is a relatively limited measure to assess adiposity as it does not distinguish between fat tissue and non-fat tissue(Reference Romero-Corral, Somers and Sierra-Johnson26). This can lead to either over- or underestimation of true values of adipose tissue. Assessment of adipose tissue by measuring actual fat mass or fat percentage, as was done in our study, is more accurate and therefore more reliable(Reference Romero-Corral, Somers and Sierra-Johnson26).
In contrast to what was found in males, the present study showed no relationship between intake of SCB excluding 100 % fruit juices at age 13 years and adult %total fat and %trunk fat in females. In addition, although not significant, regression coefficients in females appeared to be negative, suggesting an inverse relationship between intake of SCB (both total and excluding 100 % fruit juices) during adolescence and adult weight status in females. Confirmation or an explanation for this gender difference is not available from the literature. Additional research is required to confirm and further elucidate this gender difference.
The present study has important strengths. As mentioned earlier, determination of total fat and trunk fat was performed through DXA measurements. DXA is the most accurate technique to obtain data on body composition and adipose tissue(Reference Romero-Corral, Somers and Sierra-Johnson26, Reference Lintsi, Kaarma and Kull32, Reference Salamone, Fuerst and Visser33, Reference Kennedy, Shea and Sun42). Second, dietary intake was thoroughly assessed through the cross-check face-to-face interviews by a dietitian(Reference Kemper and van 't Hof28), which is one of the most extensive methods for assessing habitual dietary intake(Reference Bakker, Twisk and van Mechelen29). Third, the present study had a long follow-up of 30 years, from adolescence into adulthood, thereby enabling investigation of potential relationships between lifestyle factors that are modifiable in childhood and overweight and obesity later in life.
Besides the aforementioned strengths, the present study also has some limitations. The sample size was rather small (n 238) compared with the other two studies that had a follow-up from childhood to adulthood: n 4461(Reference Viner and Cole12) and n 2139(Reference Nissinen, Mikkila and Mannisto25). In addition, mean intake of SCB in 1976 was approximately 1 serving/d, which is quite low. The worldwide intake of SCB has increased considerably over the last decades(Reference Nielsen and Popkin15, Reference Olsen and Heitmann23, Reference Libuda, Alexy and Sichert-Hellert39, Reference Duffey and Popkin43–45) and SCB currently provide a larger source of daily energy than 30 years ago(Reference Popkin and Nielsen16, Reference Wang, Bleich and Gortmaker17). The intake of SCB might therefore be a more relevant modifiable early-life risk factor for development of obesity today than it was 30 years ago. Finally, although models were adjusted for several confounders, it remains difficult to adjust for all factors of (healthy) behaviour, and residual confounding is inevitable.
Conclusions
The present study showed a small, but statistically significant positive relationship between the intake of SCB excluding 100 % fruit juices at age 13 years and adult %total fat and %trunk fat in males, but not in females. Whether eliminating the consumption of SCB from dietary habits early in life is truly an effective effort for the prevention of obesity in future generations remains to be further investigated, preferably through intervention studies.
Acknowledgements
Source of funding: The Amsterdam Growth and Health Longitudinal Study was supported financially by the Dutch Heart Foundation (grants 76051–79051), the Dutch Prevention Fund (grants 28-189a, 28-1106 and 28-1106-1), the Dutch Ministry of Well Being and Public Health (grant 90-170), the Dairy Foundation on Nutrition and Health, the Dutch Olympic Committee/Netherlands Sports Federation, and Heineken Inc. Conflict of interest: None declared. Contribution of each author: J.W.R.T. is one of the project leaders of the AGAHLS. S.P.S., M.R.O. and J.W.R.T. designed the research question and the statistical analyses and models for the present study. S.P.S. ran the statistical analyses. S.P.S. wrote the initial manuscript. M.R.O. and J.W.R.T. contributed to the interpretation of the data, revised the manuscript and approved the final version.


