


Introduction
The development of infrared microspectroscopy dates back to the late 1940s and early 1950s at a time when infrared spectroscopy was in its early infancy [Reference McDowell1]. Since its development, infrared microspectroscopy has been used to characterize additives in synthetic fibers important in many different fields, including textiles, fabrics, forensics, and archeology. Molecular spectroscopy is an excellent tool to carry out fiber characterization, and the necessity of characterizing fiber additives such as colorants is multifaceted. For example, fiber and textile industries may need to ensure proper quality of materials and products. The ability to identify different fibers and colorants in a fiber found at a crime scene can greatly aid in solving a crime. Figure 1 illustrates infrared spectra of an acrylic fiber and a nylon fiber collected on one of the first commercially available infrared microscopes [Reference Coates2]. The spectra demonstrate that different fiber types can clearly be distinguished using infrared microscopy.

Figure 1: Infrared spectra collected on single fibers using the first commercially available infrared microscope (adapted from reference 2).
Further, the identification of pigments and dyes used in ancient works of art can provide insights into the origin and the technology of a civilization. Figure 2 illustrates the infrared spectrum of indigo dye and a spectrum produced from the subtraction of an undyed wool fiber spectrum from that of a blue Paracas Indian archeological fiber. The blue fiber was removed from a funerary bundle of the Paracas culture that existed from 400 BC to 400 AD in Peru [Reference Martoglio3]. Infrared techniques have been used in single-fiber analyses ranging from identification of single fibers and its additives to the characterization of polymer blends [4].

Figure 2: Reference spectrum of indigo dye (top) and the result of a subtraction of an undyed wool fiber spectrum from that of a blue Paracas Indian archeological fiber (bottom). Absorptions identifying the presence of indigo are marked with an “X.” (Reprinted with permission from Analytical Chemistry [Reference Martoglio3]).
One of the first infrared microscopes to become commercially available was the Perkin Elmer model 85 (illustrated in Figure 3), which enabled micrometer-size samples to be studied [Reference Coates2]. The prototype of this microscope was built by V. J. Coates, A. Offner, and E. H. Siegler after consultation with several potential users of such a piece of equipment. This report presented infrared spectra of single acrylic and Nylon fibers whose diameters were 17 and 20 micrometers, respectively (see Figure 1). However, to obtain spectra of sufficient quality, the length of the fibers had to be increased to 650 micrometers.

Figure 3: The Perkin Elmer 85 infrared microscope.
The minimum sample size that could be observed by this microscope varied but was, in summary, dependent on source brightness, optical geometry, transmission efficiency of the optical system, and detector sensitivity [Reference Coates2]. However, this method saw little use due to 1) the limited throughput associated with the sample size and 2) the serial data collection associated with the use of prisms/diffraction gratings and slits in spectrometers of the day [Reference Coates2,Reference Griffiths5]. Depending on the spectral resolution, a typical spectrum required 5 to 30 minutes per scan to collect, leading to extremely long data collection times.
With the introduction of Fourier transform infrared (FTIR) spectrometers in the 1970s, spectra could be collected in seconds, leading to significantly shorter collection times [Reference Griffiths5]. A large factor in reduced collection time comes from the fact that FTIR spectrometers benefit from the multiplex advantage, or the ability to measure all wavelengths simultaneously, compared to the serial data collection of dispersive instruments. The combination of this multiplex advantage and signal averaging enables spectra with a very high signal-to-noise ratio (SNR) to be generated [Reference Griffiths5]. Interest in using FTIR microspectroscopy to study small particles was revisited in the late 1970s following developments in the field of FTIR spectroscopy along with the need to identify microscopic contaminants in the electronics and semiconductor industries [Reference Lowry6].
Several studies have highlighted the use of FTIR instruments and beam condensers in the study of microscopic samples. In 1977 Cournoyer et al. [Reference Cournoyer7] demonstrated the use of FTIR in the detection of samples whose mass was less than 1 ng. In this work, the authors studied various samples using the first commercially available FTIR instrument, the Digilab FTS-14 FTIR spectrometer, which possessed a standard nichrome wire source, a deuterated triglycine sulfate (DTGS) detector, and a Perkin-Elmer 8 × beam condenser. In their work, they successfully analyzed a 6 ng sample of triphenyl phosphate from a manufacturing environment, 3.4 ng of a cellulose acetate film with a 100 μm aperture, and 0.9 ng of the same sample with a 50 μm aperture. The signal in the spectrum of the 0.9 ng sample was sufficient for the material to be identified. The authors also demonstrated that with extended scanning (≈ 40 hours) absorptions associated with 90 picograms of triphenyl phosphate in the film were recognizable [Reference Cournoyer7]. In similar work, Lacy et al. used FTIR to identify talc particles in an aliphatic oil matrix on a ceramic reader head from a computer disk memory-readout assembly. They also used FTIR spectroscopy to determine the identity of a Nylon particle that was lodged between a relay contact from a reaction-control system and identified marking ink on a microprocessor chip [Reference Lacy8]. Another study highlighted the integration of the original PE Model 85 infrared microscope with the FTIR instruments of the day. A Digilab Model FTS-20C spectrophotometer was modified to accept a 30-year-old Perkin Elmer Model 85 microscope. In this work, the combined system was capable of recording spectra of particles as small as 10–20 μm in diameter. Further, a variety of sample preparation techniques were highlighted [Reference Humecki9].
In 1983 Digilab introduced the first commercially available FTIR microscope, the Digilab UMA 100, which was designed to be integrated with the Digilab FTS-14 FTIR. This effort was followed by a number of infrared accessory manufacturers such as Spectra-Tech Inc. and other manufacturers of FTIR instruments who continue to build and market increasingly complex and sophisticated microscope systems. These systems not only perform infrared measurements, but can also be used in a wide variety of techniques associated with optical microscopy [Reference Sommer, Chalmers and Griffiths10]. While imaging and mapping are very useful in research environments, the basic applications of infrared microspectroscopy involve contaminant identification, and in the authors’ 33 years of experience, the vast majority of contaminants studied have been 50 micrometers in size or larger.
Although many advancements have been made in the field of FTIR spectroscopy in the last 30 years, the basic design and operating principles of the infrared microscope have generally remained unchanged. The majority of improvements have been made in the interferometers to which microscopes have been coupled. Specifically, developments in audio digital electronics dealing with signal processing have greatly improved the SNRs achieved by commercial instruments [Reference Jeschke and Goch11]. Figure 4 illustrates the normalized improvement in signal-to-noise performance from 1984 to 2014 for selected FTIR instruments. The outlier in this plot is the Perkin Elmer Spectrum GX, which at the time was a very high-end research-grade FTIR.

Figure 4: Normalized signal-to-noise Improvement in FTIR technology (Perkin Elmer FTIR spectrometers).
Along with advances in audio digital electronics came advances in array detectors (charged couple device [CCD] and now complementary metal-oxide semiconductor [CMOS]) used for image capture and documentation. Today high-quality image capture cameras and software can be obtained for less than a few hundred dollars. Finally, essentially over the same time period, major advances have been made in attenuated total internal reflection (ATR) accessories. These advances were the result of 1) the ability to produce high-quality, single-crystal synthetic diamonds for use as internal reflection elements and 2) improvements in optical fabrication using diamond-turning processes to produce precise, yet complex, optical surfaces. Today ATR measurements dominate the field, which includes ATR microscopes.
While many improvements have been made, one issue that is seldom addressed is cost. Most high-end microscope systems of today range in price between $100K to $250K and offer standard transmission, reflection, and ATR sampling modes. Many higher-priced microscope systems also offer mapping and imaging functions in these modes. With the increased performance of modern FTIRs and the need to reduce cost, Czitek developed the SurveyIR 5X microscope, significantly reducing the end-user cost over other systems. The people responsible for the development of this microscope include Gregg Ressler, the principal engineer for the Spectra Tech IR-Plan microscopes, and David Schiering, who was involved in the development of the Perkin Elmer microscopes of the early 1990s. The SurveyIR 5X can be placed directly into the sample compartment of an FTIR and employs either the standard instrument mounted DTGS detector or a liquid-nitrogen-cooled mercury cadmium telluride (MCT) detector. The sampling modes include infrared transmission, reflection, and ATR, along with transmission, reflection, and oblique white light illumination with image capture. We illustrate the use of this microscope by evaluating its signal-to-noise performance relative to a high-end microscope and its ability to characterize small particle contaminants.
Materials and Methods
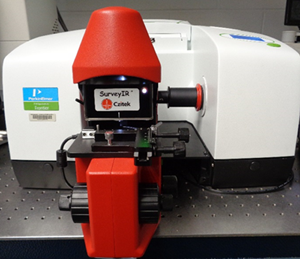
All spectra were collected using a SurveyIR 5X microscope accessory produced by Czitek interfaced to a Perkin Elmer Frontier FTIR. Detectors used in the evaluation included the standard DTGS detector and a liquid-nitrogen-cooled MCT detector. ATR measurements were made using the diamond internal reflection element (IRE) integral to the microscope. A photograph of the instrument is shown in Figure 5. The fiber samples, previously described by Bouffard et al., were mounted on a low-E slide for analysis [Reference Bouffard12]. Spectra of the fibers collected with the MCT detector represent the average of 60 individual scans using a spectral resolution of 4 wavenumbers.

Figure 5: Photograph of the SurveyIR 5X in the sample compartment of the Frontier FTIR.
Results and Discussion
One of the most important characteristics of any microscope is the ability to view and image the sample at high magnification for proper photo-documentation and color representation. The microscope has three different optical illumination modes that include transmission, reflection, and oblique illumination. Figure 6 illustrates three different colored fibers (approximately 50 micrometers in diameter) with colorant loadings of 5% by weight using transmission, reflection, and oblique illumination.

Figure 6: Three different colored fibers viewed in transmission, reflection, and oblique illumination modes (left to right, respectively).
In order to obtain infrared transmission spectra that are photo-metrically correct (that is, a spectrum in which the absorptions are not totally absorbing), one usually needs to flatten the sample. This requirement arises from the fact that the path length of light through the sample is approximately the same as the sample thickness. In general, a sample thickness of less than 6 micrometers yields spectra in which the strongest feature does not extend below 20% transmittance. A means to overcome this sample preparation requirement is to collect the spectrum using an ATR accessory where the path length through the sample is limited to the penetration depth. This depth, which can be calculated from known parameters, is on the order of a few micrometers across the infrared spectrum. Avoidance of sample preparation is one of the major reasons why ATR spectroscopy dominates the way infrared spectra are collected today.
In addition to transmission and reflection infrared modes, the microscope also has an ATR mode in which optical viewing takes place through a diamond IRE. Figure 7 (left) illustrates the same three fibers shown in Figure 6 but now viewed through the diamond IRE using oblique optical illumination. Figure 7 (right) also illustrates the fibers after contact has been made with the IRE. This later image was obtained in transmission optical illumination mode and illustrates the sample flattening and area increase on contact with the diamond IRE, as well as the high image quality that SurveyIR 5X delivers in multiple illumination modes.

Figure 7: Images obtained in oblique illumination through the IRE (left) and in transmission after contact with the IRE (right).
The performance of the SurveyIR 5X microscope was assessed both qualitatively and quantitatively by collecting 100% transmission spectra, which represent the noise uncertainty in a measurement, and transmission spectra of a reference polystyrene film. Spectra were collected by co-adding 4 individual scans at 4 cm−1 spectral resolution using the internal DTGS detector of the interferometer. The microscope has an internal remote aperture wheel with selectable apertures that correlate to sample sizes of 60, 100, 160, 200, 250, and 2000 micrometers in diameter. The SNRs associated with particular sample sizes were determined by generating a 100% transmission spectrum and calculating the peak-to-peak noise over the range of 2800 to 2400 cm−1. The peak-to-peak noise was then divided into 100 to give the SNR. Figure 8 illustrates a graph of SNR plotted against aperture size. The black data points relate to the experimental results, and the blue data points represent theoretical calculations. The theoretical values were normalized to the SNR experimentally obtained for the 60-micrometer-diameter aperture. This normalization was done for subsequent aperture sizes by multiplying the SNR value of the 60-micrometer aperture to the ratio of the cross-sectional area of a larger aperture to that of the 60-micrometer-diameter aperture. The results show a reasonable correlation between the experimental results and what would be expected for the increased throughput. In addition, the SNR for the 160-micrometer aperture (sample size) approaches 60, which is more than acceptable for qualitative identification (see below).

Figure 8: SNR versus aperture size for the microscope, experimental transmission (black), theoretical (blue).
The performance of the microscope from a qualitative perspective can be observed in Figure 9, which illustrates spectra of a reference polystyrene film collected using the 60-, 160-, and 250-micrometer-diameter apertures, top to bottom, respectively. In all cases, the SNR is more than sufficient for unknown identification analyses, even when the DTGS detector is used.

Figure 9: Transmission spectra of a reference polystyrene film collected using 60 (top), 160 (middle), and 250 (bottom) micrometer aperture sizes, 4 co-adds, 4 cm−1 resolution.
The quantitative capability of the microscope was evaluated by studying colored fibers in which the colorant concentration ranged from 1% by weight to 10% by weight. Bouffard et al. previously used transmission infrared microspectrosopy to study yellow, blue, and red pigments added into polypropylene fibers [Reference Bouffard12]. In this work, the authors used a Perkin-Elmer Model 1600 FTIR spectrometer equipped with a Perkin-Elmer FTIR microscope and an MCT detector. The authors were able to identify all three pigments and quantify the concentration of the yellow and red pigments down to 1%w/w and the blue pigment down to 2%w/w. This work was successfully reproduced using the same polypropylene fibers using the ATR feature of the SurveyIR 5X microscope as a proof of concept for the accessory.
ATR spectra of fibers loaded with 1, 2, 5, and 10% (w/w) of red, blue, and yellow pigments were collected, and an absorbance band ratio method was used for quantification with a polypropylene band acting as an internal standard. Quantification of the colorant was performed by using the peak area of an absorbance characteristic of the colorant and that from the polypropylene fiber itself [Reference Hirt13]. The control band (internal standard) was the polypropylene absorption at 1377 cm−1 corresponding to the symmetric methyl bending motion. Strong bands resulting solely from each of the three pigments in the fibers were then selected for quantification (Figure 10).

Figure 10: Reference spectra of the fibers at 10% colorant loading. Arrows indicate the spectral range used for determination of the peak areas.
Table 1 lists the results for each of the colored fibers along with the relative standard deviation for each concentration and the sensitivity and correlation coefficient for the associated calibration curve.
Table 1: Band ratio, relative standard deviation (RSD) sensitivity, and correlation coefficients (R2) for each of the fiber sets.

The uncertainty in the band ratios reflects the error in the method and the variability of the dye along and between fibers. Five measurements were made along 3 individual fibers for each fiber color and concentration. As expected the error (percent relative standard deviation [RSD]) decreases as the concentration of the colorant increases. The sensitivity of the method for each fiber is similar, and the correlation is very good.
Conclusion
In conclusion we have demonstrated the use of a new low-cost infrared microscope possessing many of the capabilities of high-priced systems. Technological advances in audio-digital technology and digital cameras have improved the performance of infrared microscopes such that analysis of samples as small as 60 micrometers are now routine.
Acknowledgements
The authors would like to thank Dr. Robert Price, editor of Microscopy Today, for his helpful comments and edits regarding this manuscript.


