


Nutritional epidemiology has traditionally focused on single nutrients and foods, but a complementary focus is on dietary patterns( Reference Hu 1 ). Dietary patterns as well as food groups have been linked to chronic diseases such as depression( Reference Sánchez-Villegas and Martínez-González 2 ). Reviews and meta-analyses on dietary patterns concluded that there seems to be a protective effect of ‘healthy’, ‘traditional’ and ‘Mediterranean’ dietary patterns, whereas a ‘Western’ dietary pattern may be associated with an increased risk of depression; however, they all emphasised that evidence for a true causal association is not yet conclusive, as findings were not consistent and residual confounding can still be present( Reference Lai, Hiles and Bisquera 3 – Reference Molendijk, Molero and Ortuno Sanchez-Pedreno 7 ). One of the reasons for the inconsistencies is the differences between studies on the used or derived dietary patterns and thus in the included components of these patterns. So by studying a priori and a posteriori patterns, it remains unknown which component(s) of the pattern are associated with health. It is therefore of interest to study these individual components, which are mostly food groups. Food groups can also be useful for communication in public health, and many dietary guidelines are food based( Reference Montagnese, Santarpia and Buonifacio 8 , Reference Gibney and Sandström 9 ).
Reviews and meta-analyses regarding food groups as determinant( Reference Molendijk, Molero and Ortuno Sanchez-Pedreno 7 , Reference Murakami and Sasaki 10 , Reference Sanhueza, Ryan and Foxcroft 11 ) – including fruit and vegetables( Reference Liu, Yan and Li 12 , Reference Saghafian, Malmir and Saneei 13 ), fish( Reference Li, Liu and Zhang 14 , Reference Grosso, Micek and Marventano 15 ) and coffee and tea( Reference Grosso, Micek and Castellano 16 ) – indicated some associations with depression as outcome, but their findings are inconsistent, potentially due to the limitations of the included individual studies. One of the limitations of many previous studies on diet and depression is their cross-sectional design. Although there are prospective studies on the link between food groups and depressive symptoms at follow-up measurements, they often only used dietary information at baseline, assuming no changes in diet over time. To our knowledge, a few previous cohort studies used repeated measurements of dietary intake as determinant. Their repeated food group measurements were the average consumption at baseline and follow-up( Reference Smith, Sanderson and McNaughton 17 , Reference Matsuoka, Sawada and Mimura 18 ), cumulative average of two time points( Reference Sánchez-Villegas, Zazpe and Santiago 19 ) or a categorical variable based on baseline consumption and 2-year change in consumption( Reference Sánchez-Villegas, Henríquez and Figueiras 20 ). Besides only three studies used longitudinal statistical methods to capture the repeated measurements of the exposure (i.e. food group) and found some prospective associations with incident depression outcomes for lower intakes at several measurements of fruit (but not vegetables)( Reference Mihrshahi, Dobson and Mishra 21 ), fruit and vegetables combined (unadjusted for other lifestyle factors)( Reference Kingsbury, Dupuis and Jacka 22 ), and higher intake of sugar in men only( Reference Knüppel, Shipley and Llewellyn 23 ).
The link between diet and depression may also exist in the other direction, that is, depressive symptoms may cause a change in the intake of food groups (‘reverse causality’). Some studies have investigated the association of depression with food groups, dietary patterns and nutrients in this direction, but the majority of these studies were cross-sectional( Reference Appelhans, Whited and Schneider 24 – Reference Whitaker, Sharpe and Wilcox 26 ) or used retrospective depression data( Reference Jacka, Cherbuin and Anstey 27 ). A total of three recent prospective studies also examined the reverse association and found depression to be associated with a lower fruit and vegetable intake (combined) (unadjusted for other lifestyle factors)( Reference Kingsbury, Dupuis and Jacka 22 ) but not with fish intake( Reference Smith, Sanderson and McNaughton 17 ) or sugar intake from sweet food/beverages( Reference Knüppel, Shipley and Llewellyn 23 ). However, to our knowledge, no other previous studies investigated the association of depression with food groups longitudinally.
Given the inconclusive and incomplete literature about the association between food groups and depression, and its direction, more prospective studies on the bidirectional link between diet and depression are needed. Except Smith et al. ( Reference Smith, Sanderson and McNaughton 17 ), Kingsbury et al. ( Reference Kingsbury, Dupuis and Jacka 22 ) and Knüppel et al. ( Reference Knüppel, Shipley and Llewellyn 23 ), no study has investigated this link in both directions within one cohort, which can give insight into the reverse causality hypothesis. These studies, as well as most studies on food groups, however, examined just one or two food groups, which does not allow comparison of the effect sizes of the associations with depression between several food groups.
In the InCHIANTI study (Invecchiare in Chianti, aging in the Chianti area), the link between dietary patterns and depressive symptoms has previously been studied. A Tuscan pattern at baseline derived by reduced rank regression (RRR) was cross sectionally and prospectively inversely associated with depressive symptoms( Reference Vermeulen, Stronks and Visser 28 ). However, two inflammatory dietary patterns at baseline – derived by RRR and characterised by unhealthy foods – were not prospectively associated with depressive symptoms( Reference Vermeulen, Brouwer and Stronks 29 ). We aim to extend this previous work by studying the individual components of these dietary patterns, that is, food groups. In addition, we use dietary data not only at baseline but also at follow-up measurements, and we address the relationship in two directions. The aims of this study were to study the prospective associations (1) between intake of food groups and change in depressive symptoms and (2) between depressive symptoms and changes in intake of food groups, in a large sample of Italian (older) adults.
Methods
Study population
The InCHIANTI study is a prospective, population-based cohort study of older adults in Tuscany (Italy) and was originally designed to examine factors that contribute to decline in mobility. In 1998–2000, a sample of 1453 persons was randomly recruited at two sites (Greve in Chianti and Bagno a Ripoli) using a multistage, stratified sampling method. A total of 1155 participants were aged 65–102 years, with those aged ≥90 years oversampled, and 298 participants were aged 20–64 years. Baseline data were collected in a home interview and a medical evaluation at the study clinic. Follow-up measurements were performed 3, 6 and 9 years after baseline (respectively, 2001–2003, 2004–2006 and 2007–2009). A more detailed description of the study rationale, design and method is given elsewhere( Reference Ferrucci, Bandinelli and Benvenuti 30 ). All participants signed informed consent after full explanation of procedures, and the ethics committee of the Italian National Institute of Research and Care on Aging approved the study protocol.
Participants
A total of 1206 persons had dietary data at baseline and at least at one of the three follow-up measurements. Persons with no or incomplete data on depressive symptoms at baseline or at any follow-up measurement were excluded (n 69). After exclusion of persons with missing data on baseline covariates (on physical activity (n 6) and waist circumference (n 73)), the analytic sample consisted of 1058 persons.
Depression measurements
At baseline and follow-up home visits, depressive symptoms were assessed with the Center for Epidemiologic Studies Depression scale (CES-D), a twenty-item self-report scale about depressive symptoms in the past week( Reference Radloff 31 ). The CES-D, ranging from 0 to 60 points, is widely used and has been shown to be a valid instrument for assessing depressive symptoms in older adults( Reference Beekman, Deeg and Van Limbeek 32 ) and in Italian adults( Reference Fava 33 ). The continuous CES-D scores were used as outcome or determinant in the associations, and the cut-off score of ≥20 was used to indicate clinically relevant depressive symptoms for descriptive purposes. Although a cut-off of 16 is generally used, a higher cut-off has a greater specificity( Reference Beekman, Deeg and Van Limbeek 32 ) and seems to be more appropriate in Italian samples( Reference Fava 33 ).
Dietary measurements
At baseline and follow-up home visits, the usual dietary intake was assessed using the FFQ developed for the North-Central Italy centres( Reference Pala, Sieri and Palli 34 ) of the European Prospective Investigation into Cancer and nutrition study( Reference Riboli, Hunt and Slimani 35 ). This 240-item FFQ on food consumption during the previous year has been validated for these centres( Reference Pisani, Faggiano and Krogh 36 ) as well as for the InCHIANTI cohort at population level( Reference Bartali, Turrini and Salvini 37 ). Nutrient data were calculated using the Food Composition Database for Epidemiological Studies in Italy( Reference Salvini, Parpinel and Gnagnarella 38 ). Based on the FFQ data obtained, thirteen food groups were a priori created: fruit, vegetables, nuts and legumes, potatoes, wholegrain bread, dairy products, red and processed meat, fish and shellfish, olive oil, savoury snacks, sweet foods, sugar-sweetened beverages and fruit juices (SSB) and coffee and tea (online Supplementary Table S1). The selection of food groups was based on the fact that these are common components of diet-quality indices such as the Mediterranean Diet score, Alternative Healthy Eating Index and Dietary Approaches to Stop Hypertension Diet, or as previous studies on the depression–diet link suggested a link between the food group and depression (savoury snacks, sweet foods, coffee and tea)( Reference Grosso, Micek and Castellano 16 , Reference Sánchez-Villegas, Zazpe and Santiago 19 , Reference Knüppel, Shipley and Llewellyn 23 , Reference Jeffery, Linde and Simon 25 , Reference Konttinen, Männistö and Sarlio-Lähteenkorva 39 – Reference Sánchez-Villegas, Toledo and de Irala 41 ). Intake in g/d of each food group was calculated. Although the FFQ at the follow-up measurements differed somewhat from the FFQ at baseline, the food items included in the thirteen food groups were similar. The only considerable difference is that the items ‘fruiting vegetables’ and ‘tomato sauce’ in the baseline FFQ were redefined as ‘tomatoes raw’, ‘tomatoes cooked’ and ‘other fruiting vegetables’ in the follow-up FFQ.
Other variables
Data on potential confounders and variables used in sensitivity analyses were collected at the four measurements. Sociodemographic variables included age, sex, marital status (married, never married, widowed/divorced) and education level (years). Lifestyle factors included smoking status (never, former, current), alcohol intake (g/d; from the FFQ) and total energy intake (kJ/d and kcal/d, from the FFQ). In addition, physical activity level during the previous year was self-reported and classified as sedentary (hardly any physical activity or mostly sitting/some walking), light (light exercise 2–4 h/week) and moderate to intense (light physical activity >4 h/week, moderate physical activity >1 h/week or intense physical activity/intense walks many times/week). Instrumental activities of daily living (iADL) disabilities were defined as self-report of inability or needing personal help in performing any basic or iADL; the number of disabilities was dichotomised (0 = no, 1–8 = yes). At the study clinic, waist circumference (cm) was measured as well as body height and body weight that were used to calculate the BMI (kg/m2). Major diseases were ascertained according to standardised, pre-established criteria and algorithms based upon those used in the Women’s Health and Aging Study( Reference Guralnik, Fried and Simonsick 42 ) using information on self-reported history, pharmacological treatments, medical examination data and hospital discharge records. These diseases included hypertension, CHD including angina pectoris and myocardial infarction, congestive heart failure, stroke, peripheral arterial disease, cancer, diabetes mellitus, chronic obstructive pulmonary disease, and hip and knee arthritis. The number of chronic diseases was categorised into no, 1 or 2 or more diseases. General cognitive functioning was assessed with the Mini Mental State Examination (MMSE), ranging from 0 to 30 points( Reference Folstein, Folstein and McHugh 43 ). Use of antidepressants in the previous 2 weeks (yes/no) was coded according to the Anatomical Therapeutic Chemical classification system.
Statistical analyses
Baseline characteristics were described as means and standard deviations or medians and interquartile ranges and as percentages. Mean intakes of the food groups at baseline and at follow-up measurements were adjusted for energy intake, so that they are independent of total energy intake. This adjustment was performed using the residual method, where food group intakes are regressed on total energy intake( Reference Willett, Howe and Kushi 44 ). Presented mean intakes are thus the predicted values from this regression. Spearman correlation coefficients were calculated between the food group intakes. For wholegrain bread, savoury snacks and SSB, the number of consumers was small. Therefore, the intakes of these food groups were dichotomised as non-consumers v. consumers.
The prospective associations of food group intakes as determinant with change in depressive symptoms as outcome were analysed by linear mixed models (LMM), which account for dependency of repeated measurements within individuals. The assumption of conditional normality of CES-D scores was assessed by analysis of residuals. A time-lag model was chosen by including intakes at baseline, follow-up 1 and follow-up 2, and CES-D scores at follow-up 1, follow-up 2 and follow-up 3 (both time-varying), resulting in three 3-year cycles. Baseline CES-D score was included as covariate to interpret the regression coefficients as change compared with baseline. Initially, the models included a random intercept, and random slopes for food group intake were added to the model and tested for improvement in fit. However, likelihood ratio tests did not show statistically significant improvements (P <0·05) in fit for any food group, so the final models included only a random intercept. Standardised food group intake residuals were used as determinants to make comparisons between the food groups possible. Next to these continuous food group intake residuals, quartiles were made, with quartile 1 (lowest intake) serving as reference category. Quartiles of standardised intake residuals were defined for the four measurements, according to the distribution at baseline. To examine linear trends across the quartiles, the categorical quartile variable was used as a continuous variable to retrieve a P value for trend. For the three dichotomous food groups, the non-consumer group was used as the reference category.
Effect modification by age and sex was tested by adding interaction terms between the standardised food group intake residuals and age or sex to the regression models. A P value <0·10 of an interaction term was considered statistically significant. Potential confounders were added to the univariable models and included in the final models if regression coefficients changed >10 % in at least one of the food groups. The following three models were made: model 1 was adjusted for baseline CES-D score, age, sex, marital status and education level; model 2 was additionally adjusted for physical activity, smoking, iADL disabilities, alcohol intake and energy intake; and model 3 was additionally adjusted for waist circumference and number of chronic diseases (as these variables might be confounders but more probably mediators). All confounders were included as time-varying variables (baseline, follow-up 1 and follow-up 2), except age, sex and education level (baseline). The analyses were repeated and additionally adjusted for the intake of the other food groups in a separate model to examine the independent association of the food groups with depressive symptoms. Last, time (years after baseline) and interaction terms between food group intake and time were added to the models to examine whether the associations varied with time.
The prospective associations of depressive symptoms as determinant with changes in continuous food group intake as outcome were analysed by LMM. Standardised food group intakes were used, which were checked for normality. As seven food groups were skewed to the right, a natural log transformation was performed on the intake at each measurement, after a value of 1 was added to prevent zero intakes. The regression coefficients (B) and CI of the regression analyses were transformed back to obtain interpretable ratios (eB = ratio). These ratios reflect the percentage of change in the outcome (standardised food group intake) per one unit change in the determinant (continuous CES-D score). A 3-year time-lag model was used by including CES-D scores at baseline, follow-up 1 and follow-up 2, and food group intakes at follow-up 1, follow-up 2 and follow-up 3. Baseline intake was included as covariate, and models with only random intercepts showed the best fit. Standardised intakes were used as outcomes to be able to compare between the food groups. For the three food groups used as dichotomous variables, logistic generalised estimating equations (GEE) with a logit link function and an exchangeable correlation structure were used. GEE take into account the correlation between repeated measurements in the same individual and is a more valid method than logistic mixed models for binary outcomes( Reference Twisk, de Vente and Apeldoorn 45 ). Effect modification, time interaction and confounding were handled as described above. The following three models were made: model 1 was adjusted for the baseline food group intake, age, sex, marital status and education level; model 2 was additionally adjusted for physical activity, smoking, iADL disabilities, alcohol intake and number of chronic diseases (as these variables might be confounders and/or mediators); and model 3 was additionally adjusted for energy intake and waist circumference (to examine the influence of these variables separately).
A total of three sensitivity analyses were performed in the LMM and GEE analyses by the exclusion of specific subgroups: (1) participants using antidepressants at any measurement, (2) participants with an MMSE score <24 at any measurement (who may have memory problems), and (3) participants with an implausible energy intake (<2092 kJ (<500 kcal) or >14 644 kJ (>3500 kcal) for women and <3347·2 kJ (<800 kcal) or (>16 736 kJ (>4000 kcal) for men) at any measurement( Reference Willett 46 ).
SPSS version 23 (SPSS Inc.) was used for all analyses. P values ≤0·05 were considered statistically significant.
Results
Baseline characteristics
Characteristics of the participants (54·7 % women) are presented in Table 1. The mean age was 65·8 (sd 15·2) years, and 187 participants (17·7 %) experienced clinically relevant depressive symptoms (CES-D ≥20) at baseline. Comparison of included (n 1058) and excluded (n 395) participants showed that excluded participants were older (P <0·001), less often married (P <0·001), less educated (P <0·001), less physically active (P <0·001) and less often smokers (P = 0·021) compared with included participants. Excluded participants also had more iADL disabilities (P <0·001), lower intakes of alcohol (P <0·001) and energy (P <0·001), lower cognitive function (P <0·001) and more depressive symptoms (P <0·001). Regarding food group intakes, excluded participants had lower intakes of fruit, vegetables, potatoes, red and processed meat, fish and shellfish and olive oil, and they ate less often wholegrain bread and savoury snacks (all P <0·05). These differences were most pronounced at baseline and follow-up 1.
Table 1 Baseline characteristics of the Invecchiare in Chianti study sample (1998–2000, n 1058) (Mean values and standard deviations; numbers and percentages; medians and interquartile ranges (IQR))
iADL, instrumental activities of daily living; MMSE, Mini Mental State Examination; CES-D, Center for Epidemiologic Studies Depression scale.
Depressive symptoms and food group intakes over 9 years
Depressive symptoms and energy and food group intakes at the four measurements are shown in Table 2. Clinically relevant depressive symptoms ranged from 17·0 to 24·1 %. Total energy intake was highest after 3 years and lowest after 9 years. Energy-adjusted intakes of fruit, vegetables and olive oil decreased over time, while intakes of dairy products, fish and shellfish, and sweet foods increased, mainly between the 6- and 9-year measurements. Intakes of nuts and legumes, potatoes, red and processed meat, and coffee and tea were quite stable over time. For wholegrain bread, the percentage of consumers ranged over time from 12·7 to 25·0 %, and for savoury snacks, this was 28·5–47·2 %. SSB was consumed by about 50 % of the participants across measurements. In online Supplementary Table S2, the correlations between the continuous and dichotomous food groups are shown.
Table 2 Center for Epidemiologic Studies Depression scale (CES-D) scores and intakes of energy and food groups of the Invecchiare in Chianti study sample (n 1058) at baseline and follow-up measurements (Mean values and standard deviations; percentages)
* All predicted values are energy adjusted by regressing food group intake on total energy intake (the residual method).
Food groups as determinants of change in depressive symptoms
Results of the LMM analyses with food group intakes as determinants are shown in Table 3 and Fig. 1. No statistically significant associations were found after adjustment for confounders, except for two food groups. A positive association was found for the continuous standardised intake of sweet foods (B, model 2: 0·30, 95 % CI 0·02, 0·58), showing that a higher intake of sweet foods was associated with an increase in depressive symptoms 3 years later (Fig. 1). The highest quartile of sweet foods was also positively associated compared with the lowest quartile, and a trend across quartiles was observed (P for trend=0·016). For fish and shellfish, the highest quartile was associated with a subsequent decrease in depressive symptoms compared with the lowest quartile (B=–0·97, 95 % CI –1·74, –0·21), and a trend was observed (P for trend=0·016) (Table 3). Unexpectedly, quartile 2 of potatoes was associated with less depressive symptoms compared with quartile 1 (B, model 2: –0·75, 95 % CI –1·48, –0·02).
Table 3 Prospective associations of intakes of food groups (determinants) in relation to change in Center for Epidemiologic Studies Depression scale (CES-D) score (outcome) 3 years later in the Invecchiare in Chianti study (n 1058, 9-year follow-up with 2467 observations)* (Unstandardised regression coefficients and 95 % confidence intervals)
Ref., reference.
* Intake of food groups at baseline, follow-up 1 and follow-up 2, and CES-D scores at follow-up 1, 2 and 3.
† Model 1: adjusted for baseline CES-D score, age, sex, marital status and education level.
‡ Model 2: additionally adjusted for physical activity, smoking, instrumental activities of daily living disabilities, alcohol intake and energy intake.
§ Intake residuals are energy adjusted by regressing food group intake on total energy intake (the residual method).
|| Analysed with linear mixed models.
¶ Quartiles of the standardised intake residuals are based on the sample distribution at baseline.
** For sweet foods, there is a positive interaction with time, indicating that the association became stronger over time.
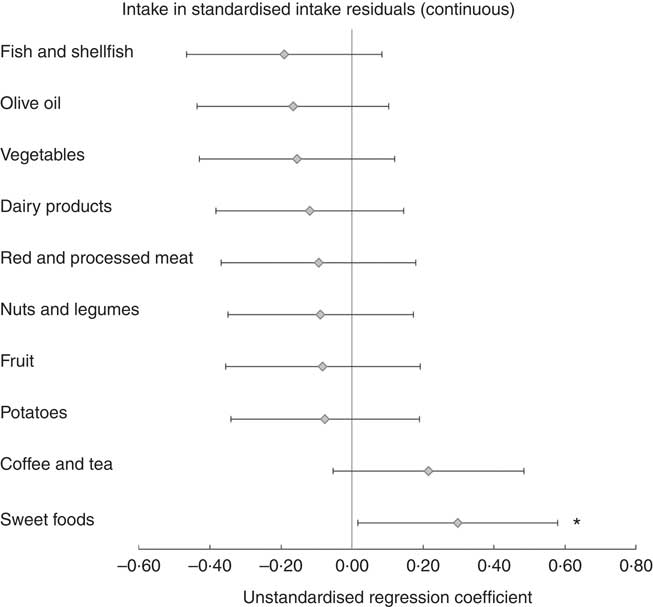
Fig. 1 Prospective associations of intake of food groups (determinants) in relation to change in Center for Epidemiologic Studies Depression scale (CES-D) score (outcome) 3 years later in the Invecchiare in Chianti study (n 1058, 9-year follow-up with 2467 observations). Intakes of food groups at baseline, follow-up 1 and follow-up 2, and CES-D scores at follow-up 1, 2 and 3. Intake residuals are energy adjusted by regressing food group intake on total energy intake (the residual method). Analysed with linear mixed models. Error bars indicate 95 % CI. Model 2 is shown: adjusted for baseline CES-D score, age, sex, marital status, education level, physical activity, smoking, iADL disabilities, alcohol intake and energy intake. For sweet foods, there is a positive interaction with time, indicating that the association became stronger over time. * P <0·05.
Additional adjustment for waist circumference and number of chronic diseases (model 3) did not change the findings. Significant interaction terms with sex were found for red and processed meat and with age for vegetables, nuts and legumes and SSB; however, after stratification by sex or the median of age, findings remained non-significant in all subgroups, and no clear trends were found (data not shown). For all continuous food groups, model 2 was additionally adjusted for the standardised intake residuals of the other nine continuous food groups; results did not change, except that the association of sweet foods attenuated (B = 0·19, 95 % CI –0·11, 0·50). For the food group quartiles, additional adjustment did not change the findings, indicating that the associations are independent. Similarly, a model including simultaneously the three dichotomous food groups also showed similar results. For sweet foods, a significant, positive interaction with time (P = 0·018 in model 2) was found, indicating that the association became stronger over time.
Depressive symptoms as determinant of change in food groups
Table 4 presents the results of the associations of depressive symptoms with change in food group intakes. The LMM analyses showed that a higher CES-D score was associated with 3-year decreases in intakes of red and processed meat (B model 2: –0·006, 95 % CI –0·010, –0·001) and vegetables (ratio: 0·995, 95 % CI 0·990, 0·999), and an increase in intake of dairy products (ratio: 1·008, 95 % CI 1·004, 1·013). The GEE analyses showed that a higher CES-D score was associated with a subsequent increase in odds of eating savoury snacks (OR: 1·012, 95 % CI 1·000, 1·024). No statistically significant associations with the other food groups were found.
Table 4 Prospective associations of Center for Epidemiologic Studies Depression scale (CES-D) score (determinant) in relation to change in (log-transformed) intakes of food groups (outcomes) 3 years later in the Invecchiare in Chianti study (n 1058, 9-year follow-up with 2489 observations)* (Unstandardised regression coefficients, ratios, odds ratios and 95 % confidence intervals)
* CES-D scores at baseline, follow-up 1 and follow-up 2, and intake of food groups at follow-up 1, 2 and 3.
† Model 1: adjusted for standardised (and log-transformed) baseline food group intake, age, sex, marital status and education level.
‡ Model 2: additionally adjusted for physical activity, smoking, instrumental activities of daily living disabilities, alcohol intake and number of chronic diseases.
§ Analysed with linear mixed models.
|| The ratios reflect the percentage of change in the outcome (standardised food group intake) per one unit change in the determinant (CES-D score).
¶ Analysed with generalised estimating equations.
Additional adjustment for energy intake and waist circumference (model 3, observations = 2260) did not change the findings; only the association with savoury snacks was slightly attenuated (OR: 1·011, 95 % CI 0·999, 1·024). Significant interaction terms with sex were found for coffee and tea and with age for vegetables, wholegrain bread, savoury snacks and SSB. After stratification by sex, still no significant associations with coffee and tea were found in men and women in model 2. Stratification by the median of age showed the same results for the mentioned food groups, except for vegetables: depressive symptoms were significantly inversely associated in older participants (those >69 years, ratio: 0·993, 95 % CI 0·987, 1·000) but not in younger participants (0·996, 95 % CI 0·990, 1·002). Interactions with time were not significant in any of the food groups.
Sensitivity analyses
Findings of the food group intake–depressive symptoms analyses did not change when participants who had an implausible energy intake (n 36, observations = 93) were excluded. However, the exclusion of participants who used antidepressants (n 226, observations = 673) did not influence the fish association but resulted in a significant inverse association for the highest quartile of vegetables (B model 2: –1·20, 95 % CI –2·12, –0·28), and the association of sweet foods disappeared (continuous B = 0·13, 95 % CI –0·19, 0·44). Similarly, exclusion of participants who had an MMSE score <24 (n 667, observations = 1021) did not influence the associations of fish and sweet foods but resulted in a significant inverse association for the highest vegetable quartile (B = –1·43, 95 % CI –2·44, –0·43).
For the depressive symptoms–food group intake analyses, exclusion of participants who had an implausible energy intake (n 36, observations = 94) did not change the findings. Further, exclusion of participants who used antidepressants (n 226, observations = 701) attenuated the associations of red and processed meat (B model 2: –0·004, 95 % CI –0·009, 0·002), vegetables (ratio: 0·997, 95 % CI 0·992, 1·003) and savoury snacks (OR: 1·011, 95 % CI 0·997, 1·025). Similarly, exclusion of participants who had an MMSE score <24 (n 667, observations = 1062) led to statistically not significant associations of red and processed meat and vegetables.
Discussion
In this study, the bidirectional, prospective associations between thirteen food groups and depressive symptoms were investigated in 3-year intervals over a 9-year period. A high intake of fish and shellfish was prospectively associated with a decrease in depressive symptoms 3 years later, while a high intake of sweet foods was associated with an increase in depressive symptoms. In the other direction, more depressive symptoms were associated with subsequent decreases in the intakes of red and processed meat and vegetables, and increases in the intakes of dairy products and savoury snacks. For the other food groups, no associations were observed in either direction.
Associations were found in both directions; however, no food group had associations in both directions, which implies that reverse causality is not the reason for the observed associations in either direction. For example, the increase in depressive symptoms over 3 years in persons with a high sweet food intake is not due to the potential higher susceptibility to depression of these persons; this higher susceptibility could have led, already at baseline, to a higher sweet food intake. As we found no association of depressive symptoms with change in sweet food intake over time, there is no support for the reverse causality hypothesis. Besides we shaped the analyses in a ‘prospective’ way using a 3-year time-lag model and by adjustment for the outcome at baseline, thereby minimising the issue of ‘cause or consequence’. So our prospective, bidirectional design made it possible to adequately investigate reverse causality; however, randomised controlled trials are needed to determine true causal relationships between food groups and depression. Prevention trials have not yet been performed, but two recent Australian treatment trials showed – in depressed adults – that dietary improvements had positive effects on mental health outcomes, including depression symptomatology. However, these trials had quite small samples (67 and 152 participants enroled) and did not primarily focus on food groups but on a Mediterranean-style diet, and its findings cannot be generalised to a more general population sample( Reference Jacka, O’Neil and Opie 47 , Reference Parletta, Zarnowiecki and Cho 48 ).
The associations of fish and sweet foods with depressive symptoms were strongest for the highest intake quartiles, while the middle quartiles had comparable regression coefficients. This seems to indicate a non-linear association for both food groups, as shown before for fish( Reference Matsuoka, Sawada and Mimura 18 , Reference Sánchez-Villegas, Henríquez and Figueiras 20 ). Energy-adjusted intakes of fish and shellfish of more than 28·0 g/d (Q4: >0·44 standardised residuals=>8·2 residuals=>28·0 g/d predicted value) and of sweet foods of more than 83·1 g/d (Q4: >0·43 standardised residuals=>20·1 residuals=>83·1 g/d predicted value) were associated with about one-point decrease and increase in CES-D score, respectively. All other food groups had regression coefficients of smaller sizes (non-significant), except for Q2 of potatoes. As there was no trend for the latter, this may represent a chance finding, potentially due to multiple testing. In the other direction, a one-point increase in CES-D score was associated with a reduced red and processed meat intake of 0·24 g/d (regression coefficient: –0·006 standardised intake=–0·006✕41·2 = 0·24 g/d) and with a 0·8 % increased dairy product intake (ratio: 1·008 = increase of 0·8 %). So these effect sizes are relatively small. As we also did not adjust for multiple testing, our findings need to be interpreted with caution.
Another reason to be cautious is that our sensitivity analyses showed that some associations were not that robust. Exclusion of antidepressant users (n 226) made the association of sweet foods with depressive symptoms disappear. This might indicate that the positive sweet food association is mainly driven by those with more severe depression (who used antidepressants). In contrast, an inverse association of vegetables appeared, indicating that a high vegetable intake might lead to less depressive symptoms only in mentally healthy persons. Such beneficial association of vegetables has been shown in recent meta-analyses( Reference Molendijk, Molero and Ortuno Sanchez-Pedreno 7 , Reference Liu, Yan and Li 12 ). Nonetheless, the association of fish (quartile 4) remained significant. In the other direction, exclusion of antidepressant users (n 226) or participants with low-cognitive functioning (n 667) resulted in attenuation of the associations of depressive symptoms with red and processed meat, vegetables and savoury snacks. This might indicate that these associations mainly exist in persons with more severe depression or with low-cognitive functioning; however, a more plausible explanation for the attenuation is the smaller sample size that reduced the statistical power.
Our findings of the food group intake–depressive symptoms analyses are partly in line with previous studies. An inverse association between fish and depression risk has been described in recent meta-analyses of observational studies( Reference Molendijk, Molero and Ortuno Sanchez-Pedreno 7 , Reference Li, Liu and Zhang 14 , Reference Grosso, Micek and Marventano 15 ) as well as in prospective studies in, for example, older Japanese( Reference Matsuoka, Sawada and Mimura 18 ) and young Australian women( Reference Smith, Sanderson and McNaughton 17 ). A negative association between sweet foods and mood has also been found in prospective studies on commercial baked goods( Reference Sánchez-Villegas, Toledo and de Irala 41 ), sugar intake from sweet food/beverages( Reference Knüppel, Shipley and Llewellyn 23 ) and added sugars( Reference Sánchez-Villegas, Zazpe and Santiago 19 ). Both findings are according to the hypothesis that ‘healthy’ foods lead to less depressive symptoms and ‘unhealthy’ foods to more depressive symptoms. However, we found no association for intakes of the other food groups that have previously been related to (incident) depression, including fruit( Reference Liu, Yan and Li 12 , Reference Saghafian, Malmir and Saneei 13 , Reference Mihrshahi, Dobson and Mishra 21 , Reference Gangwisch, Hale and Garcia 49 – Reference Akbaraly, Sabia and Shipley 51 ), vegetables( Reference Molendijk, Molero and Ortuno Sanchez-Pedreno 7 , Reference Liu, Yan and Li 12 , Reference Saghafian, Malmir and Saneei 13 , Reference Gangwisch, Hale and Garcia 49 , Reference Akbaraly, Sabia and Shipley 51 , Reference Tsai, Chang and Chi 52 ), legumes( Reference Sánchez-Villegas, Delgado-Rodriguez and Alonso 50 ), meat( Reference Sánchez-Villegas, Delgado-Rodriguez and Alonso 50 ), grains( Reference Gangwisch, Hale and Garcia 49 ), dairy products( Reference Sánchez-Villegas, Delgado-Rodriguez and Alonso 50 , Reference Pasco, Williams and Brennan-Olsen 53 , Reference Perez-Cornago, Sanchez-Villegas and Bes-Rastrollo 54 ) and coffee and tea( Reference Grosso, Micek and Castellano 16 , Reference Guo, Park and Freedman 40 ). It might be that for Italian older adults, other factors, such as sleep, socio-economic status, negative life events, social network or comorbidities( Reference Djernes 55 – Reference Lopresti, Hood and Drummond 57 ), are more important risk factors for depression than these food groups, or that fish and sweet foods are key food groups that influence mood over time.
Two previous studies have been performed within InCHIANTI, using food intake data as determinant of depressive symptoms over time. Prospective associations have been shown between a Tuscan dietary pattern – characterised by vegetables, olive oil, fish, fruits, grains, potatoes, red and processed meat – and depressive symptoms( Reference Vermeulen, Stronks and Visser 28 ) but not between two inflammatory patterns and depressive symptoms( Reference Vermeulen, Brouwer and Stronks 29 ). These patterns were only measured at baseline, whereas we used intake data from baseline and after 3 and 6 years. Changes in food group intake over time thus seem to be important as we found no association between most Mediterranean food groups and depressive symptoms, except for fish. Similar to the unhealthy, inflammatory patterns, we found no association of unhealthy food groups with depressive symptoms, except for sweet foods. Vermeulen et al. ( Reference Vermeulen, Brouwer and Stronks 29 ) focused on patterns – reflecting a mix of diverse food items – rather than single food groups, which may explain why they did not show this association. Also, they excluded participants aged <65 years, while we included these younger participants, resulting in a more varied dietary intake. So our study on food groups complements those of Vermeulen et al. ( Reference Vermeulen, Stronks and Visser 28 , Reference Vermeulen, Brouwer and Stronks 29 ) on dietary patterns.
In the other direction, only a few previous prospective studies have been performed. We did not find an association between depressive symptoms and change in sweet food intake, similar to Knüppel et al. ( Reference Knüppel, Shipley and Llewellyn 23 ). We also did not find an association with fish intake as an outcome, which is in line with Smith et al. ( Reference Smith, Sanderson and McNaughton 17 ), except that they showed a lower fish intake after 5 years in young women with a recent depression episode. The association of depression with fruit and vegetable intake (combined) was shown to be complex, since adjustment for lifestyle confounders (smoking, physical activity) attenuated the association in Canadian adults( Reference Kingsbury, Dupuis and Jacka 22 ); however, we investigated fruit and vegetables separately and found only an inverse association of depressive symptoms with vegetable intake, even after adjustment for smoking and physical activity. A comparison of our findings with other previous studies on the depression–diet link is rather difficult, since these studies were cross-sectional and did not investigate food groups comparable to ours( Reference Appelhans, Whited and Schneider 24 – Reference Whitaker, Sharpe and Wilcox 26 ).
Our finding that more depressive symptoms led to a higher consumption of savoury snacks is in line with the hypothesis that depressed persons may increase the consumption of less healthy (high-fat/salty) foods, owing to an increased appetite as in atypical depression( Reference Rahe, Baune and Unrath 58 ) or to a preference for consuming palatable ‘comfort foods’( Reference Singh 59 ). In contrast, the association of depressive symptoms with a decreased intake of both red and processed meat and vegetables may reflect a reduced energy intake in depressed persons; this can result from a decreased appetite, which is one of the symptoms of the melancholic type of depression( 60 , Reference Penninx, Milaneschi and Lamers 61 ) and common in older age (75 % of our study sample was aged ≥65 years)( Reference Donini, Savina and Cannella 62 ). However, more depressive symptoms were also associated with increased intakes of dairy products and savoury snacks in our study, so this reduced energy intake in depressed persons must have been food group-specific. The increased intake of dairy products might be explained by a preference of depressed persons for easy-to-prepare foods such as milk, yogurt and cheese( Reference Davison and Kaplan 63 ). Further, the null associations with intake of the other nine food groups might indicate that these food groups are not influenced by mood status.
Although the mechanistic understanding of the link between diet and depression is limited, several hypotheses exist. Diet influences physiologic processes, which consecutively influence development and progression of depression, such as neurotransmitter imbalances, neurogenesis and neuronal plasticity, oxidative stress and inflammation( Reference Lopresti, Hood and Drummond 57 ). Regarding our findings, the protective effect of fish may be attributable not only to its n-3 fatty acids but also to other nutrients such as vitamin D, vitamin B12, iodine and Se; all play a role in the mentioned processes( Reference Grosso, Galvano and Marventano 64 ). In the direction from depressive mood to diet, the underlying mechanisms might include sensory, physiological and psychological pathways( Reference Gibson 65 ). Stress can influence food intake via physiological effects that change appetite or other eating behaviours, and it can also change food choices in persons with specific psychological characteristics such as emotional eaters( Reference Gibson 65 ).
To our knowledge, this is the first study that investigated bidirectional associations between several food groups and depressive symptoms within one cohort. Most previous prospective studies investigated the unidirectional association from one food group to depression, and studies in the other direction – with several dietary aspects as outcomes – were cross-sectional( Reference Appelhans, Whited and Schneider 24 – Reference Whitaker, Sharpe and Wilcox 26 ). Another strength is the use of repeated measurements of outcome and determinant, that is, CES-D scores and food group intakes assessed four times over 9 years. Whereas previous diet–depression studies mostly used only baseline dietary data and assumed no changes over time, we took into account individual changes in food group intake over time using LMM. Furthermore, by using residual food group intakes as determinants and adjustment for energy intake, we were able to study the food group–depressive symptoms association independent of the energy intake. Finally, by studying food groups instead of dietary patterns or diet indices, we could identify the important components of these patterns/indices that have a link with depressive symptoms.
Several limitations need to be addressed as well. In this Italian study population, intakes of three food groups (wholegrain bread, savoury snacks and SSB) were very low, compared with intakes in studies that showed association of these groups( Reference Jeffery, Linde and Simon 25 , Reference Guo, Park and Freedman 40 , Reference Gangwisch, Hale and Garcia 49 ). Despite this small consumption range, we were able to pick up an association with savoury snacks as an outcome. Next, dietary data were derived by a self-reported FFQ: this assessment method, in combination with memory loss of the older participants, might lead to misreporting( Reference McNeill, Winter and Jia 66 ); however, underreporting in older persons might partly reflect a true low-energetic intake due to anorexia of ageing( Reference Shahar, Yu and Houston 67 ). Depressive symptoms were also self-reported without a clinical assessment of depression, whereas a meta-analysis showed that healthy patterns and food groups were not associated with a formal diagnosis of depression, only with self-reported depressive symptoms( Reference Molendijk, Molero and Ortuno Sanchez-Pedreno 7 ). However, the CES-D scale is a validated instrument that has shown good psychometric properties in an older population( Reference Beekman, Deeg and Van Limbeek 32 , Reference Fava 33 ). Furthermore, residual confounding might be present attributable to imperfectly/not measured confounders such as the socio-economic status. Last, loss to follow-up is a limitation; the more healthy participants were available for this longitudinal study, which might have resulted in a less representative sample. This selection bias may have attenuated or strengthened our associations.
In summary, our study in an Italian (older) population, including repeated assessments of food group intakes and depressive symptoms, suggests that high intakes of fish and sweet foods are associated with, respectively, a decrease and increase in depressive symptoms. In the other direction, more depressive symptoms are associated with decreased intakes of red and processed meat and vegetables, and increased intakes of dairy products and savoury snacks. This bidirectional, prospective study confirms some of the hypothesised links between food groups and mood but not all. A bidirectional association between diet in general and depression seems to exist but not for specific food groups. Longitudinal studies on the association from depression to food group intakes are scarce, showing the need for more research. Future experimental studies should investigate the effects of a change in the intake of specific food groups on depression. This knowledge might be needed for the prevention of depression and the optimal nutritional care of depressed persons.
Acknowledgements
The authors would like to thank the participants of the InCHIANTI study for their continuing contributions and all participating departments of the InCHIANTI team. In addition, the authors would like to thank Prof. Jos Twisk for his advice regarding the statistical analyses.
Funding for this paper was provided by the European Union FP7 MooDFOOD Project ‘Multi-country cOllaborative project on the rOle of Diet, FOod-related behaviour, and Obesity in the prevention of Depression’ (grant agreement no. 613598).
The InCHIANTI study baseline (1998–2000) was supported as a ‘targeted project’ (ICS110.1/RF97.71) by the Italian Ministry of Health and in part by the US National Institute on Aging (contracts: 263 MD 916413 and 263 MD 821336); the InCHIANTI follow-up 1 (2001–2003) was funded by the US National Institute on Aging (contracts: N.1-AG-1-1 and N.1-AG-1-2111); the InCHIANTI follow-ups 2 and 3 studies (2004–2010) were financed by the US National Institute on Aging (contract: N01-AG-5-0002); this research was supported in part by the Intramural Research Program of the National Institute on Aging, National Institutes of Health, Baltimore, Maryland.
The authors’ responsibilities were as follows: L. E. M. E., I. A. B. and M. V. formulated the research questions and designed the study. L. E. M. E. conducted the statistical analyses, interpreted the data and drafted the manuscript. M. V., B. W. J. H. P., M. C., S. B. and I. A. B. contributed to the interpretation of the data and critically revised the manuscript. All authors approved the final manuscript.
The authors declare that there are no conflicts of interest.
Supplementary material
For supplementary material/s referred to in this article, please visit https://doi.org/10.1017/S0007114518003203


