


In the international development context, nutritional issues, including micronutrient deficiency (“hidden hunger”), are one of the highest-priority global challenges and have been drawing concern in recent years. This study aimed to identify nutritional supply from the Food Balance Sheet (FBS) of the Food and Agriculture Organization, an open-access national database, in the case of Madagascar. Madagascar is one of the countries most severely struggling with malnutrition, with about half of all children aged <5 years showing stunted growth(1).
Nutrient supply was estimated from the 2009–2013 food supply data of FBS by assuming food items and converting them into nutrient amounts based on the nutrient contents in the food composition tables of the US Department of Agriculture, supplemented with the table of food composition used in Madagascar and the standard tables of the food composition in Japan. Nutrient requirement was calculated from the estimated average requirement (EAR) suggested by the Institute of Medicine, with adjustment of the population distribution obtained from the UN Dept. of Economic and Social Affairs, including age, sex, and pregnancy/lactation status.
First, we compared the averages of the selected nutrient supply and requirement (Fig. 1). The result implies deficiency of several micronutrients such as calcium (34%) and vitamin A (40%). Second, the population prevalence of inadequate nutrient intake was estimated by the EAR cut-point method (Fig. 2). Iron is not presented here, as the method is inappropriate owing to its asymmetrical requirement distribution(2). The intake distribution was assumed as log-normal for all micronutrients. Inter-individual coefficient variations were set for each nutrient by referring to a previous study, ranging from 0·25 to 1·75(Reference Beal, Massiot and Arsenault3). More than half of the population did not meet the intake requirements of many micronutrients; especially, calcium and vitamin A deficiencies are present in almost the entire population (100% and 98%, respectively).
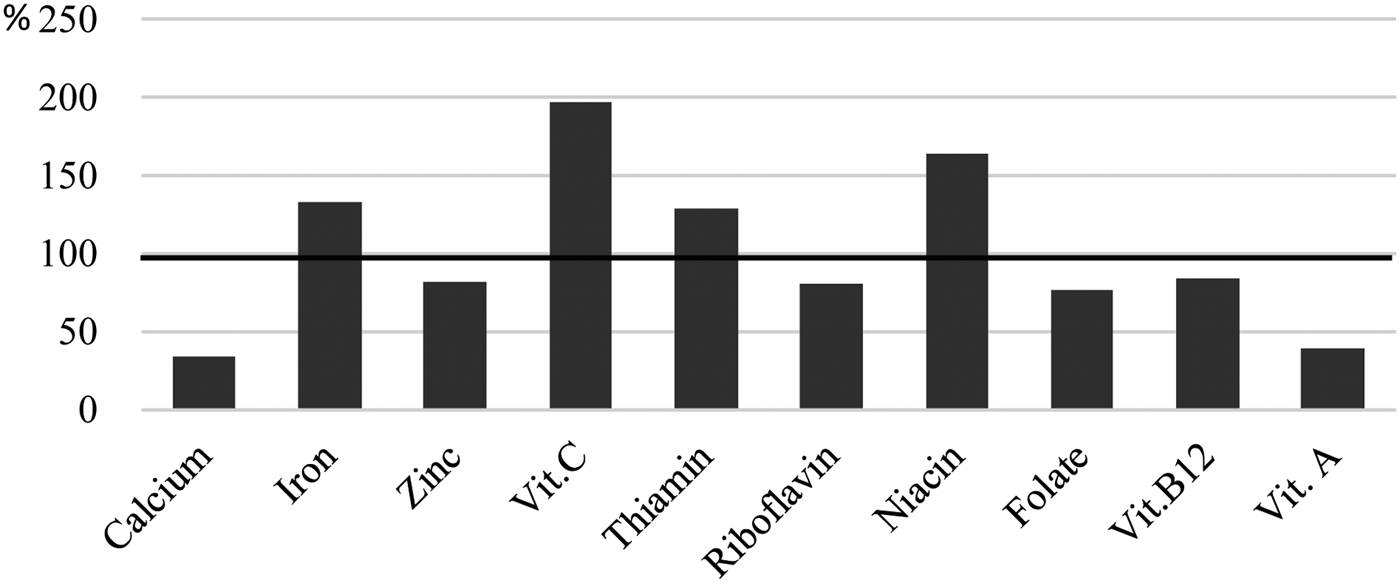
Fig. 1. Percentage of calculated mean daily nutrient supply per capita to the population-adjusted mean requirement
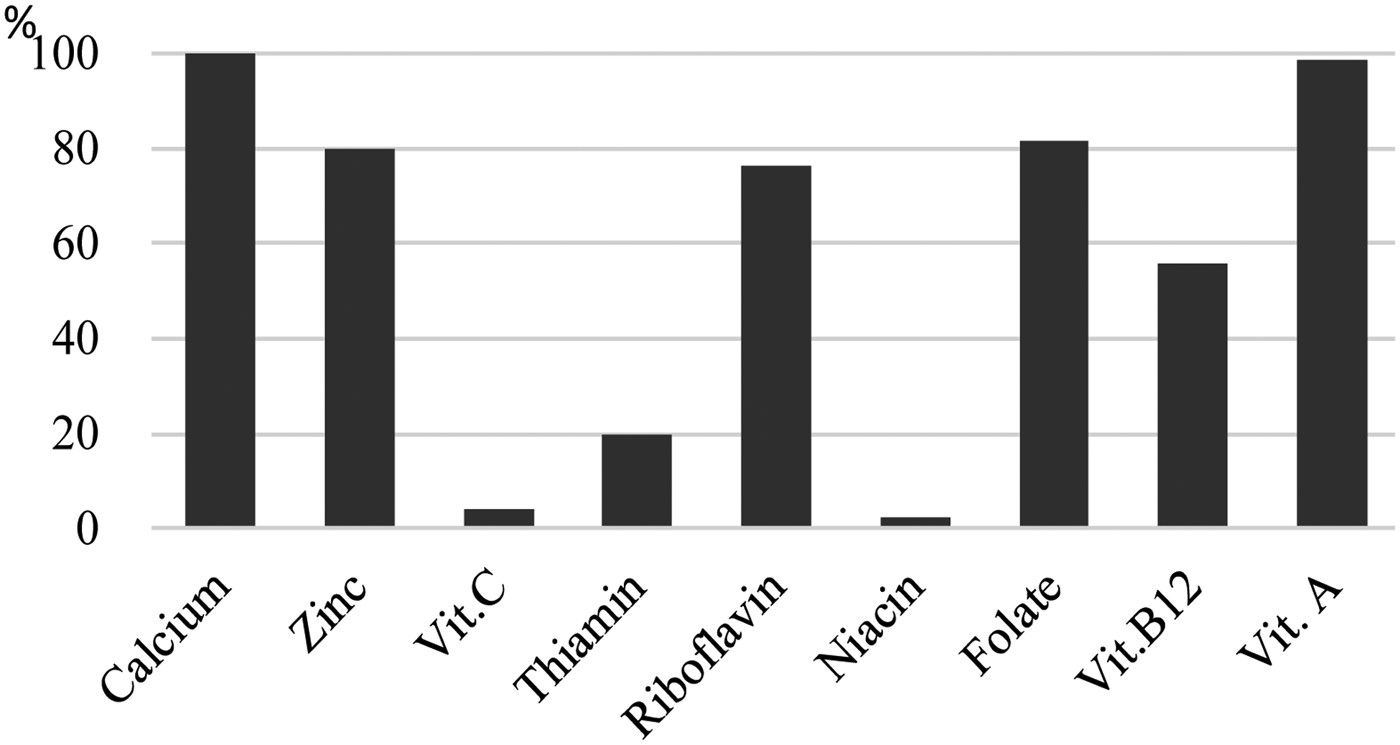
Fig. 2. Estimated population prevalence (%) of inadequate micronutrient intakes
Although using the FBS has some limitations such as its inability to consider seasonal, regional, or individual differences, it has the advantage of easy accessibility and is considered as an effective approach. This study could provide information on the lack of several nutrient supplies and prevalence of populations with inadequate micronutrient intakes in Madagascar.
This work was supported by JSPS KAKENHI Grant No. JP15K18752.


