


Introduction
Individuals in their natural environment can be exposed to and infected with a multitude of parasites, either sequentially or simultaneously (Pedersen and Fenton, Reference Pedersen and Fenton2007; Telfer et al., Reference Telfer, Birtles, Bennett, Lambin, Paterson and Begon2008), which can lead to within-host interactions between parasite species (Graham, Reference Graham2008; Seabloom et al., Reference Seabloom, Borer, Gross, Kendig, Lacroix, Mitchell, Mordecai and Power2015). While interactions between microparasites (bacteria, protozoa, viruses) and macroparasites (e.g. helminths) can positively and negatively impact the outcome of disease (Salgame et al., Reference Salgame, Yap and Gause2013), the direction of within-host interactions due to coinfection can be variable, resulting in both positive (facilitating) and negative (competitive) interactions. In addition, host demographic (e.g. sex, age, reproductive condition) and environmental variation can affect the strength and direction of parasite interactions (Moreno et al., Reference Moreno, Eberhardt, Lamattina, Previtali and Beldomenico2013; Gorsich et al., Reference Gorsich, Ezenwa and Jolles2014). Therefore, by developing an understanding of what determines the magnitude and direction of parasite interactions can help to alleviate host damage and guide new trajectories for improved treatment and control programmes (Pedersen and Fenton, Reference Pedersen and Fenton2007; Maizels et al., Reference Maizels, Hewitson, Murray, Harcus, Dayer, Filbey, Grainger, McSorley, Reynolds and Smith2012).
Most studies which have investigated both the mechanisms and health impacts of within-host parasite interactions have used highly controlled laboratory environments, mainly utilising inbred laboratory mice raised under standard pathogen-free conditions (Graham, Reference Graham2008; Knowles, Reference Knowles2011). However, several recent studies have highlighted the importance of making the laboratory mouse model better reflect natural systems by introducing wild mouse microbiomes (Rosshart et al., Reference Rosshart, Vassallo, Angeletti, Hutchinson, Morgan, Takeda, Hickman, McCulloch, Badger, Ajami, Trinchieri, de Villena, Yewdell and Rehermann2017), infection and coinfection (Maizels and Gause, Reference Maizels and Gause2014; Reese et al., Reference Reese, Bi, Kambal, Filali-Mouhim, Beura, Burger, Pulendran, Sekaly, Jameson, Masopust, Haining and Virgin2016) and by co-housing mice with pet-shop mice to allow exposure to pathogens and microbes (Beura et al., Reference Beura, Hamilton, Bi, Schenkel, Odumade, Casey, Thompson, Fraser, Rosato, Filali-Mouhim, Sekaly, Jenkins, Vezys, Haining, Jameson and Masopust2016). For example, Beura et al. (Reference Beura, Hamilton, Bi, Schenkel, Odumade, Casey, Thompson, Fraser, Rosato, Filali-Mouhim, Sekaly, Jenkins, Vezys, Haining, Jameson and Masopust2016) have shown that the immune cell composition of feral and pet-shop mice resembles that of human adults, whereas laboratory mice show very low levels of differentiated memory T-cells, similar to human neonates (Beura et al., Reference Beura, Hamilton, Bi, Schenkel, Odumade, Casey, Thompson, Fraser, Rosato, Filali-Mouhim, Sekaly, Jenkins, Vezys, Haining, Jameson and Masopust2016). As a result of the often unrealistic conditions used in laboratory studies, and the accompanying difficulty in translating these results to the real world, researchers have begun to investigate the underlying mechanisms of parasite within-host interactions in natural environments. These studies have helped unravel the natural conditions under which parasites interact and importantly what factors determine the impacts of these interactions on host health and disease (Ezenwa et al., Reference Ezenwa, Etienne, Luikart, Beja-Pereira and Jolles2010; Ezenwa and Jolles, Reference Ezenwa and Jolles2011; Turner et al., Reference Turner, Begon, Jackson, Bradley and Paterson2011; Friberg et al., Reference Friberg, Little, Ralli, Lowe, Hall, Jackson and Bradley2013; Knowles et al., Reference Knowles, Fenton, Petchey, Jones, Barber and Pedersen2013; Pedersen and Antonovics, Reference Pedersen and Antonovics2013). However, these studies are also not without limitations, as both the exposure and infection history of wild animals is not usually known, which leads to uncertainty in understanding the causal relationships between parasite infection/exposure and host characteristics such as an animal's immune phenotype (Abolins et al., Reference Abolins, Pocock, Hafalla, Riley and Viney2011). Further, wild animals often experience resource limitation at various times throughout their lives, which can potentially reduce their investment in specific aspects of their life-history, for example, in the development of their immune system (Tate and Graham, Reference Tate and Graham2015). To overcome the limitations of both laboratory and wild studies, and to better understand the causes and consequences of interactions between coinfecting parasites, field and laboratory approaches need to be better integrated.
Our previous field experiments revealed a negative interaction between two gastrointestinal parasites of wild wood mice (Apodemus sylvaticus), the nematode Heligmosomoides polygyrus and the coccidian microparasite Eimeria hungaryensis. We found that a single dose of the anthelmintic drug Ivermectin reduced H. polygyrus prevalence by 70%, but consequently led to a 15-fold increase in the burden of coinfecting E. hungaryensis 1–3 weeks post-treatment (Knowles et al., Reference Knowles, Fenton, Petchey, Jones, Barber and Pedersen2013). However, it is currently unknown whether this interaction is mediated by the host's immune system (specifically the protective effect of H. polygyrus towards E. hungaryensis), or via competition through shared host resources. Furthermore, we were previously not able to test for a reciprocal interaction of E. hungaryensis on H. polygyrus in the field due to difficulties in treating coccidia in the wild.
Here, we developed a wild-like laboratory system using laboratory-reared wood mice kept under standard laboratory conditions. This colony of wood mice was derived from wild-caught animals collected from woodlands near Liverpool, UK, which were taken into captivity and purposefully outbred for many generations. In addition, we used parasite isolates of both H. polygyrus and E. hungaryensis that were collected for a Scottish wood mouse population. Together with the laboratory-kept wood mice, using these wild-derived parasite isolates means that here, we were able to overcome many of the limitations of both laboratory and wild studies. First, we performed a controlled laboratory experiment to test (i) the effect of infection and coinfection on helminth and coccidian shedding and burdens, (ii) the effect of coinfection on protective immunity against E. hungaryensis, and (iii) antibody responses during single and coinfection. Next, we made use of two independent field experiments using the same host and parasite species as in the laboratory experiment to directly compare antibody levels between laboratory-kept and wild wood mice and to assess how wild conditions, including frequent exposure to a diverse parasite community, impact antibody levels. To measure the host immune response following parasite infection, we measured H. polygyrus-specific IgG1 and total fecal IgA levels. We chose to focus on these antibody types because they are both important during infection and can be measured in our non-model species using laboratory mouse reagents. IgG1 is the main antibody class responsible for worm clearance and establishment of protective immunity (Reynolds et al., Reference Reynolds, Filbey and Maizels2012), whereas IgA is the main antibody class found at mucosal sites (Macpherson et al., Reference Macpherson, Geuking and McCoy2012) and has been found to have anti-schizont and sporozoite activity during Eimeria infections in chickens (Davis et al., Reference Davis, Parry and Porter1978; Trees et al., Reference Trees, Karim, Mckellar and Carter1989).
To our knowledge, this study represents a unique and novel experimental approach to investigate coinfection dynamics using a combination of a mammal host and both micro- and macroparasites, where both host and parasites were either directly wild-derived or the recent descendants of wild-derived animals. We believe that this novel approach may help bridge the current gap between wild and laboratory studies in understanding the causes and consequences of coinfection.
Methods
Mice
We used a colony of A. sylvaticus that was derived from wild-caught animals collected from a woodland in the Wirral, UK around 5 years ago. Since then, the wood mice have been kept in standard laboratory conditions and purposely outbred to retain as much genetic variability among animals as possible. The wood mouse colony is currently housed at the University of Edinburgh under standard laboratory conditions. For this experiment, we used 12 females and 12 males aged between 8 and 23 weeks (average 15 weeks ± 0.9 s.e.). Prior to the start of the experiment, mice were housed in single-sex groups of 2–5 animals. After the start of the experiment, mice were housed individually in individual ventilated cages (Techniplast®, 1285L), with standard mouse chow and water ad libitum.
Parasites
Transmission stages of the two parasite species used in this experiment (H. polygyrus L3 larvae and sporulated Eimeria spp. oocysts) were derived from feces collected from wild A. sylvaticus, trapped in September 2015 in a mixed woodland in Callendar park, Falkirk, UK (55.99°N, 3.77°W). To obtain H. polygyrus L3 larvae (the infective stage), we followed the protocol of Johnston et al. (Reference Johnston, Robertson, Harcus, Grainger, Coakley, Smyth, McSorley and Maizels2015) to hatch eggs from fecal material (Johnston et al., Reference Johnston, Robertson, Harcus, Grainger, Coakley, Smyth, McSorley and Maizels2015). In short, fecal samples were soaked in water to soften and then mixed with water-soaked charcoal (DARCO®, 20–40 mesh particle size, granular, 242 268), which acted as a substitute for soil. A small amount of the feces-charcoal mix was spread thinly on a damp filter paper (Whatman No. 40 Filter Paper circles, 1440055) in a plastic petri dish. These fecal cultures were placed in a plastic container layered with damp filter paper to create a humid environment, and stored in the dark at 17 °C. After ~5 days, larvae migrated away from the charcoal mix to the edge of the filter paper and into the petri dish. Once larvae appeared in the petri dish, the filter paper was lifted onto a new petri dish and the larvae left behind were collected by flushing with tap water, and stored at 4 °C. Fecal cultures were checked every 48 h for the presence of new larvae.
To extract Eimeria spp. oocysts from feces, we modified the method used by Ryley et al. (Reference Ryley, Meade, Hazelhurst and Robinson2009). In short, fecal samples were soaked in water to soften and spun down at 4200 rpm for 10 min and the supernatant was removed. A 20–30 mL saturated salt solution was added to the fecal material, and samples were shaken vigorously to break up the pellets and spun down at 4200 rpm for 10 min. The supernatant containing the oocysts was collected in a fresh tube and the salt concentration in the tube was decreased by adding at least an equal amount of tap water to each tube. In order to pellet the oocysts, samples were spun again at 4200 rpm for 10 min. The pelleted oocysts were then washed three times with water and kept in a 2% potassium dichromate (K₂Cr₂O₇) solution to prevent bacterial and fungal growth and stored at 4 °C.
After transmission stages of both parasites were isolated from wild wood mice, the isolates were screened using PCR diagnostics to ensure that no other known mouse parasites or pathogens contaminated the field isolates (IDEXX Bioresearch, Germany). To ensure infectivity and to accumulate enough transmission stages, both H. polygyrus larvae and Eimeria spp. oocysts were passaged three times through colony-housed A. sylvaticus. In the case of Eimeria spp., this allowed us to selectively passage oocysts that morphologically matched oocysts of E. hungaryensis. We henceforth refer to the Eimeria spp. isolate used in the experiment as E. hungaryensis, however molecular confirmation of its identity is pending.
Experimental design
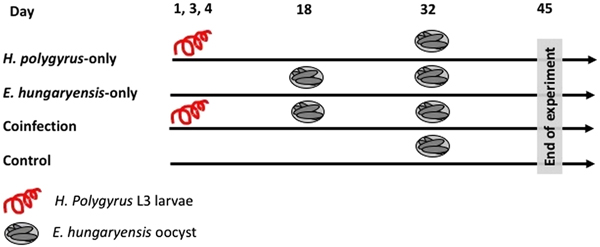
On day 1 we randomly allocated mice to the following treatment groups: H. polygyrus-only, E. hungaryensis-only, coinfection and uninfected controls (Fig. 1). Animals in the H. polygyrus-only and coinfection groups received a dose of 80 H. polygyrus L3 larvae in 200 µl water via oral gavage on days 1, 3 and 4 (total 240 L3 larvae), while E. hungaryensis-only and control groups received an equivalent dose of water on the same days. We used three infection doses because we were limited in the number of wild H. polygyrus larvae available; the larval concentration in our isolates was too low to administer the inoculation in a single dose, and we decided against trying to concentrate the inoculum further due to the risk of losing any larvae during this process.
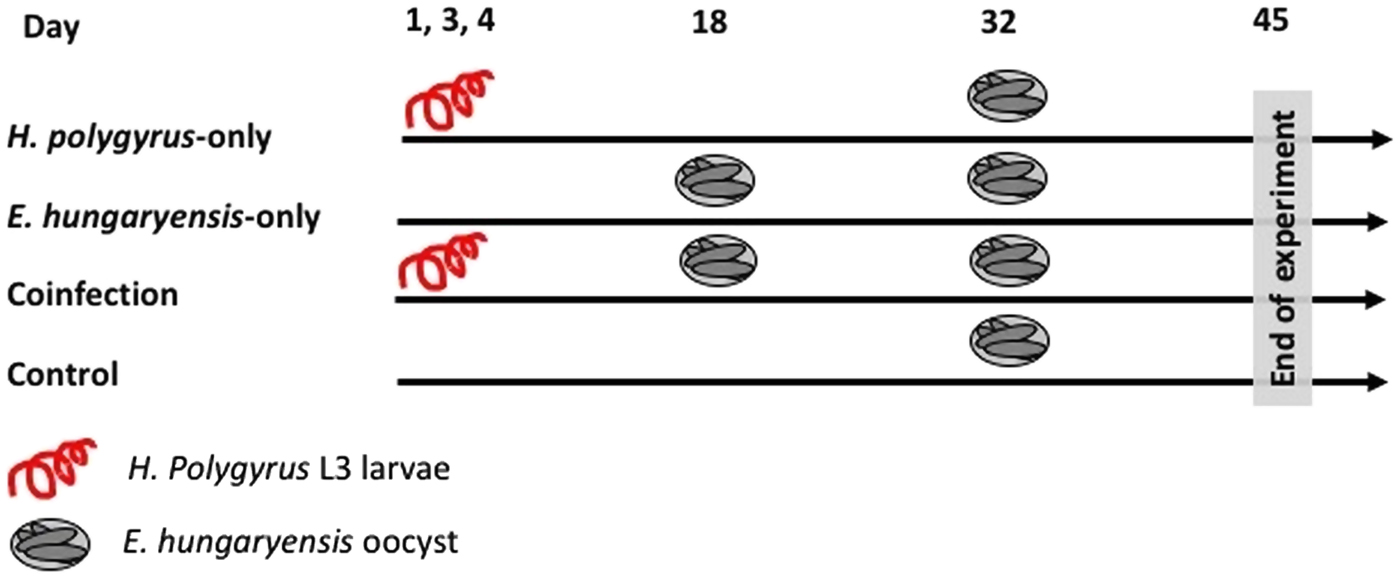
Fig. 1. Schematic representation of infection schedules for each treatment group. Parasite dose per single inoculum were 80 L3 larvae in 200 µL water for H. polygyrus, 500 sporulated oocysts in 200 µL water for E. hungaryensis, or 200 µL water without parasites.
On day 18, E. hungaryensis-only and coinfection groups received a single dose of 500 sporulated E. hungaryensis oocysts in 200 µL water via oral gavage, while H. polygyrus-only and control mice received an equivalent dose of water. On day 32, all groups were challenged with a dose of 500 sporulated E. hungaryensis oocysts (from the same starting inoculum) in 200 µl water via oral gavage. On day 45, all animals were culled using an overdose of CO2.
Over the course of the experiment, mice were sampled three times a week, starting on day 3. On each sampling occasion, we recorded body weight, took a small volume of host blood via tail bleed (2–10 µL) and collected a fresh fecal sample. The blood was spun at 12 000 rpm for 10 min and serum was stored at −20 °C. We collected 3–6 fecal pellets per mouse per sampling time point and these were dry frozen at −80 °C. The rest of the fecal pellets were weighed and stored in 10% buffered formalin at 4 °C to perform fecal egg counts by salt flotation (Dryden et al., Reference Dryden, Payne, Ridley and Smith2005) and microscopy. After animals were euthanized on day 45, the number and sex of all adult H. polygyrus worms in the small intestine was counted for each mouse. The experiment was conducted in two blocks (replicates), with three animals randomly assigned to each treatment group per block, giving a total of six mice per treatment group (three males and three females).
One mouse failed to become infected with E. hungaryensis after the first E. hungaryensis challenge, but was successfully infected after the second E. hungaryensis challenge. We excluded this animal from our analysis on E. hungaryensis dynamics since we do not know the reason for the failed first infection. Additionally, animals in the second block were given their first E. hungaryensis challenge on day 16 instead of day 18 by mistake. This meant that oocyst shedding started on day 19 in the first block and on day 17 in the second block. However, this had no influence on peak oocyst shedding or total oocyst shedding for the first challenge, as there was no significant effect of block in any of the statistical models (Table 1).
Table 1. Modelling results for H. polygyrus worm burdens at day 45, last day of egg shedding, peak egg shedding and total egg shedding (n = 12). Each column represents a single model, each row represents a model covariate
Each cell contains the covariate estimate and P value. Comparison levels for factors are given in brackets. Hp stands for H. polygyrus.
****P < 0.001, **P < 0.01, *P < 0.05, P < 0.1.
Immunological methods
To measure H. polygyrus-specific IgG1 from serum samples, we coated plates (Nunc™ MicroWell™ 96-Well Microplates) with H. polygyrus excretory–secretory antigen [HES, supplied by R. M. Maizels, 1.0 µg mL−1 (Johnston et al., Reference Johnston, Robertson, Harcus, Grainger, Coakley, Smyth, McSorley and Maizels2015)] diluted in carbonate buffer overnight at 4 °C. Non-specific binding sites were blocked with Tris-buffered saline (TBS) containing 4% bovine serum albumin (BSA) at 37 °C for 2 h. Twofold serial dilution of serum samples were prepared in cluster tubes containing TBS-1% BSA, starting at 1:100. A serum sample of laboratory M. musculus that were artificially infected with H. polygyrus was added to each plate as a positive control (supplied by R. M. Maizels). After plates were washed with TBS-0.1% Tween 20, sample dilutions were added to the plates (50 µL per well) and incubated overnight at 4 °C. After washing, 50 µL goat anti-mouse IgG1-HRP detection antibody (Southern Biotech, Lot J6908-MC69), diluted 1:2000 in TBS-1%BSA was added to each well and incubated at 37 °C for 1 h in the dark. Plates were washed four times with TBS-Tween 20 and two times with dH2O, before 50 µL tetramethylbenzidine (TMB) solution was added to each well. Plates were immediately covered to allow the enzymatic reaction to develop for 7 min and the reaction was stopped with 50 µL 0.18 M sulphuric acid. Absorbance was measured at 450 nm. Cut-off values were calculated per plate as mean absorbance of blank wells plus three times the standard deviation of blank wells. The sample titre was determined as the denominator of the lowest sample dilution step that showed absorbance greater than the cut-off value.
For the fecal IgA ELISA, fecal extracts were prepared for each dry frozen fecal sample by soaking fecal pellets in a 3 to 1 volume of protease inhibitor solution (Complete Mini Protease Inhibitor Tablets, Roche, Cat No.: 11836153001). The extraction was then incubated for 1 h at room temperature, after which samples were centrifuged at 12 000 rpm for 5 min and the supernatant containing IgA removed. ELISA plates were coated with unlabelled goat anti-mouse IgA (Southern Biotech, Lot H7912-S233, 2 µg mL−1) diluted in carbonate buffer overnight at 4 °C. Non-specific binding sites were blocked with TBS containing 4% BSA at 37 °C for 2 h. Fecal extracts were diluted 1:100 in cluster tubes containing TBS-1% BSA and added to the plates as triplicates, 50 µL per well. Two 2-fold serial dilutions of standard antibody (Purified mouse IgA, κ isotype control, BD Pharmingen, Lot 3039828) at 50 µL per well were added to each plate. Plates were incubated overnight at 4 °C and then after washing, 50 µL goat anti-mouse IgA-HRP (Southern Biotech, UK, Lot G4512-V522D) diluted 1:4000 in TBS-1% BSA was added to each well and incubated at 37 °C for 1 h in the dark. Plates were washed four times with TBS-Tween and two times with dH2O, before 50 µL TMB solution was added to each well and plates were immediately covered to allow the enzymatic reaction to develop for 7 min. The reaction was stopped with 50 µL 0.18 M sulphuric acid and absorbance at 450 nm was measured. Sample concentrations of total fecal IgA were determined by fitting four-parameter logistic regression to standard curves using online software (www.elisaanalysis.com, ©Copyright 2012 Elisakit.com Pty Ltd.).
Statistical analysis
All statistical analyses were performed using R software version 3.2.2 [R Core Team (Reference R Core Team2018), www.r-project.org].
Laboratory experiment
To analyse H. polygyrus dynamics, we tested for differences between the H. polygyrus-only and coinfection group in (i) the number of worms recovered at the end of the experiment (continuous, worm counts), (ii) the duration of egg shedding (continuous, number of days), (iii) the peak egg shedding (continuous, eggs/gram feces rounded to the nearest integer) or (iv) total egg shedding (continuous, eggs/gram feces rounded to the nearest integer).
To analyse E. hungaryensis dynamics, we split the analysis in two parts: first, we measured oocyst shedding dynamics after the first challenge of the E. hungaryensis-only and coinfection group. Second, we measured oocyst shedding dynamics after the second E. hungaryensis challenge on day 32 (first challenge for the H. polygyrus-only and control groups), hence all the treatment groups were analysed. For both analysis parts, we asked whether there were differences between (i) the peak oocyst shedding and (ii) the total oocyst shedding (both variables are continuous, oocysts/gram feces rounded to the nearest integer).
To analyse H. polygyrus-specific IgG1 dynamics, we excluded the treatment groups that were not challenged with H. polygyrus before day 8 as no H. polygyrus-specific IgG1 antibodies were detected before this point in any of the treatments. We tested whether there were differences between (i) H. polygyrus-specific IgG1 levels (continuous, log-transformed IgG1 titres) throughout the experiment or (ii) H. polygyrus-specific IgG1 levels at the end of the experiment (day 45). We tested whether there were any differences between treatment groups in (i) total fecal IgA levels (continuous, ng mL−1) throughout the experiment across all the treatment groups, as all mice were assumed to be producing IgA because this non-specific antibody is known to be involved in gut homoeostasis (Macpherson et al., Reference Macpherson, Geuking and McCoy2012).
In all the models described above we included the following covariates: host sex (factor, male or female), age at the start of the experiment (continuous, number of days), mean body weight over the experimental period (continuous, grams) and experimental block (factor, A or B). Depending on the response variable, we ran either linear models if the response variable was normally distributed, or generalized linear models (GLM) if the response variable was not. For the models that tested dynamic responses over time, we also included the covariate day (continuous, number of day in the experiment) and an interaction between treatment and day. Those models were run as linear mixed effect models, including animal ID as a random term to control for repeated measures on the same individual.
Comparison laboratory vs field
In order to compare mean antibody levels between the lab and wild, we used data from three different sources. The first dataset came from the coinfection experiment described in this paper (henceforth called ‘laboratory’, n = 23), the second dataset came from a cross-sectional field experiment conducted in 2013 in the Wirral Peninsula, UK [henceforth called ‘Liverpool’, n = 54 (Clerc et al., Reference Clerc, Devevey, Fenton and Pedersen2018)] and the third dataset came from a longitudinal field experiment conducted in 2014 and 2015 in Falkirk, UK (henceforth called ‘Scotland’, n = 89, Clerc et al., in prep). For the laboratory dataset, we used IgA data collected between days 17 and 33, which corresponds to the time-point of the first E. hungaryensis challenge. The IgA data thereby should reflect more closely the IgA levels to be expected in the wild, where the probability of H. polygyrus and E. hungaryensis infection is high. Further, we used H. polygyrus-specific IgG1 data collected at the end of the experiment (day 45), which should more closely reflect what is to be expected in the wild (chronic helminth infection). For the Scotland dataset, we used data from first observations only, since the experiment subsequently involved anthelmintic treatment. Total fecal IgA and H. polygyrus-specific IgG1 levels were measured the same way for all datasets. In order to test the effect of H. polygyrus and E. hungaryensis infection on both antibody levels, we ran a linear model with either H. polygyrus-specific IgG1 or IgA as the response variable. The covariates included in each model were sex (factor, male or female), H. polygyrus infection (factor, yes or no), E. hungaryensis infection (factor, yes or no) and experiment (factor, lab, Liverpool or Scotland). To test whether the effect of E. hungaryensis on antibody levels depended on H. polygyrus infection, we also included an interaction between those two factors in each model.
Results
Laboratory experiment
Coinfected animals had on average over 2.5 times more worms than H. polygyrus-only infected animals by the end of the experiment (day 45; H. polygyrus-only: mean 13 worms ± 5 s.e.; coinfection: mean 35 worms ± 7 s.e.; negative binomial GLM: effect of H. polygyrus-only treatment: E st = −1.18, P < 0.0001, Fig. 2, Table 1). We also found that age had a significant effect on the number of adult H. polygyrus worms harboured, with older mice harbouring fewer worms than younger mice. H. polygyrus-only and coinfected mice both started shedding H. polygyrus eggs on day 8, but the duration of egg shedding was significantly longer in coinfected animals than H. polygyrus-only (mean end of shedding on day 17 ± 1.5 s.e. vs 26 ± 4.5 s.e., respectively; Poisson GLM: effect of H. polygyrus-only treatment: E st = −0.42, P = 0.001, Fig. 3A, Table 1). There was no significant difference in peak H. polygyrus shedding (H. polygyrus-only: mean 187 eggs/gram feces ± 47 s.e.; coinfection: mean 180 eggs/gram feces ± 44 s.e., Table 1) nor in total H. polygyrus shedding over the experimental period between H. polygyrus-only and coinfected mice (H. polygyrus-only: mean 336 eggs/gram feces ± 68 s.e.; coinfection: mean 260 eggs/gram feces ± 62 s.e., Table 1).
Fig. 2. Number of adult H. polygyrus worms recovered from mice at day 45 of the experiment. Points represent means ± s.e.
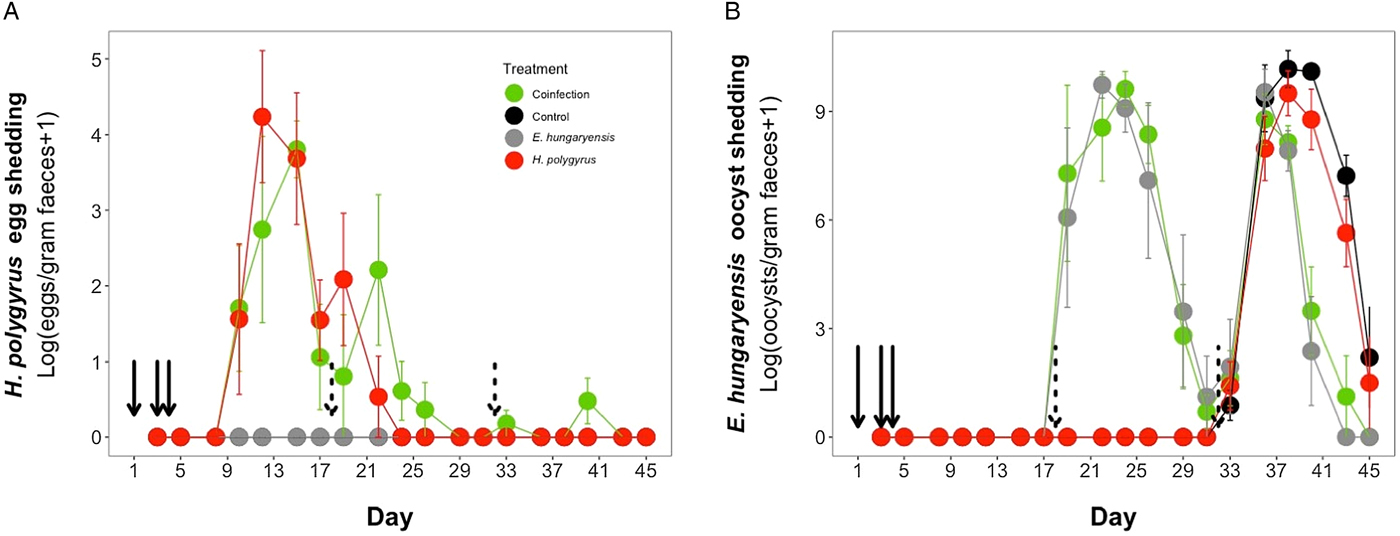
Fig. 3. Parasite dynamics during the experimental period for (A) H. polygyrus, (B) E. hungaryensis. Points represent means ± s.e. Black, control; grey, E. hungaryensis-only; red, H. polygyrus-only; green, coinfection. Solid black arrows denote H. polygyrus challenge events, dashed black arrows denote E. hungaryensis challenge events.
During the first E. hungaryensis challenge (Fig. 3B day 18 onwards), there were no significant differences in peak oocyst shedding (Table 2, Fig. 4A) or total oocyst shedding (Table 2, Fig. 4B) between E. hungaryensis-only infected and coinfected mice. However, during the second challenge (Fig. 3B day 32 onwards), all treatment groups had at least 50% lower peak oocyst shedding than control mice (E. hungaryensis-only: 17 279 oocysts ± 8035 s.e.; coinfection: 12 110 oocysts ± 3087 s.e.; H. polygyrus-only: 27 505 oocysts ± 12 271 s.e.; control: 52 910 oocysts ± 14 349 s.e.; linear model: effect of H. polygyrus-only: E st = −1.66, P = 0.006, effect of E. hungaryensis-only: E st = −2.38, P = 0.001, effect of coinfection: E st = −1.84, P = 0.003, Table 2, Fig. 4C). Further, total E. hungaryensis oocyst shedding was 63% lower during a second challenge compared with a first challenge (E. hungaryensis-only: 22 091 oocysts ± 8919 s.e.; coinfection: 17 160 oocysts ± 3342 s.e.; H. polygyrus-only: 58 733 oocysts ± 23 487 s.e.; control: 112 799 oocysts ± 34 366 s.e.; linear model: effect of H. polygyrus-only: E st = −6.64, P = 0.056, effect of E. hungaryensis-only: E st = −19.71, P < 0.0001, effect of coinfection: E st = −17.76, P < 0.0001, Table 2, Fig. 4D).

Fig. 4. Peak and total E. hungaryensis shedding at different time points in the experiment. (A) Peak E. hungaryensis shedding during the first E. hungaryensis challenge, (B) total E. hungaryensis shedding during the first E. hungaryensis challenge, (C) peak E. hungaryensis shedding during the second E. hungaryensis challenge and (D) total E. hungaryensis shedding during the second E. hungaryensis challenge. Points represent means ± s.e.
Table 2. Modelling results for E. hungaryensis peak oocyst shedding for challenge 1 (n = 11), total oocyst shedding at challenge 1 (n = 11), peak oocyst shedding for challenge 2 (n = 23) and total oocyst shedding at challenge 2 (n = 23)
Each column represents a single model, each row represents a model covariate. Each cell contains the covariate estimate and P value. Cells containing NA represent covariates that were not included in the model. Comparison levels for factors are given in brackets. Hp stands for H. polygyrus, Eh stands for E. hungaryensis.
****P < 0.001, **P < 0.01, *P < 0.05, •P < 0.1.
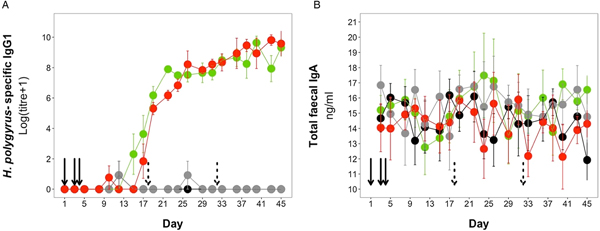
H. polygyrus-specific IgG1 antibodies were detectable from day 12 onwards for mice in the coinfection group, and from day 15 onwards in the H. polygyrus-only group (Fig. 5A). After these time points, H. polygyrus-specific IgG1 titres increased steadily until around day 24, after which titres started to plateau (Fig. 5A). However, while the titre of H. polygyrus-specific IgG1 changed over time, there was no difference in the dynamics of H. polygyrus-specific IgG1, or in the final amount of H. polygyrus-specific IgG1 at the end of the experiment between the H. polygyrus-only and the coinfected mice (Fig. 5A, Table 3). Fecal IgA concentration varied substantially for all four treatment groups throughout the experimental period (Fig. 5B) and was not significantly different between treatment groups over time (Table 3).

Fig. 5. Antibody dynamics during the experimental period for (A) H. polygyrus-specific IgG1 and (B) total fecal IgA. Points represent means ± standard errors. Black, control; grey, E. hungaryensis-only; red, H. polygyrus-only; green, coinfection. Solid black arrows denote H. polygyrus challenge events, dashed black arrows denote E. hungaryensis challenge events.
Table 3. Analysis results for H. polygyrus-specific IgG1 dynamics, H. polygyrus-specific IgG1 levels at day 45 and total fecal IgA dynamics
Each column represents a single model, each row represents a model covariate. Each cell contains the covariate estimate and P value. Cells containing NA represent covariates that were not included in the model. Comparison levels for factors are given in brackets. Hp stands for H. polygyrus, Eh stands for E. hungaryensis.
****P < 0.001, **P < 0.01, *P < 0.05, P < 0.1.
Comparison laboratory vs wild
We used data from this laboratory experiment and two previous field experiments to test for the difference in antibody levels between the wild and laboratory in both single and coinfected hosts (Fig. 6). We found no difference in the prevalence of either parasite between the two field experiments for H. polygyrus (Scotland = 58.5%, Liverpool = 59.3%, P = 1.00) and E. hungaryensis/Eimeria spp. (Scotland = 32.0%, Liverpool = 18.5%, P = 0.101). However, Liverpool mice had higher IgA levels (linear model: effect of Liverpool origin: E st = 25.81, P < 0.0001, Table 4, Fig. 6C) and Liverpool IgA levels were also more variable compared with the laboratory and Scotland samples. In the Scotland samples, IgA concentrations were highest in the autumn 2014 season (Spring 2014: 18.8 ± 1.4 ng mL−1, Autumn 2014: 24.1 ng mL ± 1.4 s.e., Spring 2015: 19.8 ng mL ± 1.0 s.e., ANOVA F 2,72 = 3.65, P = 0.031). For H. polygyrus-specific IgG1, laboratory animals only had antibodies if they had been infected with H. polygyrus (Fig. 6D), whereas wild animals showed elevated H. polygyrus-specific IgG1 (Fig. 6E, F), even if they were not shedding H. polygyrus eggs at the time of sampling (linear model: effect of H. polygyrus infection: E st = 1.52, P = 0.013, Table 4). Interestingly, E. hungaryensis had a negative effect on H. polygyrus-specific IgG1 levels in the field, but this effect was stronger in mice that were not currently shedding H. polygyrus eggs at the time of sampling (linear model: H. polygyrus × E. hungaryensis: E st = 2.45, P = 0.045, Table 4).
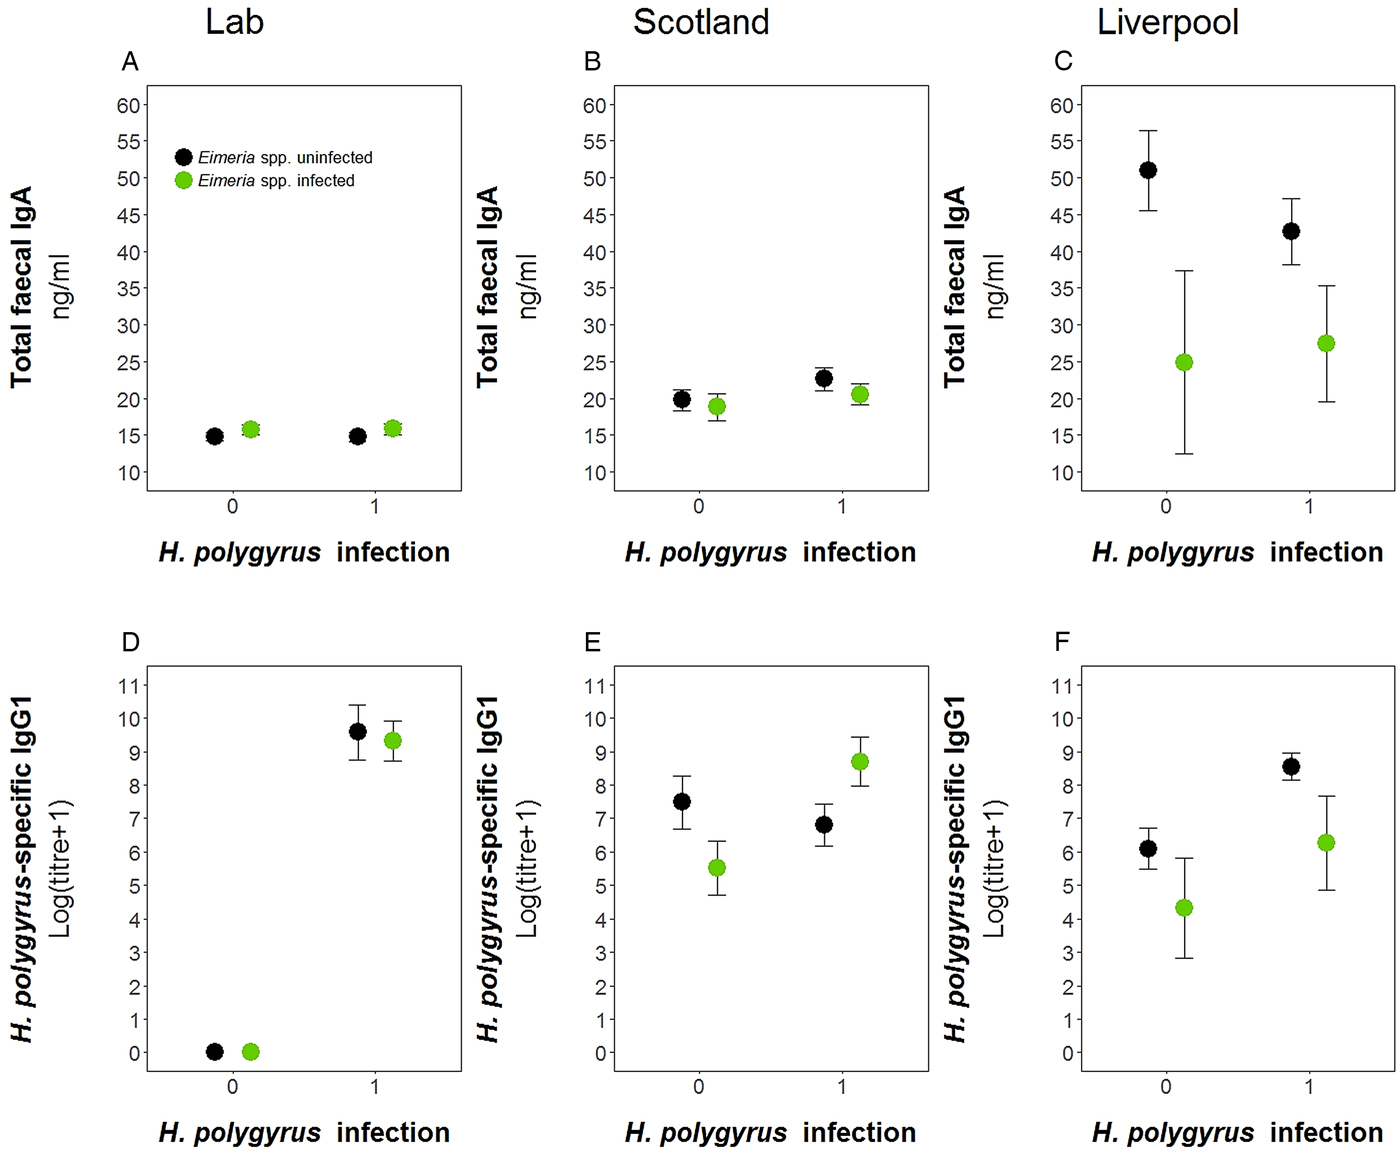
Fig. 6. Comparison of antibody levels between laboratory and field studies. Top row, total fecal IgA; bottom row, H. polygyrus-specific IgG1. (A) and (D) represent the laboratory experiment, (B) and € represent the Scotland field study, and (D) and (F) represent the Liverpool field study. Data is split by H. polygyrus infection (x-axis) and E. hungaryensis (or Eimeria spp.) infection (green dots) or E. hungaryensis (or Eimeria spp.) uninfected (black dots). Points represent means ± s.e.
Table 4. Analysis results for H. polygyrus-specific IgG1 and total fecal IgA comparison between laboratory, Liverpool and Scotland sites
Each column represents a single model, each row represents a model covariate. Each cell contains the covariate estimate and P value. Comparison levels for factors are given in brackets. Hp stands for H. polygyrus, Eh stands for E. hungaryensis.
****P < 0.001, **P < 0.01, *P < 0.05, •P < 0.1.
Discussion
By using the offspring of originally wild-derived wood mice and their naturally co-evolved parasites H. polygyrus and E. hungaryensis, we were able to demonstrate the impact of coinfection on the infection dynamics of both interacting parasites, as well as total and parasite-specific antibodies in a controlled environment. This enabled us to demonstrate, for the first time, that the interaction between these parasites in this system is reciprocal. Our results confirmed our previous wild experiment findings (Knowles et al., Reference Knowles, Fenton, Petchey, Jones, Barber and Pedersen2013), specifically that H. polygyrus has a negative effect on E. hungaryensis infection (but only on secondary challenge), but importantly were also able to demonstrate that E. hungaryensis, in turn, has a positive effect on H. polygyrus shedding and adult worm burdens. Further, thanks to our wild-like laboratory experiment, we directly compared antibody levels found in two independent field studies to those found under controlled laboratory conditions. This highlighted that wild mice had much higher baseline parasite-specific antibody levels, potentially suggesting much higher parasite exposure events, a series of trickle infections and/or a role for immune-memory in mediating parasite within-host interactions in the wild. Our results also highlight the crucial effect of coinfection for within-host parasite interactions, and enable us to gain a more mechanistic insight into the underlying causes governing this previously identified interaction, which was not possible from field-data alone due to unknown/uncontrolled levels of parasite exposure, nutritional status and infection histories.
One key finding of our study was that coinfection with E. hungaryensis increased the duration of H. polygyrus-egg shedding and led to 2.5 times higher adult worm burdens compared with singly infected mice. The higher worm burdens found in coinfected mice suggests that E. hungaryensis infection may reduce resistance towards H. polygyrus. Both singly and coinfected mice started shedding eggs at the same time and there was no difference in peak H. polygyrus egg shedding, suggesting that coinfection did not impact susceptibility and worm establishment. Instead we propose that coinfected mice were less able to expel adult worms from the gut, once coinfected, which resulted in much higher adult worm burdens and a longer period of egg shedding. A previous coinfection study using H. polygyrus and the bacterium Bordetella bronchiseptica conducted in laboratory mice found a similar effect; with no difference in worm burdens 12 days post-infection, but coinfected animals had significantly more worms at 24 and 48 days post-infection and a prolonged egg shedding period (Lass et al., Reference Lass, Hudson, Thakar, Saric, Harvill, Albert and Perkins2013). We further found lower worm burdens in older compared with younger mice, which is consistent with recent findings from a wild study we conducted, and likely represents a less mature immune system in younger mice compared with older mice (Clerc et al., in review).
In our wild-like laboratory experiment, we also found that coinfection with H. polygyrus had no significant effect on E. hungaryensis oocyst shedding during primary infection (Fig. 2B green and grey lines). However, we then challenged all experimental groups, including the control and H. polygyrus-only groups, with E. hungaryensis, which showed that there was a negative effect of H. polygyrus infection during a secondary E. hungaryensis challenge leading to lower peak oocyst shedding in coinfected mice than in the control mice. Given that the negative effect of H. polygyrus on E. hungaryensis oocyst shedding was only found in the secondary challenge, this suggests that the interaction between the two parasites is not purely based on competition for shared host resources (Knowles et al., Reference Knowles, Fenton, Petchey, Jones, Barber and Pedersen2013), but likely also involves the host immune system. A study in laboratory mice found an effect of timing of worm coinfection on Eimeria infection (Rausch et al., Reference Rausch, Held, Stange, Lendner, Hepworth, Klotz, Lucius, Pogonka and Hartmann2010); mice were infected with E. falciformis either 6 or 28 days after Heligmosomoides bakeri infection and the results suggest that only early coinfection increased E. falciformis replication. This positive effect on Eimeria was accompanied by a reduced production of pro-inflammatory cytokines and an overall increase in the nematode-specific Th2 response, whereas chronic coinfection had no effect on E. falciformis replication (Rausch et al., Reference Rausch, Held, Stange, Lendner, Hepworth, Klotz, Lucius, Pogonka and Hartmann2010). A key difference between the Rausch et al. (Reference Rausch, Held, Stange, Lendner, Hepworth, Klotz, Lucius, Pogonka and Hartmann2010) and our current study was that we used two parasites that physically overlap in their infection site (duodenum), whereas H. bakeri (duodenum) and E. falciformis (caecum) do not physically overlap. This suggests that in the case of coinfection of parasites that share the same niche, there is potential for more direct interaction between diverging immune cell populations as well as for tissue structural effects due to disruption of epithelial tissue integrity by the helminths (Boyett and Hsieh, Reference Boyett and Hsieh2014; Bramhall and Zaph, Reference Bramhall and Zaph2017). Specifically, in the case of H. polygyrus, tissue damage can occur when larvae are emerging from the gut epithelium and/or when feeding in the lumen as adults, which can limit the pool of suitable epithelial cells available for E. hungaryensis to infect. While, to our knowledge, no study has yet attempted to quantify the degree of available host cells for Eimeria infection in the case of helminth coinfection, a mathematical model of single-Eimeria infection found that host cell availability, specifically at high infection doses, could explain the so-called ‘crowding effect’, where Eimeria fecundity decreases with increased infection dose due to a smaller pool and lifespan of available epithelial cells (Johnston et al., Reference Johnston, Shirley, Smith and Granvenor2001). It is possible that H. polygyrus-infection mimics the host cell availability of high-dose single Eimeria infections, due to tissue damage, but more work is needed to confirm this hypothesis. Ultimately, our results suggest that in order for H. polygyrus to exert a protective effect for the host against high Eimeria burden, the two parasites need to physically overlap during chronic H. polygyrus infection.
Overall, we show that the interaction between these two gut parasites is not uni-directional but reciprocal, with different outcomes for the epidemiology of each parasite: while H. polygyrus coinfection reduces the transmission potential of E. hungaryensis via a reduction in peak oocyst shedding (see also Knowles et al., Reference Knowles, Fenton, Petchey, Jones, Barber and Pedersen2013), E. hungaryensis coinfection can actually facilitate H. polygyrus transmission via increased worm survival and prolonged egg shedding. This result highlights that it is important to understand the direction in which parasites interact in order to make predictions about the causes and consequences of within-host interactions. Combining experiments conducted both in the laboratory and in the field represents a powerful tool to disentangle the underlying causes of parasite within-host interactions and their directions.
In addition to disentangling the within-host parasite interactions, we aimed to test whether mice were able to develop protective immunity to homologous Eimeria challenge, i.e. challenge with the same strain of Eimeria spp. In contrast to laboratory mice and chickens, where protective immunity towards homologous challenge is frequently observed (Smith et al., Reference Smith, Hesketh, Archer and Shirley2002; Steinfelder et al., Reference Steinfelder, Lucius, Greif and Pogonka2005; Pogonka et al., Reference Pogonka, Schelzke, Stange, Papadakis, Steinfelder, Liesenfeld and Lucius2010), wild mice are often found infected with one or multiple Eimeria species repeatedly over a long period of time, with prevalence usually ranging around 30–50% (Higgs and Nowell, Reference Higgs and Nowell2000; Knowles et al., Reference Knowles, Fenton, Petchey, Jones, Barber and Pedersen2013). In our controlled laboratory infections of wood mice with Eimeria, although we found that peak and total E. hungaryensis oocyst shedding were lower in the secondary challenge, protective immunity was incomplete, as both the E. hungaryensis-only and coinfection group still shed significant E. hungaryensis oocysts after their second challenge. This lack of protective immunity towards reinfection may result from partial immunity to all strains (imperfect homologous immunity) or from complete immunity to only a subset of E. hungaryensis strains. Indeed, the E. hungaryensis isolate used in this experiment likely consisted of multiple genetically different E. hungaryensis strains and the original isolate was only passaged through colony housed wood mice three times. Heterologous immunity has been demonstrated in chickens, where hosts infected with one strain of Eimeria maxima were always protected against homologous challenge, whereas protection from heterologous challenge varied from 0 to 100% and further depended on host genotype (Smith et al., Reference Smith, Hesketh, Archer and Shirley2002). This highlights that natural levels of genetic diversity within an infective dose, which is highly likely to be the case in natural coccidian infection of wild wood mice (Higgs and Nowell, Reference Higgs and Nowell2000), may be an important reason why hosts are unable to mount substantial protective immunity under natural conditions.
With regard to adaptive immunity to H. polygyrus, we found that H. polygyrus-specific IgG1 titres increased following helminth infection, but that coinfection had no effect on the magnitude of H. polygyrus-specific IgG1 in serum. This result resembles the findings of a laboratory mouse experiment that showed that coinfection with Toxoplasma gondii did not impact the production of Fasciola hepatica-specific IgG1 (Miller et al., Reference Miller, Smith, Ikin, Boulter, Dalton and Donnelly2009). In contrast, Fairlie-Clarke et al. (Reference Fairlie-Clarke, Lamb, Langhorne, Graham and Allen2010) showed reduced helminth-specific IgG1 levels in laboratory mice coinfected with either Nippostrongylus brasiliensis and Plasmodium chabaudi, or Litomosoides sigmodontis and P. chabaudi (Fairlie-Clarke et al., Reference Fairlie-Clarke, Lamb, Langhorne, Graham and Allen2010). These conflicting results highlight the variable effect of microparasite coinfection on helminth-specific antibody production. Heligmosomoides polygyrus-specific IgG1 is important for reducing adult worm fecundity upon primary infection and plays a key role in worm expulsion after multiple H. polygyrus-challenges (McCoy et al., Reference McCoy, Stoel, Stettler, Merky, Fink, Senn, Schaer, Massacand, Odermatt, Oettgen, Zinkernagel, Bos, Hengartner, Macpherson and Harris2008). Because our study included only a single H. polygyrus challenge, the delay in H. polygyrus expulsion following E. hungaryensis coinfection may have been mediated by other immune factors. However, further work is needed to investigate the role of this antibody in secondary H. polygyrus challenge in our co-evolved system. We were surprised by the highly variable concentrations of total fecal IgA, which showed no discernible temporal pattern and no difference between treatment groups. This meant that we found a significant block effect in the IgA model, highlighting that the main portion of variation in IgA levels could not be explained by either the experimental treatment groups or any other important covariates. In coccidian infections, the precise role of IgA is still debated, but E. maxima-specific IgA levels have been shown to increase markedly at 8 days post infection in infected chickens (Yun et al., Reference Yun, Lillehoj and Lillehoj2000). Additionally, parasite-specific IgA levels have been shown to rise after secondary H. polygyrus-infection, while total intestinal IgA levels stay constant after primary and secondary H. polygyrus infection (McCoy et al., Reference McCoy, Stoel, Stettler, Merky, Fink, Senn, Schaer, Massacand, Odermatt, Oettgen, Zinkernagel, Bos, Hengartner, Macpherson and Harris2008). In the future, measuring both total and parasite-specific fecal IgA will give more insight into how IgA may impact both coinfection and protective immunity to Eimeria.
By comparing the antibody levels observed in our controlled environment to those measured in two field experiments, we showed that H. polygyrus-infected laboratory mice produced more specific IgG1 compared with wild mice. Further, wild mice had elevated H. polygyrus-specific IgG1 levels, even when they were not currently shedding H. polygyrus eggs, whereas laboratory-kept mice produced no H. polygyrus-specific IgG1 in the absence of the parasite. This likely reflects the repeated infectious challenges that wild animals face in natural environments (Tinsley et al., Reference Tinsley, Stott, York, Everard, Chapple, Jackson, Viney and Tinsley2012), and might suggest protective immunity in mice that were not shedding any H. polygyrus eggs at the time of sampling. We further observed that Eimeria infection had a significant negative effect on antibody levels in the wild, irrespective of the presence of H. polygyrus eggs (although the effect was stronger for H. polygyrus-specific IgG1 if H. polygyrus eggs were present). Interestingly, the negative effect of Eimeria infection on IgG1 titres was not consistent across field sites, as it was much stronger in the Liverpool population, where we also found overall higher IgA levels. This could, at least in part, be linked to seasonal effects; the Liverpool data were only collected in autumn, whereas the Scotland data were mainly collected in spring (two of the three trapping sessions), and IgA levels were significantly higher in the autumn session compared with the spring sessions in Scotland. In the spring, mice reach their peak reproductive period and a study in field voles has shown that this is the time point of lowest expression of pro- and anti-inflammatory immune markers, suggesting a trade-off between resource allocation to immunity and reproduction (Jackson et al., Reference Jackson, Begon, Birtles, Paterson, Friberg, Hall, Lowe, Ralli, Turner, Zawadzka and Bradley2011). Further, strong seasonal changes in wood mice gut microbiome have been shown previously, with an overall more diverse bacterial community in late summer/autumn, and specifically higher abundances of Alistipes and Heliobacter (Maurice et al., Reference Maurice, Knowles, Ladau, Pollard, Fenton, Pedersen and Turnbaugh2015). Since commensal bacterial species are triggers of intestinal IgA expression (Macpherson et al., Reference Macpherson, Geuking and McCoy2012), our finding of higher IgA levels in the autumn could suggest a higher capacity of the autumn-microbiome in triggering IgA expression, leading to higher baseline IgA levels irrespectively of parasite burdens. Alternatively, higher autumn IgA levels could also be caused by an accumulation of parasite exposure events during the spring and summer months, compared with mice sampled in the spring before a peak in parasite exposure. Both these hypotheses need further testing
By testing this natural host–parasite–parasite combination under controlled conditions, we offer a novel perspective on the within-host parasite interactions. Due to our unique experimental set-up (wild-derived hosts and co-evolved parasites that naturally interact), we were also able to compare our findings from the laboratory to previous findings from wild mouse populations, which confirmed our previous evidence of a negative interaction, but importantly identified a new positive interaction, demonstrating a previously unknown reciprocity in this interaction. Our results call for a more profound understanding of the effects of frequent exposure and force of infection on parasite and immune dynamics, which will enable the design of more realistic laboratory experiments and increase awareness of the importance of wild study systems.
Author ORCIDs
Melanie Clerc, 0000-0003-1195-4558.
Financial support
This work was supported by the grants from the National Environment Research Council to ABP and AF (grant numbers NE/G006830/1, NE/G007349/1, NE/I024038/1 and NE/I026367/1), grants from the Wellcome Trust awarded to ABP (CIIE: grant number 095831 and ISSF 2014), and SAB (grant number 097821/Z/11/Z), and a Torrance Bequest scholarship from the University of Edinburgh awarded to MC.
Conflict of interest
None.
Ethical standards
All procedures on animals conducted in accordance with the Animals (Scientific Procedures) Act 1986.


 Open access