


Skatole (3-methylindole), a tryptophan metabolite with a faecal odour, is an important predictor of odour from meat chicken farms, and the skatole levels can be arranged in the decreasing order: caecum > rectum > ileum(Reference Yang, Zhang and Liu1). Skatole is metabolised mainly in the liver and in other organs such as kidneys and lungs. The metabolism of skatole was affected by the expression of catalytic metabolic enzymes in the liver(Reference Jensen2). Studies have identified that cytochromes of a larger enzymatic complex called cytochrome P450 (CYP450, CYP)(Reference Babol, Squires and Lundström3,Reference Babol, Squires and Lundström4) and aldehyde oxidase(Reference Diaz and Squires5) play a major role in this metabolism. Many forms of CYP450, especially members of the CYP1A, CYP2 and CYP3A subgroups, play an important role in the biotransformation of many exogenous substances(Reference Lewis and Lake6).
CYP450 are widely expressed in all living species, with more or less conserved isoforms(Reference Rasmussen and Zamaratskaia7). Thornton-Manning et al.(Reference Thornton-Manning, Ruangyuttikarn and Gonzalez8,Reference Thornton-Manning, Appleton and Gonzalez9) investigated the metabolic potential of several vaccinia-expressed human CYP450 towards skatole and found that CYP1A2, CYP2A6, CYP2B6, CYP2C8, CYP3A4, CYP2E1 and CYP2D6 were capable of metabolising skatole. The activity of these enzymes was influenced by a variety of factors, most of which are unclear or inconclusive(Reference Jensen2). It was suggested that feeding sugar beet fibre(Reference Whittington, Nute and Hughes10) and dried chicory root(Reference Rasmussen, Zamaratskaia and Ekstrand11) increased the expression of hepatic enzymes and was involved in skatole metabolism.
Stachyose is an α-galacto-oligosaccharide consisting of two molecules of α-(1,6)-linked galactose that are bound to a terminal sucrose unit. Stachyose is a major functional component of soyabean oligosaccharide(Reference Lan, Williams and Verstegen12). Usually, it can remain undigested by animals due to the absence of α-galactosidase, whereas it can be fermented by intestinal bacteria(Reference Choct, Dersjant-Li and McLeish13). Hayakawa et al. (Reference Hayakawa, Mizutani and Wada14) reported that stachyose was utilised effectively by bifidobacteria and contributed to increasing the number of human faecal bifidobacteria, further reduced the concentrations of indole and skatole. Broilers have the advantage of short feeding period and share significant genetic conservation with humans(Reference Furlong15). Therefore, broilers have served as an important model for investigating the mechanisms of dietary supplemental vitamin D3 in mediating the regulation of phosphorus absorption and retention in the bone(Reference Shao, Qian Wen and Zhang16). Our previous study has also reported that following the addition of stachyose (10 g/l) to the caecal bacteria culture medium, the metabolism of l-tryptophan change to skatole was significantly decreased by improving the microbiota richness and promoting the growth of characteristic bacteria using chickens as a model(Reference Yang, Yang and Liu17).
Therefore, the hypothesis of this study was that stachyose decreases skatole levels in the caecum, thereby reducing skatole emissions. However, the higher content of stachyose will cause more undigested proteins to enter the hindgut, which increase the degradation of l-tryptophan and skatole production. Therefore, the proper dose effect of stachyose on reducing the skatole level in broilers should be further elucidated. The objectives of the present study were to determine the optimum dietary stachyose level for skatole reduction and evaluate the effects of dietary stachyose on the hepatic CYP450 mRNA expressions and enzymatic activities in broilers.
Experimental methods
Birds, feeding trial and dietary treatments
The animal procedures performed in this study were approved by the ethical standards of Institutional Animal Care and Use Committee of Shenyang Agricultural University (approval no. 201801002, Shenyang, China), and in accordance with the Reporting In Vivo Experiments (ARRIVE) guidelines for reporting animal research(Reference Kilkenny, Browne and Cuthill18). A completed ARRIVE guidelines checklist is included.
A total of 360 one-day-old Arbor Acre broiler chicks (male and female, randomly selected, average body weight: 40·3 g; sem = 0·32; P > 0·1) were obtained from a commercial hatchery (Huamei Animal and Poultry Co. Ltd). Birds were randomly allocated to six groups. Each group comprised six cages (replicates) with ten birds per cage (128 × 64 × 40 cm). All birds were housed in a thermostatically controlled room (using the Coal Firing Hot-blast Stove) equipped with fibreglass feeders, nipple waterer and stainless steel cages coated with plastics. Birds had ad libitum access to feed and water. On day 1, temperature was kept at 35 (sem 2)°C with 70 (sem 5) % relative humidity. Temperature was gradually decreased (3°C) per week until it reached 25°C with relative humidity 65 (sem 5) % during the third week. After 21 d, temperature was maintained at 25°C till the end of trial. In order to obtain enough samples of caecal contents, the feeding trial was extended to 49 d (42 d for routine feeding). The applied light cycle was 23 h light–1 h dark during the experimental feeding period.
Immunisation procedure: the chicks were vaccinated against Newcastle disease, infectious bronchitis and infectious bursal disease. Live attenuated Newcastle disease vaccine and infectious bronchitis 120 were given on day 7 (intranasal and intraocular) and repeated (Newcastle disease and infectious bronchitis 52) on day 28 in drinking water. Similarly, chicks were immunised against infectious bursal disease on day 12 by oral drip and repeated on day 22 in drinking water. Mortalities and health status were observed visually and recorded daily throughout the experiment. The feeding experiment was conducted at the Chicken Research Farm that belongs to Shenyang Agricultural University, China, from April until June 2018.
The experiment was designed to have two control diets with similar metabolisable energy, protein and the main amino acid levels. The positive control (PC) diet was based on maize–soyabean meal and contained 2·8–2·0 g/kg stachyose in the starter and grower, respectively, and the negative control (NC) diet differed from the PC diet in that soyabean meal was substituted with maize by-products to contain 0 g/kg stachyose. The diets were formulated to meet the nutrient requirements for broiler chickens. The ingredient and nutrient composition are depicted in Table 1. The other experimental diets contained stachyose, in which the NC diet was supplemented with 4, 5, 6 and 7 g/kg of stachyose and was named S-4, S-5, S-6 and S-7, respectively. These dose levels were based on the stachyose contents in the PC diets and the research finding in Yi(Reference Yi20). The stachyose was obtained from Guangzhou Yibaolai Biotechnology Co. and contained 853·3 g/kg total sugars and 10·9 g/kg protein (measured values). All of the diets were offered in mashed form.
Table 1. Ingredient composition of the diets for starter and grower broilers (g/100 g as fed)

* PC diet: positive control diet which contains soyabean meal and contained 2·8 and 2·0 g/kg stachyose in the starter and grower, respectively.
† NC diet: negative control diet which differed from the PC diet in that soyabean meal was substituted with maize by-products to contain 0 g/kg stachyose.
‡ Provided per kg of diet: vitamin A 6·75 mg, vitamin B1 2·5 mg, vitamin B2 1·5 mg, vitamin B6 20 mg, vitamin D3 0·14 mg, vitamin E3 35 mg, vitamin K3 5 mg, antioxidant 0·25 mg, pantothenic acid 5 mg, folic acid 2 mg, niacin 75 mg, biotin 0·12 mg, Mn 60 mg, Fe 44 mg, Zn 76·5 mg, Cu 6·8 mg, K 10 mg and Na 14·6 mg.
§ Metabolisable energy and available P were calculated values, while the others were determined based on triplicate assays.
|| Stachyose contents were calculated according to the analysed values in soyabean meal based on triplicate assays by ion chromatography(Reference Zhou, Qiao and Ma19).
Sample collection
At 49 d of age, a total of twenty-four birds, six birds from each group (one from each replicate), were selected according to the average body weight of the cage and slaughtered by cervical dislocation. A section of the left lobe of the liver was immediately removed, chopped into small (approximately 3 mm) pieces and split into three samples. The samples were placed in enzyme-free centrifuge tubes, quick-frozen in liquid N2 for 15 min and then stored at –80°C until processing. The caecal contents were also immediately removed, placed in sterilised centrifuge tubes with cover and then kept at –20°C until processing, for determination of pH, indole, skatole, volatile fatty acids (VFA) and lactic acid. The mRNA expressions of CYP450 (1A2, 2D6 and 3A4) and their activities were evaluated for liver tissue samples.
Analysis of indole, skatole, volatile fatty acids and lactate concentration
The concentration of indole and skatole in the caecum contents was measured using an HPLC equipment (model Agilent 1100, Agilent Technologies) following the methods used by Yang et al. (Reference Yang, Yin and Liu21). The VFA (acetate, propionate and butyrate) and lactate concentration were determined by HPLC as previously described by Yang et al. (Reference Yang, Zhang and Liu1). The pH value was measured according to the National Food Safety Standard, Determination of pH value of food (GB 5009.237-2016).
CYP450 (1A2, 2D6 and 3A4) mRNA expression using quantitative PCR
Quantitative PCR was used to quantise the relative mRNA expression of CYP1A2, CYP2D6 and CYP3A4 in the liver samples. The 18S rRNA gene was used as an internal reference gene.
Total RNA extraction, detection and reverse transcription
Total RNA was isolated from 300 mg of liver tissue of birds using Trizol reagent (Invitrogen, Thermo Fisher Scientific) according to the manufacturer’s instructions. Then, the amount and purity of extracted total RNA were measured by a Nanodrop® 1000 spectrophotometer (Thermo Fisher Scientific). The cDNA was obtained by using a First Strand cDNA Synthesis Kit (Beijing By-bio Co.).
Primer design and synthesis
According to the gene sequence of GenBank, the conservative region was selected by Mega 5.0 software and primers were designed by Primer Express 5.0 software. The primer sequences and length are shown in Table 2. All primers were synthesised by Beijing Mymbio Co.
Table 2. Primer sequences of chicken cytochrome P450 and 18S rRNA genes
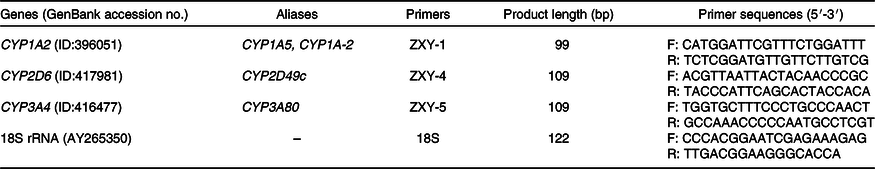
CYP, cytochrome P450; F, forward primer; R, reverse primer.
PCR amplification and gene cloning
The cDNA was used as a template to amplify the target genes with the above specific primers by PCR, and cloned into pGEM-T Easy Vector (Invitrogen), and then transferred to competent cell DH5α. The PCR products were sequenced to validate the identity of the amplicons.
Quantitative PCR reaction
All quantitative PCR reactions were performed using the StepOnePlus real-time PCR system (Life Technology Co.). Reactions were conducted in a 10-μl total reaction system containing 5 μl of 2 × SG Green quantitative PCR Mix, 1 μl of the cDNA sample, 0·2 μl of each primer (10 μmol/l) and 3·6 μl of nuclease-free water. The quantitative PCR conditions were used: one cycle of 95°C for 3 min, followed by forty cycles of 95°C for 10 s, 60°C for 20 s and 72°C for 10 s. All samples were amplified in triplicate. Melting curve data were analysed to confirm the specificity of the reaction.
Quantitative analysis of target genes
Relative expressions of target genes were calculated according to the threshold fluorescence cycle values (Ct) by the 2–△△CT method(Reference Livak and Schmittgen22). All the samples were analysed in triplicates.
Enzymatic activity of CYP450 (1A2, 2D6 and 3A4)
The CYP450 enzymatic activities were determined by the ELISA method using an Infinite M200 Pro Multimode Reader (Tecan) according to the manufacturer’s instruction. Chicken Liver CYP450 Subenzyme-linked Immunoassay Kits were obtained from Jiangsu Enzyme-linked Immune Industry Co. Ltd.
Statistical analysis
Data from each treatment were subjected to ANOVA using IBM SPSS Statistics 19.0 (SPSS Inc.) for windows. The sample size in this experiment was six replicates (cages) per treatment. One-way ANOVA followed by Sidak’s post hoc test was used to evaluate the effect of dietary stachyose level on the various response criteria. Contrast was established using linear and quadratic trend analysis to determine the effects of increasing the stachyose level. For all statistical analyses, a level of 0·05 was used to determine statistical significance. The replicate cage of ten chicks for growth performance (unpublished results) or one chick for other indices served as the experimental unit. Data were presented as mean values with their standard errors and P values.
Results
Indole and skatole levels
The broilers were healthy, appeared to be in normal condition, and no major adverse events during the whole experimental period.
Effects of the dietary stachyose level on indole and skatole levels are presented in Table 3. The dietary stachyose level had an effect on the levels of skatole and indole in the caecum of broilers (P < 0·01). The caecal indole level of broilers in the S-5 group was lower than those in the PC, NC, S-4 and S-6 groups by 13·02, 19·19, 17·93 and 14·77 % (P < 0·01), respectively, but this indole level was not different from the S-7 group (P > 0·05). The caecal skatole level in the NC group was the highest (1·93 μg/g), followed by the S-6 and S-4 groups. The lowest skatole level was observed in the S-5 group, and this was not different from birds in the PC or S-7 group (P > 0·05). The skatole levels in the PC, S-4, S-5, S-6 and S-7 groups were lower than those in the NC group by 42·28, 23·68, 46·09, 15·31 and 45·14 % (P < 0·01), respectively.
Table 3. Effects of dietary stachyose levels on caecal indole, skatole and fermentation parameters in broilers*
(Mean values with their standard errors)

a,b,c Mean values within a row with unlike superscript letters were significantly different (P < 0·05).
* Six broilers per group.
† PC, positive control group, in which birds fed diet containing soyabean meal and contained 2·8 and 2·0 g/kg stachyose in the starter and grower, respectively; NC, negative control group, in which birds fed diet which differed from the PC diet in that soyabean meal was substituted with maize by-products to contain 0 g/kg stachyose; S-4, S-5, S-6 and S-7, the treatment diets, in which the NC diet was supplemented with 4, 5, 6 and 7 g/kg of stachyose, respectively.
There was a linear reduction effect on the caecal indole level with the increase of the dietary stachyose level (P < 0·01). Linear and quadratic effects on the caecal skatole level (P < 0·01) were also observed. Based on the quadratic regression equation (Table 4), when the stachyose level was 10 g/kg, the skatole level was the lowest, but the Ra2 was relatively too low (0·16) to be reliable. So, based on the result of ANOVA, and combined with the linear model (Ra2 = 0·42), we could decide that the S-5 group was the best for the caecal skatole reduction.
Table 4. Regression relationship between dietary stachyose levels and caecal indole and skatole concentrations in broilers

* The extreme value is expressed as the stachyose level (g/kg).
Volatile fatty acids, lactate levels and pH value
The effects of the dietary stachyose level on caecal VFA, lactate levels and the pH value in broilers are presented in Table 3. The dietary stachyose level had an effect on pH value (P < 0·05), VFA and lactate levels (P < 0·01). The pH value in the NC group was the highest (6·23), but this pH value was not different from the S-4, PC or S-6 groups (P > 0·05). The lowest pH was observed in the S-5 group, which was lower than that in the NC group (P < 0·05), but there were no significant differences among the S-4, S-5, S-6, S-7 and PC groups (P > 0·05). The broilers in the stachyose-fed group had higher caecal acetate and propionate levels, compared with those in the PC and NC groups, and the propionate level in the S-6 and S-7 groups was higher than that in the S-4 and S-5 groups (P < 0·001). The butyrate level in the S-5 group was the highest (2·6 mg/g), followed by the PC, S-4, S-7, S-6 and NC groups. There were no differences in lactate level among the PC, NC, S-5 and S-6 groups (P > 0·05), but they were higher than that in the S-4 and S-7 groups (P < 0·001).
There were linear and quadratic effects on the pH value and lactate level (P < 0·05); quadratic effects on acetate, propionate and butyrate levels were also observed (P < 0·01; Table 5). When the stachyose level was 5·8 g/kg, the acetate level was the highest. The Ra2 of the regression equations of butyrate and lactate was too low to accurately determine the extreme level. Meanwhile, the extreme level of propionate regression equations was an imaginary number, so it is impossible to estimate the optimal stachyose level according to the propionate, butyrate and lactate levels.
Table 5. Regression relationship between dietary stachyose levels, and caecal pH, and organic acid concentrations in broilers

* The extreme value is expressed as the stachyose level (g/kg).
Hepatic CYP450 mRNA expressions
The effects of dietary stachyose level on CYP450 mRNA expression are presented in Table 6. The results indicated that for CYP1A2 and CYP2D6, there were no significant differences in the mRNA expression among groups (P > 0·05). There was an effect on CYP3A4 mRNA expression (P < 0·05), that is, the highest CYP3A4 mRNA expression was found in the S-7 group. Compared with the NC group, it increased by 230·98 % and there was a linear increase in the trend effect on CYP3A4 mRNA expression with the dietary stachyose level (P = 0·055).
Table 6. Effects of dietary stachyose levels on mRNA expression of hepatic cytochrome P450 in broilers (×10–3)*
(Mean values with their standard errors)

a,b Mean values within a row with unlike superscript letters were significantly different (P < 0·05).
* mRNA expression levels of hepatic CYP450 were examined by quantitative PCR. Analysis was performed on six birds per group. Relative gene expressions were determined using the 2–△△CT method.
† PC, positive control group, in which birds fed diet containing soyabean meal and contained 2·8 and 2·0 g/kg stachyose in the starter and grower, respectively; NC, negative control group, in which birds fed diet which differed from the PC diet in that soyabean meal was substituted with maize by-products to contain 0 g/kg stachyose; S-4, S-5, S-6 and S-7, the treatment diets, in which the NC diet was supplemented with 4, 5, 6 and 7 g/kg of stachyose, respectively.
Hepatic CYP450 enzyme activity
The effects of dietary stachyose level on the activity of hepatic CYP450 enzymes are presented in Table 7. The results indicated that there was no significant difference in CYP450 enzymatic activities among the groups (P > 0·05), and the highest enzyme activities of CYP1A2 and CYP2D6 were obtained in the S-5 group. A trend effect on CYP3A4 activity was observed (P = 0·077). Also, the linear and quadratic trend effects on the activities of CYP2D6 and CYP3A4 enzymes were observed (0·1 > P > 0·05), and a significant quadratic effect on CYP1A2 activity was observed (P < 0·05). However, it is impossible to estimate the optimal stachyose level based on the CYP1A2 activity because of the relatively too low Ra2 (–0·22) of the regression equation (y = –1·24x 2 + 0·73x + 1·05).
Table 7. Effects of dietary stachyose level on hepatic cytochrome P450 enzymatic activities in broilers* (IU/g)
(Mean values with their standard errors)

* Enzymatic activity was determined by ELISA method, analysis was performed on six birds per group.
† PC, positive control group, in which birds fed diet containing soyabean meal and contained 2·8 and 2·0 g/kg stachyose in the starter and grower, respectively; NC, negative control group, in which birds fed diet which differed from the PC diet in that soyabean meal was substituted with maize by-products to contain 0 g/kg stachyose; S-4, S-5, S-6 and S-7, the treatment diets, in which the NC diet was supplemented with 4, 5, 6 and 7 g/kg of stachyose, respectively.
Discussion
Effects of dietary stachyose levels on caecal skatole and indole concentrations in broilers
Skatole results from a multistep degradation of l-tryptophan by microbial activity, mainly in the caecum, followed by rectum and ileum of broilers(Reference Yang, Zhang and Liu1). The concentration of skatole and indole in caecum of broilers was also significantly higher than those in the excreta and rectal contents(Reference Wang, Guan and Yang23). Zhang(Reference Zhang24) reported that the older the broiler, the higher the concentration of skatole in the caecum. Therefore, the caecal contents of broilers were sampled to determine the levels of caecal skatole at the end of feeding trial, so as to reduce measurement error.
Recent studies suggested that the emission of odorant from broiler production may be reduced by dietary manipulation(Reference Sharma, Choct and Wu25,Reference Sharma, Choct and Dunlop26) . It has been shown that non-digestible carbohydrates reaching the large intestine are available for microbial fermentation. The skatole level depends on sufficient availability of fermentable carbohydrates throughout the entire large intestine to supply microflora with energy(Reference Jensen, Cox and Jensen27). Oligosaccharides are characterised as non-digestible carbohydrates and reach the large intestine undigested, making them available for microbial fermentation. Yang et al. (Reference Yang, Yin and Liu21) showed that broilers fed with oligosaccharides, especially 1·25 g/kg soyabean oligosaccharide (SBO), significantly decreased the excreta indole and skatole levels. Liu et al.(Reference Liu, Hou and Yang28) also concluded from an in vitro study that addition of 10 g/l of SBO into either caecal or rectal fermentation broth of broilers decreased the concentration of indole and skatole, as well as the pH value. The inclusion of 3·5–5·0 g/kg SBO to the diet had a decreasing effect on the excreta skatole of broilers(Reference Li29). Thus, SBO had a limited potential to reduce skatole level in the caecum or excreta depending on amount and fermentability of the SBO.
Stachyose is the major ingredient of fermentation gas and VFA production in SBO(Reference Lan, Williams and Verstegen12). As stachyose could only be utilised by the gut bacteria, the higher stachyose fermentation capability of the intestinal microflora may contribute to these results(Reference Jiang, Gong and Ma30). Yi(Reference Yi20) reported that there was a dose-response relationship between stachyose and the growth performance of broilers. Low dose (5 g/kg) showed a slight promotion effect, whereas high dose (20 g/kg) showed an inhibition effect. Hu et al. (Reference Hu, Zhang and Mai31) also indicated that a moderate level of stachyose (12·5 g/kg) added to the diet improved growth performance, digestive enzyme activities and distal intestinal morphology of juvenile turbot. High levels of dietary stachyose (25–50 g/kg) showed limited negative effects.
Our preliminary study of the project showed that adding 5 or 7 g/kg of stachyose to NC diet significantly improved the growth performance of broilers at 1–49 d of age (unpublished results). In this paper, the stachyose-fed group of broilers had a lower skatole level in the caecum, compared with the NC fed broilers; the caecal skatole concentrations in the PC, S-4, S-5, S-6 and S-7 groups were lower than those in the NC group by 42·28, 23·68, 46·09, 15·31 and 45·14 %, respectively. Additionally, the caecal indole levels in S-5 and S-7 groups also significantly decreased, and the best results were obtained in the S-5 group. Taken together these results, 5 g/kg of stachyose in diet was suggested. However, the caecal skatole concentration fluctuated with the rise of stachyose level. The possible explanation might be that the effect of stachyose level on skatole reduction is unstable. So, further studies are needed to elucidate the appropriate dose of stachyose.
Effects of dietary stachyose levels on caecal volatile fatty acids, lactic acid and pH levels in broilers
VFA and lactic acid are mainly derived from carbohydrate fermentation and partly from protein and amino acid degradation. The levels of VFA and lactic acid can change the intestinal pH value. Change in the pH may thus alter indole and skatole levels(Reference Jensen, Cox and Jensen32,Reference Jensen and Jensen33) . Therefore, the level of VFA and lactic acid is correlated with indole and skatole levels in the caecum. Macfarlane et al. (Reference Macfarlane, Allison and Gibson34) reported that the substrates used in bacterial fermentation would affect the production of VFA. Generally, the amount of VFA produced by protein as fermentation substrates was less than that produced by carbohydrates. In this paper, we showed that the pH value in the NC group was the highest, the lowest pH value was observed in the S-5 group and the linear correlation with the stachyose level was also observed. The broilers in the stachyose-fed had higher caecal acetate and propionate levels, and the butyrate level in the S-5 group was the highest. A low pH environment is conducive to the growth of Lactobacillus and reduces the growth of putrefying bacteria, thus achieving the effect of the skatole reduction.
Similar results were observed by Jiang et al. (Reference Jiang, Gong and Ma30), who reported that with the increase of stachyose level, the levels of acetic acid and total VFA in the caecal content of broilers significantly increased, while the caecal pH value decreased. This might be due to the beneficial effects of the degradation products of stachyose by intestinal microflora, such as VFA, which could up-regulate gene expression of digestive enzymes(Reference Sørensen, Penn and El-Mowafi35).
Effects of dietary stachyose levels on hepatic CYP450 mRNA expression and enzymatic activities in broilers
Skatole is produced in the gastro-intestinal tract by the microbial breakdown of l-tryptophan and enters the bloodstream after absorption through the intestinal wall. The hepatic clearance of skatole is conducted, ultimately resulting in excretion(Reference Rasmussen36). The liver is the main site of skatole metabolism. The hepatic degradation of skatole can be divided into two distinct phases. The phase I oxidation reactions were carried out by CYP450, and the phase II conjugation reactions were catalysed by glucuronic acid and sulphotransferases(Reference Wesoly and Weiler37). In the present study, the focus will be on the chicken versions of the CYP450. It is generally believed that diets can affect the activity of various liver isoenzymes, which, in turn, affect the metabolism of their substrates(Reference Sonawane, Coates and Yaffe38).
CYP450 monooxygenases are important in the metabolism of many therapeutic agents and endogenous metabolic reactions(Reference Hu39). Livestock or food-producing animals have hepatic CYP450 systems that are comparable with those in humans(Reference Antonovic and Martinez40). In vertebrates, the liver is the organ that is most abundant in CYP450. The CYP450 comprise a superfamily of enzymes that catalyse the metabolism of many drugs; especially CYPlA2, 2C9, 2C19, 2D6 and 3A4 are the most important(Reference Anzenbacher and Anzenbacherová41,Reference Al-Dosari and Parvez42) .
Most of the studies on the skatole metabolism of CYP450 in animals are on pigs; little research has been done on chickens. CYP450, which plays an important role in skatole metabolism in pigs, has not been found in chickens. So in this study, we chose three direct homologies of the chicken CYP450 family genes, as well as the same subgroups CYP450 in pig, to study the effects of stachyose level on CYP450 mRNA expression and enzymatic activities.
CYPlA2 participated in the skatole metabolism of humans and pig. It is also considered to be the most active CYP450 in human skatole metabolism(Reference Thornton-Manning, Appleton and Gonzalez9,Reference Matal, Matuskova and Tunkova43) . CYP2D6, the only protein-coding gene of the CYP2D subfamily(Reference Zanger and Schwab44), is also the only active CYP2D subgroup enzyme in human beings. It has been shown that skatole in human beings can be metabolised to a lower level(Reference Thornton-Manning, Appleton and Gonzalez9). CYP3A4 is the most abundant enzyme in CYP450. CYP3A4 is also the principal member of the CYP450 enzyme family responsible for T-2 toxin metabolism(Reference Lin, Chen and Xu45). These three enzymes account for approximately 4, 30 and 50 % of the total drug metabolism, respectively(Reference Wei, Wu and Xu46).
Several different CYP have been shown to catabolise skatole(Reference Rasmussen and Zamaratskaia7,Reference Wiercinska, Lou and Squires47) . The characterisation of CYP450 responsible for the production of specific skatole metabolites is of much interest, as it has been proposed that the production of certain metabolites, especially 6-OH-3MI, affects the rate of skatole clearance. As previous studies showed that some xenobiotics can affect the activity of CYP450 enzyme and mRNA expression. In our study, feeding stachyose to broilers resulted in a significant up-regulation of mRNA expression of the gene encoding CYP3A4 in the liver and increased with stachyose level. This indicates that CYP3A4 might be the key regulators that have a direct or indirect ability to catalyse the skatole metabolism. Squires & Lundström(Reference Squires and Lundström48) showed that when CYP2E1 mRNA expression was high in liver, skatole levels were low in fat. Wiercinska et al. (Reference Wiercinska, Lou and Squires47) indicated that CYP3A participated in pig skatole metabolism. However, no specific homotype was specified. Therefore, the increase in CYP3A4 mRNA expression was expected to promote the metabolism of hepatic skatole metabolite, so as to reduce the concentration of skatole in the blood and its deposition in the fat of broilers.
However, in our study, there was no significant difference in CYP1A2 and CYP2D6 mRNA expression among treatments. We also observed that there was no significant difference in CYP450 (1A2, 2D6 and 3A4) enzymatic activities among groups, but a significant trend effect on CYP3A4 enzymatic activity was observed. In addition, the linear and quadratic trend effects on the activities of CYP2D6 and CYP3A4 enzyme, as well as a significant quadratic effect on CYP1A2, were observed, suggesting that CYP3A4 and CYP1A2 enzymes had a greater effect on the skatole metabolism than CYP2D6.
In conclusion, caecal skatole level and hepatic CYP450 metabolising enzymes in broilers can be influenced by the stachyose level in the diet. The chicken is a good model for human nutrition and medicine. Thus, the present finding may be useful for humans and animals in improving health and reducing environmental pollution caused by skatole emissions.
Acknowledgements
The present study was supported by the National Natural Science Foundation of China (NSFC, grant nos. 31772618 and 31372328).
The authors’ contributions were as follows: H.-Y. L. and G.-Q. Y. conceived and designed the experiment, collected samples and revised the manuscript; X.-Y. Z., J.-Z. L. and H.-Y. L. conducted most of the experiments and analysed the data; H.-Y. L. drafted the manuscript; X. Z. participated in writing and editing the manuscript; G.-Q. Y. had the primary responsibility for the final content. All authors read and approved the final version of the manuscript.
The authors declare that there are no conflicts of interest.


