


Anaemia and vitamin A deficiency (VAD) are widespread public health problems associated with increased risk of morbidity and mortality, especially in young children(Reference Guilbert1). The Chinese Food and Nutrition Surveillance System documented that the prevalence of anaemia in pre-school children remained at 16–20 % in the 15 years from 1990 to 2005(Reference Chen, He and Fu2). Except for iron, other nutritional deficiencies, such as that of vitamin A, may also adversely affect haematopoiesis and lead to anaemia(Reference Fishman, Christian and West3). A national nutrition and health survey in 2002(Reference Li, Rao and Kong4) revealed an incidence of 45·1 % for marginal VAD and 9·3 % for VAD in Chinese children aged 3–12 years. At present, VAD is more serious among pre-school children in China(Reference Li, Rao and Kong4) because their diets mainly consist of rice with low iron availability and without preformed vitamin A or provitamin A.
High-dose vitamin A supplements are recommended as part of the treatment(Reference Ross5). However, clinical trials that examined the effect of a high dosage of vitamin A on children with diarrhoea or respiratory infections showed that it had either no efficacy(Reference Faruque, Mahalanabis and Haque6) or only minimum efficacy(Reference Julien, Gomes and Varandas7), or even adverse effects(Reference Mahalanabis, Lahiri and Paul8). Small doses of vitamin A given regularly might be a better strategy to improve VAD status and anaemia and reduce morbidity but they have been rarely tested.
Recently, several randomised controlled trials(Reference van Stuijvenberg, Kvalsvig and Faber9, Reference van Stuijvenberg, Dhansay and Lombard10) have shown micronutrient-fortified biscuits to be a feasible, practical and effective way to improve the micronutrient status of primary-school children from the poor rural community. However, there is as yet no research to evaluate the effect of biscuits fortified with different doses of vitamin A on serum vitamin A nutritional indices, Hb and the physical growth levels of pre-school children.
In the present study, we conducted a randomised controlled study to investigate the efficacy of biscuits fortified with different doses of vitamin A on improving serum vitamin A and Hb status, physical growth of pre-school children aged 3–6 years in a suburb in Chongqing, China. We hypothesised that providing lower doses of vitamin A through daily provision of fortified biscuits was as efficacious in reducing the prevalence of VAD and anaemia as a higher dose of vitamin A administration.
Subjects and methods
Subjects and ethical approval
This intervention programme was performed in Banan district of Chongqing from March to December 2002. Approximately 1000 pre-school children aged 3–6 years were randomly recruited from about thirty kindergartens in the region. The eligibility criteria for participation were as follows: (i) apparently good health; (ii) Hb concentration ≥60 g/l; (iii) C-reaction protein (CRP) <10 mg/l; (iv) parental or guardian’s approval for participating in all aspects of the study; and (v) parental/guardian’s agreement to avoid additional use of vitamin and mineral supplements during the investigation. Children with evidence of recent acute or chronic illnesses and/or Hb< 60 g/l were not included in the study and were referred to a local medical centre for treatment.
The primary outcome objective for the present study was the change between pre- and post-intervention in serum retinol concentration. A sample size of about 135 pre-school children per group was sufficient to allow the detection of a difference of 0·04 μmol/l in serum retinol concentration, 5·3 % prevalence of VAD and 13·0 % prevalence of anaemia among the four interventions over 3 months with 90·0 % power and α = 0·05 for two-sided one-way ANOVA. Considering the loss of children over the duration of the study, we initially managed to recruit more than 200 children per group. However, the primary outcome measures including analyses of micronutrient status of blood and anthropometric indices before and after intervention were obtained from 580 pre-school children, due to the loss to follow-up in the present trial.
Informed written consent was obtained from the parents/guardians. The enrolment and research plan were reviewed and approved by the institutional ethics committee of the Children’s Hospital of Chongqing Medical University in Chongqing, China.
Information on the socio-economic and demographic parameters of the children and their families was collected.
Intervention
The present study used fortified biscuits directly for oral application with dairy products, such as bean milk or soup. The biscuits of all four packages were similar in macronutrient composition (71·3 g carbohydrate, 8·0 g protein, 16·0 g fat, 2·2 g fibre and 1856·8 kJ per 100 g biscuit) and were indistinguishable in taste, colour and packaging, except for the coded numerical labelling. Package I biscuits contained 30 % of the recommended daily intake (RDA; set by the Chinese Nutrition Society) for vitamin A (500 IU as dry vitamin A acetate) per piece, and package II had 100 % of the RDA for vitamin A (1666 IU as dry vitamin A acetate) per biscuit piece. Package III contained biscuits with supplements of 20 000 IU of vitamin A (as dry vitamin A acetate) per piece, while package IV had no vitamin A and was used as placebo biscuit. All of the biscuits were provided by Shanghai Danone Biscuits Foods Co., Ltd (Shanghai, China) (2002–2003) and the concentration of fortification was determined by Shanghai Roche Pharmaceuticals Ltd (Shanghai, China).
The study was designed as a double-blinded, randomised and positive-controlled trial. With the help of child health-care workers, the children who met the eligibility criteria in all of the nurseries were randomly assigned to one of the four groups within the sex and age strata to help ensure sex and age balance of treatment allocation. The RAND function of Excel (Microsoft, Redmond, WA, USA) was used to generate computer randomly permutated codes. Pre-school children in groups I and II were given fortified biscuits packages I and II once a day for 9 and 3 months, respectively. Children in group III were provided with biscuit package III once a week for the interval time for 3 months. Lastly, children in group IV received a 200 000 IU vitamin A capsule (as retinyl ester) just once initially and then biscuit package IV for the rest of the time for 3 months.
Fortified biscuits were given to each child at afternoon snack time, 5 d/week during the study period for all groups. Children in group III were given biscuit package III only on every Monday afternoon. No intervention took place during school holidays or public holidays, and the biscuits were provided for a total of 59 school days (the equivalent of 12 weeks). The investigators, food preparers, teachers, outcome assessors and children were not made aware of the intervention assignment for the duration of the study until after the completion of data analysis.
Blood sample collection and biochemical measurement or assessment
At the beginning and at the end of the 3-month period (children in group I who received two measurements or assessments at the end of the 3-month period were designated as group I-3, and those who received measurements at the end of the 9-month period were designated as group I-9), two or three (for children in group I) blood samples (about 1·5 ml) were collected by venepuncture of an antecubital vein from each subject before breakfast. A volume of 0.5 ml was drawn into a container with heparin to measure Hb by the hemiglobincyanide method(11) (MAKER, China). The concentrations of serum retinol-binding protein (RBP) and prealbumin (PA) were measured by ELISA(Reference Tanumihardjo12) with commercial ELISA kits (Sunbiote, China). CRP was measured by particle-enhanced immunoturbidimetry(Reference Eda, Kaufmann and Roos13) (catalogue no. 67274; Orion Corporation Orion Diagnostica, Finland). Serum retinol concentration was determined by using HPLC following the method of Miller and Yang with slight modification(Reference Miller and Yang14). All of the biochemical indices were measured by experienced examiners in the Pediatric Laboratory of Chongqing Medical University.
Anthropometric measurements
Anthropometric examinations in any one group were conducted by the same trained anthropometrist (a total of four) from the Chongqing Children’s Hospital at the baseline and follow-up (3- or 9-month) time points using standardised techniques to eliminate intra-examiner error. By using reference data from the US National Center for Health Statistics/WHO (2005), Z-scores were calculated for height-for-age (HAZ), weight-for-height (WHZ) and weight-for-age (WAZ). A cut-off of less than minus two standard deviations (−2 sd) was used to define stunting (HAZ <−2) and wasting (WHZ <−2), while a cut-off of more than plus two standard deviations (+2 sd) was used to define obesity (WHZ >+2)(Reference Kuczmarski, Ogden and Grummer-Strawn15). All indices were computed using the ANTHRO software (Anthro 2005 PC) recommended by WHO (http://www.who.int/childgrowth/software/en/).
Simultaneously, assessment of symptoms and signs of VAD (xerophthalmia, Bitot’s spots and/or night blindness) of pre-school children was performed by paediatric oculists.
Definition of outcomes
The prevalence of deficiency for some biochemical indices was expressed as the percentage of pre-school children below the cut-off value. Prevalence of anaemia was determined according to the WHO criteria, i.e. Hb < 110 g/l for 5-month to 6-year-olds and Hb < 115 g/l for 6–11-year-olds(16). According to the WHO criteria(17), a serum retinol concentration of <0·7 μmol/l was classified as VAD and values between 0·70 and 1·05 μmol/l were defined as marginal vitamin A deficiency (MVAD). CRP levels of >10 mg/l indicated infection or inflammation as recommended by the manufacturer (Roche Diagnostics).
Statistical analysis
Using the Kolmogorov–Smirnov goodness-of-fit test, the distribution of each set of data was tested for normality prior to analysis. Data were presented as the mean and sd for normally distributed variables or median (25th, 75th) for skewed distribution variables and, when necessary, data were normalised using natural-log transformations. Tests of significance were two-tailed and P < 0·05 was considered statistically significant. Paired Student’s t tests were used to compare paired data with normal distribution and homogeneous variance in the before–after intervention pairs of each group, while paired Wilcoxon sign-rank test was used for skewed distribution data. The χ 2 test was used for categorical variables, with a Bonferroni correction for multiple comparisons among multiple groups. In order to compare the different effects among the four interventions, we performed multiple comparisons of the changes of parameters over the 3-month intervention (P < 0·05 set for statistical significance) with Student–Newman–Keuls (SNK) test (normal and homogeneous data) or SNK rank test (skewed data). For SNK test or SNK rank test, the SNK grouping letters were provided. Data were analysed using the SAS for Windows statistical software package version 8·1 (SAS Institute Inc., Cary, NC, USA).
Results
Seven hundred and fifty-three children met the inclusion criteria (177 for group I, 173 for group II, 209 for group III and 194 for group IV). About 23·0 % (173/753) dropped out during the course of the study. The dropout number was forty-two (four for blood drawing failure and thirty-eight for moved during trial) for group I, thirty-two (three for blood drawing failure and twenty-nine for moved during trial) for group II, forty-four (two for blood drawing failure and forty-two for moved during trial) for group III and 55 (six for blood drawing failure and forty-nine for moved during trial) for group IV, respectively. Thus, primary outcome measures including analyses of micronutrient status of blood and anthropometric indices at the end of intervention were obtained from 580 pre-school children (135, 141, 165 and 139 from groups I, II, III and IV, respectively; Fig. 1). Retrospective data documented daily by caregivers indicated about 95 % compliance, suggesting that at least 95 % of the pre-school children took the biscuits during the study period.
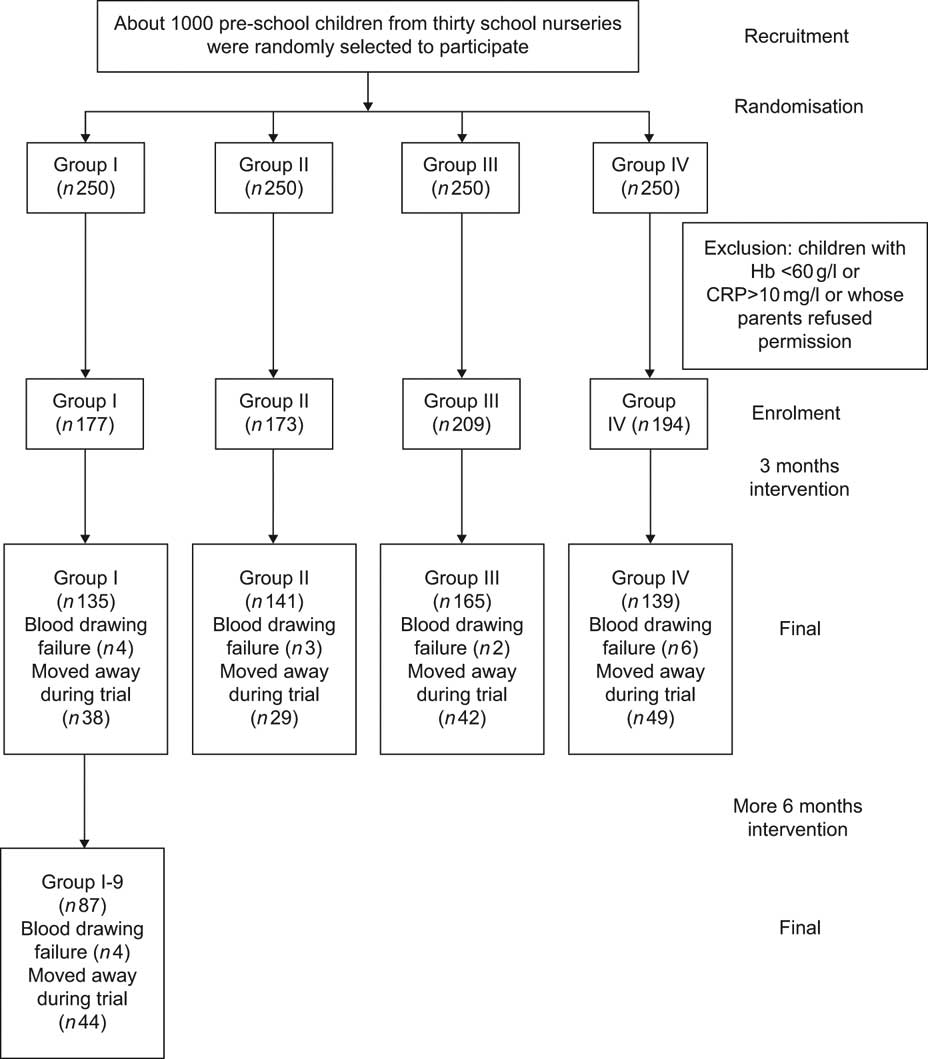
Fig. 1 Trial profile showing the number of participants randomly assigned, completing the trial, and analysis of the primary outcome (CRP, C-reactive protein)
Baseline characteristics
The demographic characteristics of the children studied are given in Table 1. There was no significant difference in clinical characteristics among the treatment group children who completed the study. Similarly, no marked difference in the parameters mentioned above was found between the children who completed the study and those who dropped out (P > 0·05).
Table 1 Demographic characteristics of treatment groups at baseline and comparison between the subjects who completed the study and who did not

HAZ, height-for-age Z-score; WHZ, weight-for-height Z-score.
No xerophthalmia, Bitot’s spots, and/or night blindness were observed.
*There was no significant difference in the parameters by treatment group in the children who completed the study, using the Student–Newman–Keuls test for the comparison of age, the χ 2 test for the comparison of categorical variables with a Bonferroni correction and Fisher’s exact test for the comparison of HAZ and WHZ.
†There was no significant difference in the parameters between the total children who completed the study and the children who dropped out, using Student’s t test for the comparison of age, the χ 2 test for the comparison of categorical variables and Fisher’s exact test for the comparison of HAZ and WHZ.
‡Regular consumption: consumption days of certain foods were more than or equal to 3d in a week.
Effects of intervention on the prevalence of vitamin A deficiency and anaemia
At baseline, about 7·6 % (57/753) of the children had VAD and 34·8 % (262/753) of them had MVAD. The prevalence of anaemia was 26·6 % (200/753) before intervention and 2·0 % (15/753) of the children had both VAD and anaemia. No significant difference was observed for the prevalence of VAD (χ 2 = 0·97, P = 0·81) and anaemia (χ 2 = 4·89, P = 0·18) at baseline among the treatment groups. After the 3-month intervention, the four ratios mentioned above decreased to 1·6 % (9/580), 30·5 % (177/580), 10·3 % (60/580) and 0·2 % (1/580), respectively. Meanwhile, the prevalence of VAD and anaemia in all groups, including the children with the 9-month supplementation, decreased significantly (P < 0·05; Table 2). No significant difference in the prevalence of VAD between groups after the intervention was found with the multiple comparative Fisher’s exact test (Table probability = 0·06, P = 0·36). But the prevalence of anaemia after intervention in group I-9 was the lowest (P < 0·0045) compared with the other four groups and no statistical difference in anaemia after intervention among the other four groups (P > 0·05) was observed with multiple comparative χ 2 tests.
Table 2 Comparison of prevalence of VAD and anaemia in treatment groups from baseline to 3-month follow-up for all groups and to 9-month for group I

VAD, vitamin A deficiency.
*Group I-3 and group I-9, 3- and 9-month follow-up of group I, respectively.
†No significant difference in the prevalence of VAD or anaemia was found at baseline in the treatment groups with the χ 2 test.
‡Comparison of the prevalence of VAD or anaemia between groups after intervention with the multiple comparative χ 2 test for adjusted α′ = 0·0045. Values within a row with unlike superscript letters (a,b) were significantly different.
§Comparison of the prevalence of VAD or anaemia between baseline and after invention in treatment groups.
||χ 2 test.
¶Fisher’s exact test.
Effects of intervention on serum biochemical indices and anthropometric measurements
The concentrations of serum retinol, Hb, PA and RBP and anthropometric measurement Z-scores, including HAZ, WAZ and WHZ, at baseline and at the end of the study, as well as the change over 3 or 9 months of intervention, are summarised in Tables 3 and 4. At baseline, no significant difference in these indices was observed among the four groups (P > 0·05). After the 3-month supplementation, the concentrations of serum retinol, RBP, HAZ, WAZ and WHZ in all groups increased markedly compared with the baseline (P < 0·05), but those of PA and Hb increased only in groups II, III and IV. Meanwhile, the increase in serum retinol in children of group III was the highest compared with the other three groups, while that of group I was the lowest (both P < 0·05). No statistical difference in the change of serum retinol was found between the group II and group IV children (P > 0·05). Moreover, the increases in Hb, PA, HAZ and WHZ in group I were the lowest in comparison to the other three groups (P < 0·05) and there was no significant difference in the changes in Hb, PA, HAZ and WHZ among groups II, III and IV (P > 0·05). No significant difference in the changes in RBP and WAZ was observed among the four groups (P > 0·05).
Table 3 Comparison of biochemical indices in treatment groups from baseline to 3-month follow-up for all groups and to 9-month for group IFootnote *

PA, prealbumin; RBP, retinol binding protein; SNK, Student–Newman–Keuls test.
* Data are presented as mean and sd for normally distributed variables or median (25th, 75th percentiles) for skewed distribution variables.
† Group I-3 and group I-9, 3- and 9-month follow-up of group I, respectively.
‡ At baseline, no significant difference was observed among the four treatment groups (P > 0·05).
§ SNK rank test or SNK test for multiple comparisons; within a row, unlike letters (A, B, C, D) indicate significant difference.
|| After 3- or 9-month supplementation, the concentrations increased markedly compared with baseline.
Table 4 Comparison of anthropometric indices in treatment groups from baseline to 3-month follow-up for all groups and to 9-month for group IFootnote *

HAZ, height-for-age Z-score; WAZ, weight-for-age Z-score; WHZ, weight-for-height Z-score; SNK, Student–Newman–Keuls test.
* Data are presented as median (25th, 75th) as variables were non-normally distributed.
† Group I-3 and group I-9, 3- and 9-month follow-up of group I, respectively.
‡ At baseline, no significant difference was observed among the four treatment groups (P > 0·05).
§ SNK rank test or SNK test for multiple comparisons; within a row, unlike letters (A, B) indicate significant difference.
|| After 3- or 9-month supplementation, the levels increased markedly compared with baseline.
Blood and anthropometric measurements were obtained from only eighty-seven children in group I at the end of 9-month supplementation (group I-9) because of children dropping out. However, the baseline biochemical indices and anthropometric measurement Z-scores in the eighty-seven children were not statistically different compared with the other groups at baseline (P > 0·05). Our data showed that the concentrations of serum retinol, PA, RBP, Hb, HAZ, WAZ and WHZ increased significantly after 9-month supplementation (P < 0·05). The changes in PA and Hb at the end of 9-month supplementation were the highest compared with the other four groups at the end of 3-month supplementation (P < 0·05), but the changes in RBP were the lowest (P < 0·05). The change in serum retinol was the same as that at the end of 3-month supplementation in group I (group I-3; P > 0·05). No significant changes in HAZ and WHZ at the end of 9-month supplementation were observed compared to groups II, III and IV (P > 0·05), but they were higher than that in group I-3 (P < 0·05). However, the levels in WAZ at the end of 9-month supplementation were similar to those of other groups (P > 0·05).
Discussion
In the present study, we found that the intervention of biscuits fortified with vitamin A at 100% of the RDA daily for 3 months had the same effect on the improvement of VAD, anaemia and physical growth and development as did the weekly 20 000 IU or single 200 000 IU administration in pre-school children in a suburb of Chongqing, China.
Effects of intervention on the prevalence of VAD and anaemia
Ethical consideration precluded the use of an unsupplemented placebo group; therefore we just used a positive-controlled strategy that enabled effective comparison of the new, different doses of a vitamin A supplementation schedule on vitamin A and anaemia status.
This randomised double-masked population-based field interventional trial with a positive control group showed that providing lower doses through fortified biscuits provided daily or weekly was as efficacious in reducing the prevalence of VAD and anaemia as high-dose vitamin A administration. However, the present study did show the similar and greater efficacies of a daily low dose of vitamin A administration with extended duration in reducing the incidence of VAD and anaemia compared with the mass-dose vitamin A given. The major strength of the present study was the rigorous design and statistical analysis and the careful standardisation of the experimental measurement. To our knowledge, this is the first clinical trial to simultaneously exploit the effect of different doses of vitamin A intervention, including daily 30 % RDA, daily 100 % RDA, weekly 20 000 IU and single 200 000 IU, on the prevalence of VAD and anaemia in pre-school children.
The WHO recommends that vitamin A supplements should be given when children are vaccinated, and the currently recommended doses are 100 000 IU at the age of 6–11 months and 200 000 IU every 3–6 months at the age of ≥12 months(18). There is no clear evidence, however, that a large dose is better than a smaller one. Serial population-based field trials(Reference Donnen, Dramaix and Brasseur19–Reference Benn, Martins and Rodrigues23) have studied the effect of different administered doses of vitamin A on children’s mortality and/or morbidity. Previous researches have implied that a low dose of vitamin A could always lower the mortality or the morbidity of children compared with a high dose and that the effect of supplementation might not be exclusively due to the prevention of vitamin A deficiency(Reference Benn, Bale and Sommerfelt24). However, no integrated study has been performed to compare the effect of different doses of vitamin A supplements on the prevalence of VAD and anaemia in pre-school children, except for some researches about mass dose of vitamin A supplementation.
Recently, Darboe et al.(Reference Darboe, Thurnham and Morgan25) pointed out that no difference in serum retinol level was found as one of the primary outcomes for high-dose vitamin A v. the WHO schedule, while the trial had shown possible adverse effects of higher doses of vitamin A consistent with results from Been and colleagues(Reference Benn, Martins and Rodrigues23). Another study(Reference Idindili, Masanja and Urassa22) also proved that a low dose of vitamin A (22 500 IU) administered to infants is similar to substantially enhancing the biochemical vitamin A status of infants at the age of 6 months compared with a high dose of vitamin A supplement (45 000 IU) and some vitamin A capsules degraded towards the end of the study. Moreover, Sivan et al.(Reference Sivan, Alwin Jayakumar and Arumughan26) documented that administration of 10 ml red palm oil (including 800 retinol equivalent retinol) did not offer a substantial improvement in the serum retinol level over a 5 ml daily dose (including 400 retinol equivalent retinol). One study(Reference Sazawal, Dhingra and Deb27) reported that the intervention of a low dose of vitamin A did not improve the serum retinol status of children, but that was without any high-dose vitamin A intervention group for comparison. A similar research(Reference Alarcon, Kolsteren and Prada28) study also indicated that a low-dose vitamin A supplementation had no effect on the increase of Hb response. Although a field trial(Reference Zimmermann, Biebinger and Rohner29) about vitamin A supplementation suggested that a high dose of vitamin A supplement could significantly improve serum retinol, mean Hb level and reduce the prevalence of anaemia compared with the control group, this trial lacked a low-dose vitamin A group as a control.
Our data indicated that the weekly administration of 20 000 IU of vitamin A supplement was most efficacious on the change of concentration of serum retinol. However, this dosage was also the most cumulative dose (240 000 IU in total) compared with the other groups and a long-term use of such dose might increase the risk of vitamin A toxicity. Though daily 30 % RDA, 100 % RDA and a single dose of 200 000 IU of vitamin A supplement had similar effects on the improvement of VAD, the former two supplement styles, based on the lower risk of toxicity of the RDA, might be the predominant doses for long-term intervention.
To our knowledge, there is no other study investigating the effect of different vitamin A supplement doses on vitamin A nutriture indicators, such as PA and RBP. In the present study, we found that the different doses of vitamin A had almost no effect on the concentrations of PA and RBP, suggesting that these indicators are buffered by the normal hepatic homoeostatic regulation of retinol stores and distribution, and hence are only effective at the extremes of vitamin A status. Nevertheless, they continue to be indicators of vitamin A status recommended by the WHO and the International Vitamin A Consultative Group(Reference Tanumihardjo12), and help to confirm that the population we studied had mild vitamin A deficiency, as evidenced by about 7·57 % prevalence of values below 0·7 μmol/l in pre-school children.
Remarkably, our findings were in partial agreement with some observations that single-dose supplements, repeated-dose supplements and high vitamin A intake do not alter retinol bioavailability; conversely, such intakes are associated with greatly increased exposure to toxic metabolites of vitamin A, such as retinyl palmitate, 13-cis-retinoic acid and 13-cis-4-oxo-retinoic acid(Reference Hartmann, Brors and Bock30). The well-known phototoxicity and photomutagenicity of these compounds, which are linked to the generation of reactive oxygen species(Reference Yan, Xia and Cherng31), could be of concern and osseous side-effects have also been shown in children and adults treated with 13-cis-retinoic acid(Reference DiGiovanna32).
Our data also indicated that the daily 30 % RDA vitamin A with 9-month supplementation seemed to be more effective in decreasing the prevalence of anaemia and improving the Hb level. However, considering the various factors that might affect the results in the duration, such as the growth of the children with some possible changes in vitamin A and Hb status, diet and diseases, etc., we could not conclude whether 30 % RDA vitamin A with 9-month intervention style was the best. Further studies are required to compare the effects of different doses of vitamin A intervention for a long equal duration, to approach a more prominent way to improve anaemia.
Effect of intervention on anthropometric measures
The results showed that compared with pre-treatment, linear growth was similarly increased significantly for all of the pre-school children in the five supplement groups. Therefore, fortified biscuits might not only prevent the deterioration of anthropometric status but also improve it. Comparisons did not show the additional effect of a mass dose of vitamin A on anthropometric measures when contrasted with weekly 20 000 IU and daily 100 % RDA supplements. However, contrary to our data, some other studies have suggested that mass-dose vitamin A had no effect on children’s anthropometry, growth velocity, Z-scores, or body composition compared with the placebo-controlled group(Reference Sarni, Kochi and Ramalho33–Reference Rahman, Tofail and Wahed35).
Measurement of the dose that gives the maximum reduction in the prevalence of VAD and anaemia and/or the increase of physical growth is difficult and without the knowledge of the mechanisms by which the reduction in VAD and anaemia is achieved, many large-scale empirical trials are needed. Potential adverse effects of vitamin A supplementation are difficult to predict and surrogate predictors might assist in tailoring supplementation in different environments.
There are some limitations in the current study. The effects of fortified biscuits on anthropometric status need to be investigated further and protective packaging of the biscuits for oral application must also be used. Furthermore, because of the limited design of the original protocol and the inadequate amount of blood samples obtained from these pre-school children, we did not simultaneously evaluate some other confounding factors, such as seasonal components and other essential nutrients (serum zinc, iron, or unsaturated fatty acid, etc.), which are capable of affecting anaemia and physical growth. Measuring these micronutrient levels will be an important aspect in future studies. In addition, regardless of the investigation of the regular consumption of milk, liver, egg and deep-coloured vegetables, we did not measure dietary intakes of nutrients by 24 h recall questionnaires, which might lead to insufficient evaluation of the effect of pre-school children’s dietary habits on their nutritional and growth status.
In summary, our results indicate that consumption of vitamin A-fortified biscuits with daily 100 % RDA for 3 months has the same effect on the improvement of VAD, anaemia and physical growth and development as did the weekly 20 000 IU or single 200 000 IU administration in pre-school children in a suburb of Chongqing, China.
Acknowledgements
The present study was supported by grants from the SIGHT AND LIFE Research Institute, a humanitarian initiative of DSM, Municipal Education Commission, Chongqing, China, and grants from the National Natural Science Foundation of China (no. 30830106 and no. 30600495). The authors do not have any possible conflicts of interest. X. Zhang did the project design, data acquisition, analysis and interpretation, article draft and revision; K. Chen did the project design, data acquisition, analysis and interpretation, article draft and revision; P. Qu did the project design, data analysis and interpretation and technical assistance; Y-X. Liu did the project conception and design, data analysis and interpretation and general supervision; T-Y. Li did the project conception and design, data analysis and interpretation, article draft and revision and general supervision. The authors thank all the children and their parents for participating in the study. The authors also thank the health-care workers in Banan Health Center for Women and Children of Chongqing, China. The authors are grateful to Tian Weiming, Wang Wuli and Liu Guanjun for their diligent assistance. The authors are also grateful for the kind assistance of Shanghai Danone Biscuits Foods Co., Ltd (Shanghai, China) and Shanghai Roche Pharmaceuticals Ltd (Shanghai, China).


