Readymade parenteral nutrition (PN) products are typically presented without vitamins and trace elements. For patients receiving readymade PN, the trace elements and water-soluble and fat-soluble vitamins are either added to the PN bag or infused separately as recommended by the British Pharmaceutical Nutrition Group(1). When given as a separate intravenous (IV) infusion in a small volume of fluid, there is significant variation in practice regarding infusion time. When both vitamins and trace elements are combined into a small volume in this way, there is potential for them to interact, leading to a loss of vitamin activity(Reference Gibbons, Allwood and Neal2); so if it is not possible to give vitamins separate from the trace elements(Reference Berger and Shenkin3), then a fast infusion might be preferred. A contrasting view is that a fast infusion could lead to the saturation of tissue transport mechanisms, resulting in increased urinary losses, as has been seen in studies where very large doses of Cu, Se and Zn were used(Reference Berger, Cavadini and Chiolero4). It is unclear whether this phenomenon occurs with the small doses used for meeting patients’ daily requirements as part of PN.
Cu, given intravenously as copper chloride, is mostly excreted via the biliary system rather than the urine. IV Cu is rapidly bound to albumin for transport to the liver, where there are large stores, or it is incorporated into caeruloplasmin with daily turnover of about 0·5 mg. Urinary excretion does appear to increase with high doses, but the total urinary loss is still quite low. For example, one study gave 4–9 μg of Cu as a fast IV injection, and <1 % of the dose appeared in the urine over the next 72 h(Reference Tauxe, Goldstein and Randall5).
Similarly, Mn has mostly biliary excretion. Mn, given intravenously as manganese sulphate or manganese chloride, rapidly disappears from the plasma and is absorbed into the tissue. Mn turnover rates vary widely (from days to weeks) between individuals(Reference Davidsson, Cederblad and Lönnerdal6). About 40 % of the dose is lost via the biliary system, but this varies with Mn status(Reference Malecki, Huttner and Greger7). Only small amounts of Mn are excreted in the urine, and this does not appear to be affected by dose or infusion time.
In contrast, the main route by which Se is lost from the body is via the urine. Se is given intravenously as sodium selenite and has a biphasic action with brief pro-oxidant effects from free Se, transitioning to an antioxidant effect after incorporation into selenoenzymes such as glutathione peroxidase(Reference Vincent and Forceville8); Se is stored in erythrocytes, liver, spleen and heart. Less than 1 % of plasma Se is present as free Se; about 10 % is carried by albumin(Reference Manzanares and Hardy9) and the remainder is protein-bound such as in selenoenzymes. In one animal study, urinary losses increased after a rapid IV bolus but not during continuous infusion(Reference Wang, Forceville and Van Antwerpen10). Recent human studies using large pharmacological doses of Se in the critically ill did not measure urinary losses but found that large doses had little effect on blood Se levels(Reference Angstwurm, Engelmann and Zimmermann11).
Urinary losses of Zn may depend on the dose and on Zn status. Parenterally administered Zn, given as zinc chloride or zinc sulphate, is cleared rapidly (in hours) from the plasma with 400–500 mg turnover daily between plasma and tissues; <0·1 % of body Zn remains in the bloodstream(Reference King, Shames and Woodhouse12). The clearance rate appears to be determined by Zn status(Reference Vale, Leite and Alves13) with Zn deficiency causing an increase in turnover rate but a decrease in the amount of each turnover, which would then be expected to reduce urinary losses(Reference Prasad14). A rapid IV dose of 8 mg Zn (described as an ‘overload dose’) caused a 20 % increase in 24-h urine Zn in one study(Reference Maldonado, Gil and Fernández15). In diabetes, usual renal losses of Zn may be higher (e.g. double normal)(Reference Maldonado, Gil and Fernández15).
Fe is not normally lost in the urine in significant amounts, but urinary losses of IV Fe depend on the form in which it is given, as the commonly used Fe–carbohydrate complexes vary in molecular weight. IV Fe–carbohydrate complex travels through the blood vessels of the liver, spleen and bone marrow where the phagocytes of the reticuloendothelial system remove the complex from the plasma in an apparently saturable process(Reference Danielson16). Within the phagocytes, Fe is removed from the core of the complex, and is taken up by ferritin for storage, or by transferrin. Larger-molecular-weight complexes (such as iron dextran) are more stable; the smaller the particle size, the less stable the preparation and the more rapid the release of Fe, which is undesirable as it can result in the saturation of transferrin, slower clearance from plasma and a sudden high dose of labile pro-oxidative Fe(Reference Geisser and Burckhardt17) with greater losses in the urine(Reference Danielson16).
Similarly, Cr losses may depend on the form in which it is given. Cr turnover is slow, with prolonged tissue and bone retention(Reference O’Flaherty18). IV Cr easily binds to transferrin, taking up one of the Fe sites, and a large proportion of circulating Cr is found in this form. Stimulated by insulin, transferrin moves into cells via a transferrin receptor, where Cr becomes bound to a protein, chromodulin, which then returns to the bloodstream. Only chromodulin-bound Cr can be lost in the urine(Reference Clodfelder, Upchurch and Vincent19). Perhaps 20 % of an IV dose might be excreted in the urine, but the proportion lost in the biliary system depends on the form of Cr given(Reference Cikrt and Bencko20). Urinary Cr losses are greater in diabetes, insulin therapy and with any high carbohydrate load that stimulates extra insulin, since insulin then promotes Cr uptake to cells and binding to chromodulin(Reference Clodfelder, Upchurch and Vincent19). Increasing transferrin saturation with Fe would also affect Cr status by competing with Cr for transport into the cell – thus, Cr losses might be affected by the form in which IV Fe is given.
Overall it appears that infusion time has a potential to affect urinary losses of Zn, Se and (in diabetes or insulin resistance) Cr, but this has not been studied in humans using the small daily dose used in everyday practice. The present study aimed to quantify urinary losses comparing a fast (1 h) v. a slow (10 h) infusion of a 1-d dose of six trace elements.
Methods
Enrolment and consent
Patients starting PN in the intensive care unit (ICU) were screened for eligibility. Patients were excluded if they were malnourished (Subjective Global Assessment ‘B’ or ‘C’), had impaired renal function (estimated glomerular filtration rate < 60), were under 18 years of age or pregnant or lactating. Each eligible patient (or a responsible relative) provided written consent to participate. The study was approved by the hospital’s ethics review committee.
Intervention
A 1-d dose of parenteral vitamins and trace elements was used for each infusion following the Australasian Society for Parenteral and Enteral Nutrition recommendations for adults(Reference Osland, Ali and Nguyen21,Reference Osland, Ali and Isenring22) . After the baseline day of enrolment, when no micronutrients were given, patients received a standard vitamin and trace elements bag (Cernevit and CCADTEN in 100 ml 5 % dextrose; Baxter Australia; see Table 1 for composition) over the two infusion times (1 v. 10 h) in random order on two different days with a washout day after each dose; see Fig. 1 for study procedure timeline. A 24-h urine collection, in acid-washed preservative-free bottles, commenced on the day of enrolment and continued for 5 d. Blood samples were obtained each morning as part of routine ICU care. Urine and blood trace element levels were tested each day of the study in the hospital’s central laboratory using inductively coupled plasma MS. For each patient, factors that can affect trace element absorption, metabolism or excretion were recorded such as diabetes, diarrhoea or a concurrent prescription of diuretics, insulin, phenytoin or antibiotics.
Table 1. Composition of the parenteral micronutrient additive used in the study
Fig. 1. Study procedure timeline.
Statistics
Regression analysis within the framework of generalised estimating equations, using SPSS version 21 (IBM Australia) was used to compare the daily urinary losses between the two different infusion times and to identify whether there was a significant influence from the order in which each patient received the two infusions. For each trace element, the adjusted regression equations controlled for the covariates of the subjects’ baseline trace element loss, and for the order in which each subject received the two infusions. A P value < 0·05 was considered significant for all tests. Data from a previous pilot study(Reference Ferrie23) indicated that for 90 % power, recruitment would require thirty-three subjects to detect a difference in daily Zn loss of 6 (sd 10) mg; twenty-four subjects to detect a difference for Se loss of 0·4 (sd 0·6) μg; and twenty-nine subjects to detect a difference for Cu loss of 0·2 (sd 0·4) μg. The study, therefore, aimed to recruit forty people to allow for dropouts, missing values and sample losses.
Results
Forty patients consented to participate in the study; one subsequently discontinued after becoming anuric (see Fig. 2). One further patient had incomplete urine collection, but this result was averaged over 24 h and included in the analysis. Table 2 shows the study patient characteristics.

Fig. 2. Study screening and enrolment. ICU, intensive care unit.
Table 2. Study patient characteristics (Mean values and standard deviations; numbers of patients)
There was a wide variation between individuals in trace element losses, as expected. For each individual patient, the baseline trace element losses were strongly predictive of the losses after each infusion. Blood levels of all trace elements increased during the 5 d of the study, and the increase was significant (P < 0·05) for Cu, Cr and Se, which all increased by 20–50 % over the study period; and for Zn it increased about 80 % over the study period; see Fig. 3. However, the order in which a patient received the two infusions had no statistically significant influence on the results (P > 0·05), suggesting that urinary losses were not strongly associated with the blood levels, and that one washout day was sufficient to show the total losses after each infusion.
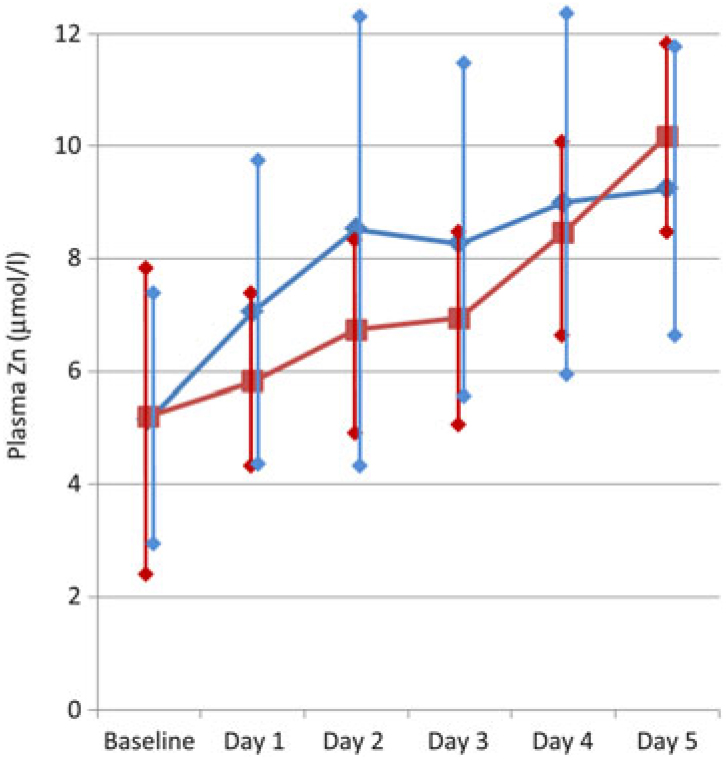
Fig. 3. Change in serum zinc over the 5-d study period, for the patients who received the 1 h infusion first (–♦–) and for the patients who received the 10 h infusion first (–▪–). Values are means, with standard deviations represented by vertical bars.
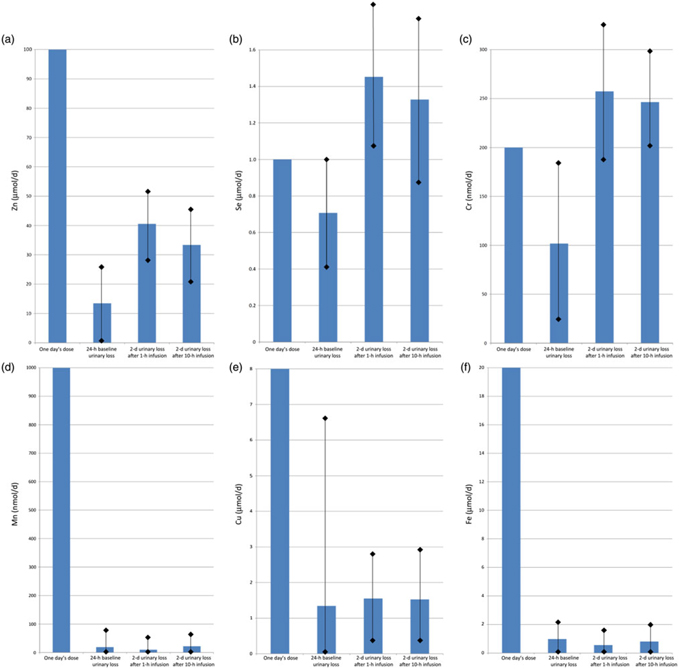
Fig. 4 shows the baseline (1 d) and post-infusion (2 d) urinary losses of each trace element, compared with the dose given. For Zn, one day’s requirement was provided as a dose of 100 μmol in each infusion, and urinary loss over the next 2 d was mean 40·6 (sd 23·8) μmol after the fast (1 h) infusion v. 33·4 (sd 25·4) μmol after the slow (10 h) infusion (P = 0·01). Se, Cr and Cu also had trends towards greater losses with fast infusion, but these were not statistically significant (P > 0·05): for Se, one day’s requirement of 1 μmol was given in each infusion, and urinary loss over the next 2 d was 1·5 (sd 0·6) μmol after fast infusion v. 1·3 (sd 0·5) μmol after slow infusion; for Cr, a dose of 200 nmol was given, and urinary losses were 257 (sd 92) nmol fast v. 246 (sd 107) nmol slow; for Cu, a dose of 8 μmol was given, and urinary losses were 1·6 (sd 1·4) fast v. 1·5 (sd 1·3) μmol slow.
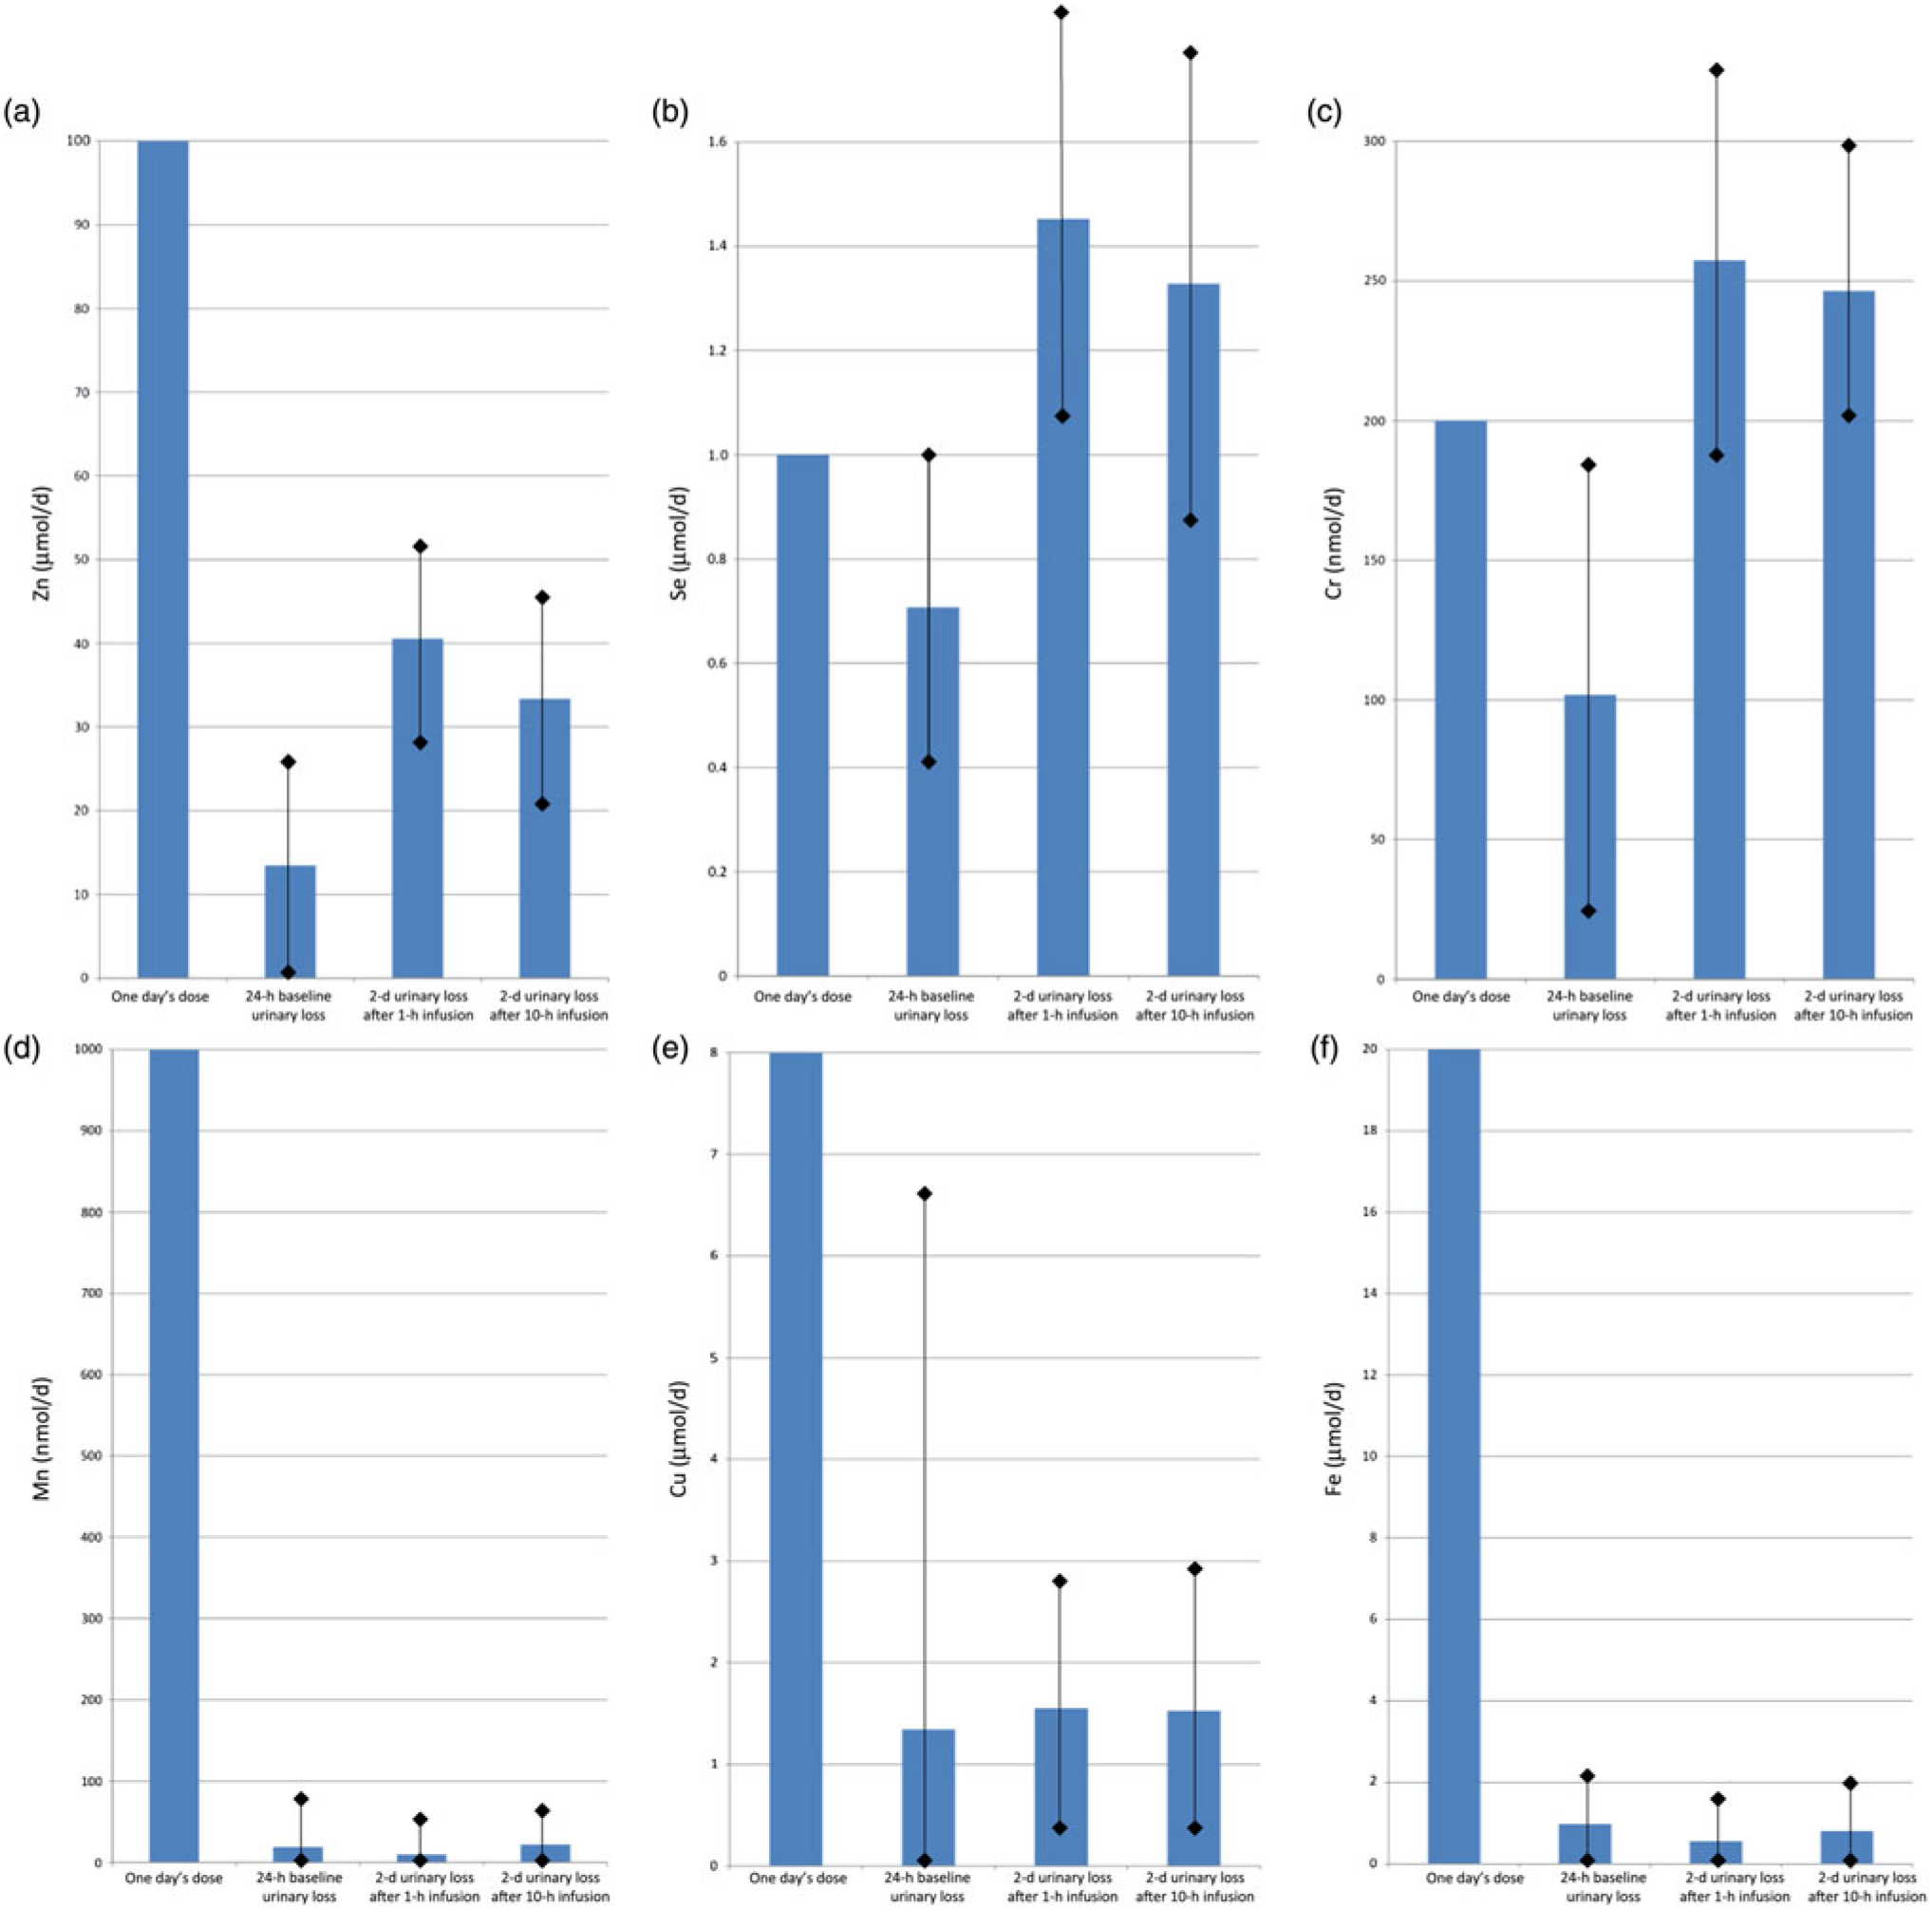
Fig. 4. Urinary trace element losses at baseline and after fast (1 h) v. slow (10 h) parenteral infusion, compared with one day’s dose: (a) zinc, (b) selenium, (c) chromium, (d) manganese, (e) copper, (f) iron. Values are means, with standard deviations represented by vertical bars.
For Mn, after a dose of 1000 nmol, losses were mean 9·8 (sd 23·9) nmol after fast infusion v. 22·1 (sd 47·2) nmol after slow infusion (P = 0·04). Fe also had a trend towards greater losses with slow infusion, but again this was not statistically significant (P > 0·05): a dose of 20 μmol was given and urinary losses were 0·6 (sd 1·1) fast v. 0·8 (sd 1·6) μmol slow.
Notably, Zn and Cr urine losses appeared to be higher in patients with diabetes, although the small numbers mean this did not reach statistical significance. Compared with non-diabetic patients, urinary losses approximately doubled in diabetes at baseline and with fast infusion, but not with slow infusion.
Discussion
After a dose of one day’s requirement of trace elements, there was little difference in urinary trace element losses with a fast (1 h) infusion compared with a slow (10 h) infusion. Some trace elements had greater losses with fast infusion, while others had slightly greater losses with slow infusion. As a proportion of the 1-d dose, only Zn (additional 7 % of the dose lost, P = 0·04) and Se (additional 12 % of the dose lost, but not statistically significant) had losses of any potential clinical importance. However, in patients with diabetes who received the fast infusion, this appeared to be more marked for Zn (doubled, from 7 to 15 %) and Cr (doubled, from 5 to 11 %) although the study size was not adequate to show statistical significance for either one.
One cause of reduced statistical power was the significant variation in urinary loss between individual patients, which was not apparent during the pilot study on which sample size calculations were based. For example, in the case of Fe (which is not normally lost in the urine in significant amounts), twenty-nine patients had negligible urinary Fe losses throughout the study, losing <0·1 μmol each day, but nine patients lost >1–2 μmol/d on at least 1 d in the study, resulting in a 100-fold difference between individuals. Losses of the other five trace elements varied too, by more than ten-fold between different patients.
Other limitations of the study include the use of only one single washout day after each infusion. Studies using large trace element doses have found that it took longer than this for complete urinary clearance of the dose(Reference Tauxe, Goldstein and Randall5), so it might be preferable to have ≥2 washout days for accurate quantification of urine losses. This was not feasible in the setting of the present study as it would mean a study period of ≥7 d, leading to new confounders arising such as the introduction of significant oral intake, removal of urinary catheter (and increased risk of incomplete collection), and discharge from hospital. To identify whether the results were affected by this short washout period, the analysis looked at the order in which each patient received the two infusions. With an insufficient washout period, it would be expected that the urinary losses after the second infusion would have been boosted by the ongoing residual losses from the first infusion, regardless of whether it was the fast or slow infusion. Reassuringly, the order in which a patient received the two infusions had no statistically significant influence on the results (P > 0·05), suggesting that one washout day was sufficient to establish separation of the total losses after each infusion.
Another limitation is the failure to measure baseline serum trace element levels prior to enrolment, in order to enrol only patients with normal baseline levels. Although malnourished patients were excluded, it was notable that many of the patients had below-normal levels on enrolment, and mean plasma concentrations of all the trace elements increased over the 5 d of the study. Ideally patients with abnormal baseline serum levels would have been excluded, because depleted trace elements status might be expected to be a significant confounder for a study of urinary losses. Independent of the infusion speed, urinary losses might decrease to compensate for deficiency, and might then increase as trace elements status improved, later in the study period. However, as the order in which a patient received the two infusions had no statistically significant influence on the results (P > 0·05), it appears that losses did not decrease significantly when blood levels were lower and thus this potential confounder did not significantly alter the results of the study.
Urinary losses may be unrelated to plasma concentrations in the critically ill for several reasons. Firstly, plasma concentrations of trace elements do not necessarily reflect whole-body status of those elements, particularly in inflammatory conditions where demand for particular elements may be altered, resulting in changes in the location and concentration of those elements within the body(Reference Forceville, Vitoux and Gauzit24). Transporters of trace elements include proteins such as albumin, which are present in lower concentrations during the acute phase response, leading to reduced trace elements content in the serum independent of whole-body trace elements status. Also, critical illness may increase the demand for those trace elements that participate in inflammatory processes; oxidative stress may also increase the demand. Reduced serum levels could also reflect the fact that surgery, trauma and burns, and prolonged renal replacement therapy cause increased losses of trace elements by routes other than urine. Gagnon et al. (Reference Gagnon, Voirol and Soguel25) found that plasma levels tended to be low in the first 7 d in ICU, but then mostly resolve. They suggested that short-lived deficits like this may not be meaningful, but equally it could be argued that it is not just a trivial fluctuation but actually indicates the need for increased provision of trace elements early in the ICU stay. Maintenance of normal plasma levels might be assumed to be important for a normal functioning and maintenance of inflammatory response and immune system, as trace elements form a part of key antioxidant enzymes. Berger et al. (Reference Berger, Baines and Raffoul26) found that keeping Se concentration in the normal range resulted in a normal plasma glutathione peroxidase activity and reduced infectious complications. Likewise, there are several studies supporting early replacement or supplementation of trace elements in conditions where these losses and demands are high, showing that such replacement improves outcomes(Reference Heyland, Dhaliwal and Suchner27–Reference Manzanares, Dhaliwal and Jiang29).
There are limited data to indicate precisely the micronutrient requirements of a critically ill patient. The reference values for micronutrient intake in oral and enteral nutrition are based on the maintenance of normal functioning in healthy people. Solid evidence from oral diets allows these reference values to be specified for different groups within the healthy population, such as infants, the elderly, or pregnant women, but requirements during illness are much less clear. Additionally, for PN, the recommended requirements for adults(Reference Osland, Ali and Nguyen21,Reference Osland, Ali and Isenring22) are based on much more limited data, insufficient to make separate recommendations for different groups. Knowing the wide individual variations in how trace elements are handled by the body, and the varying effects of illness, it can be assumed that such a ‘one size fits all’ approach cannot meet the needs of every individual in the ICU. Requirements during critical illness are not adequately described by the limited data on which current parenteral daily dosing is based. Although it appears that parenteral trace element infusions can be given rapidly (e.g. over 1 h) without causing excessive urinary loss, in the ICU population it is essential to follow usual processes for monitoring the dosing and ensuring that individual patients’ requirements are being met, to maintain optimal trace elements status.
Acknowledgements
The assistance of Mario D’Souza, statistician, with the analysis and interpretation of results, is gratefully acknowledged.
This study received no funding from any source.
S. F. conceived the study, collected, analysed and interpreted all data, and prepared and approved the manuscript.
She has no conflict of interest related to this study.