


Vitamin B12 (B12), or cobalamin, plays a key role in cellular metabolism and DNA synthesis( 1 ). It is produced in nature only by microbial synthesis and animal products are the principal dietary sources for man. Uncooked plant-based foods contaminated with B12-synthesising bacteria, and fermented foods, may also be important sources( Reference Herbert 2 , Reference Burgess, Smid and van Sinderen 3 ). In India, vegetarian diets have been associated with an increased risk of B12 deficiency and a high prevalence of B12 deficiency has been attributed to low meat intakes for religious or economic reasons( Reference Herbert 2 , Reference Refsum, Yajnik and Gadkari 4 ). Prevalence rates of deficiency of 47–71 % have been reported among adults( Reference Refsum, Yajnik and Gadkari 4 – Reference Yajnik, Deshpande and Lubree 9 ). There is no standard definition of deficiency among children and there is a paucity of data on B12 status among Indian children. However, recent studies using adult cut-offs have reported that 2–44 % of infants and school-age children are deficient( Reference Taneja, Bhandari and Strand 10 – Reference Sivakumar, Nair and Sreeramulu 14 ). A study in Pune, India showed normal B12 absorption in the majority (90 %) of individuals studied( Reference Bhat and Thuse 15 ).
Severe B12 deficiency, as seen in pernicious anaemia, is characterised by megaloblastic anaemia and/or neurological dysfunction. However, subclinical cobalamin deficiency, currently defined as asymptomatic, mild metabolic abnormalities, may be of greater public health importance( Reference Carmel 16 ). Recent research has related low B12 status with an increased risk of adiposity and gestational diabetes in India( Reference Krishnaveni, Hill and Veena 17 ). Low status among Indian and Nepalese mothers during pregnancy was associated with increased insulin resistance in their children( Reference Yajnik, Deshpande and Jackson 5 , Reference Stewart and Christian 18 ). B12 deficiency is associated with raised plasma homocysteine levels, which is a risk factor for CVD( Reference de Benoist 19 ). There is also evidence of low B12 status being related to increased cognitive decline in elderly people in the USA( Reference Morris, Jacques and Rosenberg 20 ).
Several studies in low- and middle-income countries have identified significant correlations between dietary intakes of B12 or consumption frequency of B12-rich foods and plasma B12 in early childhood( Reference Pasricha and Shet 13 , Reference Scatliff, Koski and Scott 21 – Reference Rush, Chhichhia and Hinckson 26 ). The association between diet and plasma B12 concentration among older children remains under-studied. There is also a need to identify affordable and acceptable sources of B12 for the Indian population.
In the current study, the diets of children aged 9·5 years from the Parthenon Birth Cohort, Mysore, India, were assessed using a semi-quantitative FFQ from which daily B12 intakes were calculated. We aimed to investigate associations between children’s B12 intake and frequency of consumption of potential B12-source foods, with biochemical measures of B12. We hypothesised that higher B12 intakes, and more frequent consumption of non-vegetarian foods (meat, fish and eggs) and dairy products (milk, butter and yoghurt), would be associated with higher B12 status. We also examined whether intakes of traditional Indian fermented foods (whose preparation involves microbial activity) and of raw vegetables (that may be contaminated with bacteria) were associated with higher B12 concentrations. Maternal B12 status is correlated with neonatal B12 status( Reference de Benoist 19 , Reference Bjørke Monsen, Ueland and Vollset 27 , Reference Ueland and Monsen 28 ). We therefore assessed whether maternal B12 concentrations in plasma samples collected during the pregnancy of each child were related to children’s B12 concentrations at 9·5 years. The primary outcome in all analyses was children’s plasma B12 concentration.
Methods
Participants and setting
Details of the Mysore Parthenon Birth Cohort have been published elsewhere( Reference Hill, Krishnaveni and Annamma 29 , Reference Krishnaveni, Veena and Hill 30 ). In brief, between June 1997 and August 1998, pregnant women attending the antenatal clinic of Holdsworth Memorial Hospital (HMH) and living in the city of Mysore or surrounding rural areas were recruited to the study if they fulfilled the following criteria: non-diabetic prior to pregnancy; <32 weeks’ gestation at time of recruitment; and planning to deliver at HMH (Fig. 1). A total of 1233 women were eligible for the study and 830 (67 %) agreed to participate, of whom 663 delivered live, singleton babies without major congenital abnormalities at HMH. In 2007, 539 (81 %) children attended for follow-up at 9·5 years (fifty-six refused, eight were not traced, twenty-six moved away, twenty-five died and nine were withdrawn from the study because of severe chronic medical conditions). Dietary data were available for 538 children, and of these, plasma B12 concentrations were available for 527.
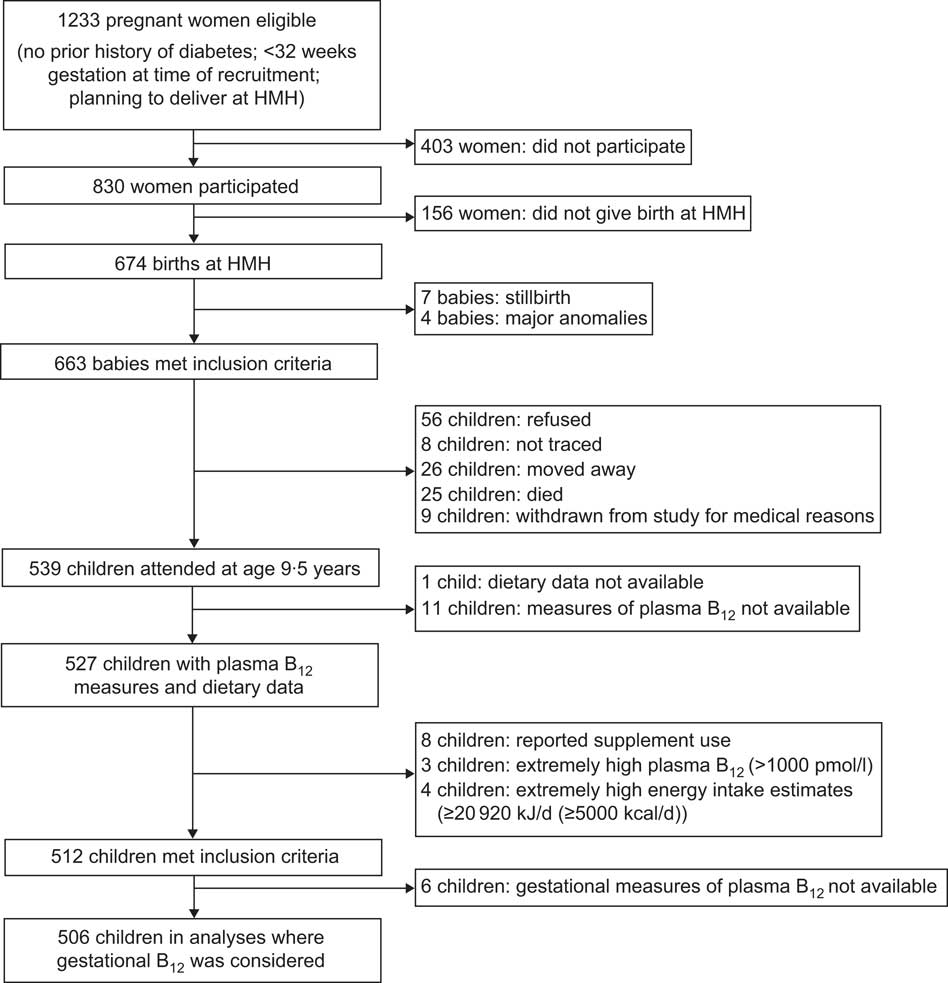
Fig. 1 The Mysore Parthenon Birth Cohort (HMH, Holdsworth Memorial Hospital; B12, vitamin B12)
The study was conducted according to the guidelines laid down in the Declaration of Helsinki and all procedures were approved by the HMH Research Ethics Committee. Written informed consent was obtained from parents and assent from the children.
Sociodemographic factors
Maternal education and socio-economic status were recorded, the latter using the Standard of Living Index (SLI) questionnaire developed for the second Indian National Family Health Survey (NFHS-2)( 31 ). This uses information on household possessions, house type, drinking-water source and sanitation facilities to derive an SLI score. A higher score denotes higher socio-economic status. The NFHS-2 categorised SLI scores of ≥25 as ‘high’ standard of living( 31 ). Children were classified as ‘urban’ or ‘rural’ based on their address at 9·5 years; towns with a population >100 000 were defined as urban( 32 ).
Anthropometry
Height was measured to the nearest 0·1 cm using a wall-mounted stadiometer (Microtoise; CMS Instruments, London, UK). Weight was measured to the nearest 100 g using digital scales (Salter, Kent, UK). Standard deviation scores for height-for-age and BMI-for-age were calculated relative to the WHO Growth Reference Data( 33 ). BMI-for-age Z-scores were used to identify underweight, overweight or obese children (<−2, >+1 and ≤+2 or >+2, respectively)( 33 ).
Biochemical measurements
Fasting venous blood samples were collected at 28·6 weeks (25th, 75th percentile (P25, P75): 27·9, 30·6 weeks; min, max: 23·7, 35·1 weeks) of gestation from mothers and stored for 8 years at −80°C( Reference Veena, Krishnaveni and Srinivasan 34 ). Children’s samples were collected at 9·5 years. Blood was separated within 2 h of venesection and plasma aliquots were stored at −80°C before transfer to the laboratory. B12 concentrations were measured using a microbiological assay at the Diabetes Unit, KEM Hospital Research Centre, Pune, India( Reference Krishnaveni, Hill and Veena 17 , Reference Kehoe, Krishnaveni and Veena 23 ). Intra- and inter-assay CV were <8 %. Children’s Hb concentrations were measured on the day of blood collection using a cell counter (Haematology analyser MEK 6420; Nihon Kohden, Japan) at the HMH Laboratory, Mysore.
B12 deficiency for mothers and children was defined using WHO plasma concentration cut-offs for adults (<150 pmol/l)( Reference de Benoist 19 ). Given the lack of consensus cut-offs for use in children, we also used a definition of ‘marginal’ B12 status (150–221 pmol/l)( Reference Scatliff, Koski and Scott 21 , Reference Jones, Ramirez-Zea and Zuleta 22 , Reference Allen 35 ). Anaemia was defined as Hb concentration <11·5 g/dl( 36 ).
Dietary assessment
A 136-item semi-quantitative interviewer-administered FFQ was developed to characterise food and micronutrient intakes in this cohort of children( Reference Kehoe, Krishnaveni and Veena 23 ). The FFQ was administered by one of three trained nutritionists, to both the child and one parent (usually the mother). The reference period was a typical month. Consumption frequency was recorded as number of times eaten daily, weekly or monthly. Portion size was quantified using common household utensils. In cases where units or frequency data were missing (<2 %), a nutritionist assigned the most frequently reported response. Current medication use, including micronutrient supplements, was also recorded.
Foods on the FFQ that were considered potential sources of B12 were grouped into the following categories: (i) flesh foods (meat and fish); (ii) eggs; (iii) curd (yoghurt) foods; (iv) dairy foods; (v) micronutrient-enriched beverages; (vi) fermented foods; and (vii) raw vegetables. These categories were not necessarily mutually exclusive.
Calculation of nutrient intakes
Daily energy, protein and B12 intakes were calculated using published databases. The nutrient content of raw or ‘non-prepared foods’ (e.g. apple, almond, milk) was assigned based on values published by the Indian National Institute of Nutrition( Reference Gopalan, Rama Sistri and 37 ). If data were not available for a particular food, we obtained values from UK and US databases, scrutinised in that order( 38 , 39 ). We used weighed records to calculate the nutrient content of approximately 60 % of the prepared foods. For each food item, three different homes were visited by the research team. Raw ingredients and the cooked food were weighed. Calculations were then performed using the nutrient content of the raw ingredients, with the databases’ recommended conversion factors for cooking losses (e.g. 20 % loss of B12 when cooking meat)( 38 ). Mean values across the three households were used. For shop-bought ready-prepared foods (40 % of prepared foods), published databases were used to identify a food as close as possible in nutritional content to the item on the FFQ and the corresponding values were used (e.g. packaged skimmed milk)( 38 – Reference Judd, Kassam-Khamis and Thomas 40 ).
The units used in portion-size estimates (spoonful, bowlful, etc.) of each food were weighed, to give grams per portion. The nutrient content per portion size was then derived. Daily nutrient intakes were calculated by multiplying the number of units consumed per day by the nutrient content per unit. Nutrient density was also calculated to give a standardised B12 intake estimate in µg/4184 kJ (1000 kcal).
Data analysis
Analyses were performed using the STATA statistical software package version 12. Descriptive characteristics (maternal height and B12 status in pregnancy, urban/rural residence, gender ratio, birth weight, child’s weight and height at 5 years) were compared between children included in the analysis and those excluded or not followed up, using Wilcoxon rank-sum or t tests and Pearson’s χ 2 tests. Associations between sociodemographic factors (religion, SLI score, urban/rural residence and maternal education) and physiological factors (children’s gender and anthropometry) with dietary characteristics at 9·5 years were examined using Spearman’s correlation, Wilcoxon rank-sum, Kruskal–Wallis equality-of-populations rank or Pearson’s χ 2 tests. Crude associations between dietary characteristics, Hb concentration or maternal plasma B12 during pregnancy and children’s plasma B12 concentrations were examined using Spearman’s correlation or Kruskal–Wallis equality-of-populations rank tests. A Kruskal–Wallis test was used to compare plasma B12 concentrations of children with low B12 intakes by thirds of maternal B12.
Linear regression analyses, with corresponding likelihood ratio tests, were used to examine associations between exposures (B12 intake, B12 dietary density and frequencies of food consumption) and outcomes. Non-parametric variables were transformed for analysis. Covariates considered were child’s gender, age, height, BMI, urban/rural residence, religion, SLI score and maternal education. It was decided a priori to include children’s gender, age, height and BMI in all regression models, as these factors influence total daily food intake. SLI score was included because multivariate analysis showed evidence of an association with plasma B12 concentration independent of diet. We did not adjust for religion or urban/rural residence in the models we present because it was likely that diet was the principal mechanism whereby these factors influence B12 status (e.g. the Hindu religion advocates vegetarianism). However, we did run models including religion and residence as predictor variables. It was decided a priori to adjust for other B12 food groups in food consumption analyses. Additional models and likelihood ratio tests were used to examine diet associations independent of maternal B12 concentration in pregnancy and maternal B12 associations independent of diet. To quantify effects of diet on B12 status (categories: low (≤221 pmol/l) v. ‘normal’ (>221 pmol/l)), odds ratios, corresponding 95 % confidence intervals and Wald test significance values were derived for each B12 intake/density or food consumption third using logistic regression.
Results
Exclusions and comparison of children studied and not studied
Of the 539 children who attended for investigations at 9·5 years, 512 were included in the final analyses where maternal plasma B12 during pregnancy was not considered (Fig. 1). Maternal plasma vitamin B12 measures were available for 506. Children taking supplements or tonics containing B12 (n 8) had higher median plasma B12 concentrations than other children (476 (P25, P75: 247, 638) pmol/l v. 311 (P25, P75: 250, 401) pmol/l) and were excluded from the analysis. Children with plasma B12 measures >1000 pmol/l (n 3) were also excluded. Children with calculated energy intakes ≥20 920 kJ/d (≥5000 kcal/d; n 4) were excluded. The 512 children studied did not differ from the rest of the cohort in terms of religion, gender ratio, height and BMI at 5 years, or their mothers’ height (all P > 0·05). They were more likely to be urban dwelling (72·5 % v. 63·8 %; P=0·009), have a heavier birth weight (2·87 kg v. 2·75 kg; P=0·007) and a lower weight at 5 years (15·8 kg v. 16·4 kg; P=0·028) on average compared with the remainder of the cohort.
Description of the cohort
Table 1 summarises the characteristics of the children included in the analysis. Mean BMI-for-age Z-score was −1·20 (sd 1·25). One hundred and twenty-five (24·4 %) children were underweight, eighteen (3·5 %) were overweight and five (1·0 %) were obese( 33 ). Median plasma B12 concentration was 312 (P25, P75: 251, 400) pmol/l. The prevalence of B12 deficiency (<150 pmol/l) was 2·5 %. A further 14·3 % had marginal B12 deficiency (150–221 pmol/l). Eighty-nine per cent of children had a normal Hb concentration. There was no association between plasma B12 and Hb concentrations (P=0·541).
Table 1 Cohort characteristics: the Mysore Parthenon Birth Cohort, South India
Dietary intakes
The children’s calculated energy intakes ranged from 2674 to 20217 kJ/d (639 to 4832 kcal/d) with a median of 9832 (P25, P75: 8025, 11912) kJ/d (2350 (P25, P75: 1918, 2847) kcal/d; Table 1). The median calculated B12 intake was 2·9 (P25, P75: 1·6, 4·4) μg/d, and ranged from 0·1 to 10·0 μg/d. Approximately 23 % of children had B12 intakes below the WHO Estimated Average Requirement for their age group (1·5 μg/d)( 1 ).
Few children (7 %) reported no consumption of meat, fish or eggs in a typical month (Table 2). Most consumed meat or fish at least once weekly, but less than every day. Dairy foods (including milk, butter and yoghurt) were consumed at least several times weekly by 86 % of the cohort. More than half the children reported consuming milk-based micronutrient-enriched beverages (such as Horlicks or Complan) and generally consumed them at least several times weekly. Most children reported consumption of traditional fermented foods (idli and dosa) and raw vegetables. Micronutrient-enriched beverages made the largest contribution to B12 intakes in the cohort (Table 2).
Table 2 Consumption frequency of B12-source foods/food groups and their median percentage contribution to total daily B12 intake: Mysore Parthenon Birth Cohort, South India
B12, vitamin B12; P25, 25th percentile; P75, 75th percentile.
* Minced meat.
† Rice dish.
‡ Yoghurt.
§ Yoghurt with a small amount of salad (e.g. onion, tomato, cucumber).
|| Milk-based drinks fortified with vitamins and minerals, popularly given to children in India.
¶ Pancake made from fermented rice and pulses.
** Steamed dumpling made from fermented rice and pulses.
†† Cucumber, tomato, onion, carrot, radish, French bean, cabbage, beetroot.
Sociodemographic factors
Fifty-seven per cent of children were Hindu and 35 % were Muslim; 75 % were urban dwelling (Table 1). Higher socio-economic status and urban residence were associated with higher B12 intakes (Table 3, P<0·001 for both) and higher consumption frequency of meat and fish, and micronutrient-enriched beverages. Boys had higher B12 intakes (P=0·059), but B12 density in the diet did not differ by gender (Table 3, P=0·717). Although there was no evidence that total B12 intakes differed with religion (P=0·348), meat and fish intakes were lower among Hindu children than children of other faiths and micronutrient-enriched beverage intakes were lowest among Muslim children (Table 3, P<0·001 for both). Socio-economic status was positively associated with plasma B12 concentrations (P=0·006). Hindu children had lower plasma B12 concentrations than children of other religions (P<0·001). There was no evidence that plasma B12 concentrations differed by urban/rural residence (P=0·124) or by gender (P=0·465).
Table 3 Sociodemographic and physiological correlates of selected food group consumption, total dietary B12 intake/density and plasma B12 concentration: Mysore Parthenon Birth Cohort, South India
B12, vitamin B12; P25, 25th percentile; P75, 75th percentile; SLI, Standard of Living Index.
* Pearson’s χ 2 test of proportions.
† Spearman’s correlation coefficient P values (for continuous variables: SLI and BMI) or Wilcoxon rank-sum test (for comparison of two categories: residence, gender) or Kruskal–Wallis equality-of-populations rank test (for examination across more than two categories: religion, maternal education).
‡ Multivariable linear regression likelihood ratio test (effectively, H0: there is no association between sociodemographic/physiological factor X and log(plasma B12 concentration) when children’s daily dietary B12 intake is controlled for; Ha: there is a linear association between factor X and log(plasma B12 concentration) independent of dietary B12).
Diet and plasma B12 concentrations
Nutrient intakes
Children with lower B12 intakes or those consuming diets with a lower B12 density had lower plasma B12 concentrations (Table 4), although there was considerable overlap in the plasma B12 ranges when children were divided into groups by B12 intake. The odds ratio for low B12 status (deficiency or marginal deficiency, ≤221 pmol/l) was 1·60 (95 % CI 0·84, 3·04) in the lowest third of B12 intake relative to the highest third. Respective values for B12 dietary density were 3·42 (95 % CI 1·69, 6·93).
Table 4 Associations between dietary B12 intakes, food consumption frequency and maternal plasma B12 during pregnancy with children’s plasma B12 concentration at 9·5 years: Mysore Parthenon Birth Cohort, South India

B12, vitamin B12; P25, 25th percentile; P75, 75th percentile; SLI, Standard of Living Index.
* Multivariable linear regression adjusting for age, gender, BMI, height, SLI score and maternal education.
† Multivariable linear regression adjusting for factors listed in * and pregnancy plasma B12 concentration.
‡ Spearman’s correlation coefficient P values.
§ Likelihood ratio test (effectively, H0: there is no association between B12 intake or food consumption or maternal plasma B12 and children’s plasma B12 concentration when factors listed in *, †, ||, ¶ or ‡‡ are controlled for; Ha: there is a linear association between B12 intake/food consumption/maternal plasma B12 and children’s plasma B12 concentration under these conditions).
|| Multivariable linear regression adjusting for age, gender, BMI, height, SLI score, maternal education and all other food groups in the table except traditional fermented foods and raw vegetables (i.e. meat, fish, eggs, dairy foods and micronutrient-enriched beverages).
¶ Multivariable linear regression adjusting for factors listed in || and pregnancy plasma B12 concentration.
** Food groups listed here are not necessarily mutually exclusive (see Table 2 for details of included foods).
†† Kruskal–Wallis equality-of-populations rank test.
‡‡ Multivariable linear regression adjusting for factors listed in * and dietary intakes of B12.
Food intakes
Consumption frequencies of non-vegetarian foods (meat, fish and eggs) or flesh foods (meat and fish) were positively associated with plasma B12 concentrations (all P<0·01, Table 4). Children in the lowest group of non-vegetarian and flesh food intakes had 50–60 % increased odds of low B12 status (adjusted OR=1·62 (95 % CI 0·89, 2·96) and 1·49 (0·78, 2·85), respectively). Micronutrient-enriched beverages were also positively associated with plasma B12 concentrations but this association did not reach statistical significance (P=0·060). Children reporting no consumption of these beverages had a threefold increased odds of having low B12 status (adjusted OR=2·83 (95 % CI 1·31, 6·10)). There were no associations between the consumption frequency of dairy foods, traditional fermented foods or raw vegetables and plasma B12 concentration in fully adjusted analyses. Religion was found to be an independent predictor of B12 concentration whereas residence was not associated with B12 status (data not shown).
Maternal B12 concentrations during pregnancy
Median maternal B12 concentration was 166 (P25, P75: 125, 224) pmol/l. Forty-two per cent of mothers had levels indicating B12 deficiency (<150 pmol/l). Maternal plasma B12 concentration was positively associated with B12 concentration in the children (Table 4, P<0·001). A 1 % increase in maternal B12 concentration was associated with a 0·22 % increase in the child’s B12 concentration. There was no association between maternal B12 concentration and the children’s B12 intake (P=0·870). The association between maternal and child B12 concentrations remained after adjustment for the children’s dietary intake (Table 4, P<0·001). Among children with low B12 intakes, those born to non-deficient mothers had higher median plasma B12 concentrations (311 (P25, P75: 259, 436) pmol/l) than those born to mothers with the lowest B12 status (269 (P25, P75: 217, 302) pmol/l; P=0·003). The associations described above of B12 intakes, flesh and non-vegetarian foods and micronutrient-enriched beverage consumption with children’s B12 concentrations were statistically significant after adjusting for maternal B12 status (Table 4).
Discussion
Summary of main findings
We have studied the relationship of dietary vitamin B12 intakes and B12-source foods with plasma B12 concentrations in a large sample of healthy 9·5-year-old South Indian children. There are currently no standard criteria for defining B12 deficiency in children, but 2·5 % were deficient according to the adult definition and a further 14 % had ‘marginal’ status. Given that rates of deficiency in India have been measured at 1–44 %, the prevalence in our cohort could be considered low( Reference Taneja, Bhandari and Strand 10 – Reference Sivakumar, Nair and Sreeramulu 14 ). However the 150 pmol/l cut-off was derived for adults and may not be a valid measure of deficiency for children. The children’s plasma B12 concentrations were positively related to dietary B12 intakes and to consumption frequency of meat, fish and micronutrient-enriched beverages, but not dairy or fermented foods. These associations between diet and plasma concentrations were independent of maternal plasma B12 concentration during pregnancy, which itself was positively associated with plasma B12 concentrations in the children.
Nutrient intakes
The strong positive association between plasma B12 concentration and B12 intake supports dietary B12 as a key determinant of B12 status in this population. The relationship between diet and biochemical measures was clearer when dietary B12 density, rather than absolute intakes, was examined. This is not surprising given variability in reported energy intakes which, if not fully accounted for by adjustment for age and body size, can obscure nutrient intake relationships( Reference Willett, Howe and Kushi 41 ). The possibility of reverse causality (i.e. biochemical status affecting intake) seems unlikely in children; this has been suggested in the elderly, among whom B-vitamin deficiency-associated cognitive decline could have an adverse impact on diet( Reference Morris, Jacques and Rosenberg 20 ). Our data support FFQ as suitable tools for measuring relative B12 intakes within a population, although bias towards reporting consumption of foods associated with affluence must be considered( Reference Sempos, Liu and Ernst 42 ). Our findings are consistent with other observational studies( Reference Pasricha and Shet 13 , Reference Jones, Ramirez-Zea and Zuleta 22 , Reference Rogers, Boy and Miller 43 ). Estimated dietary B12 correlated with plasma B12 concentration in Guatemalan schoolchildren( Reference Rogers, Boy and Miller 43 ). B12 intake from complementary foods was recently identified as an important determinant of plasma B12 concentrations in toddlers in rural India, as well as in Guatemala( Reference Pasricha and Shet 13 , Reference Jones, Ramirez-Zea and Zuleta 22 ).
Food consumption
The observation that meat and fish consumption was positively related to plasma B12 concentrations suggests that these foods are important contributors to children’s B12 status. It is consistent with data from Colombian schoolchildren showing that a diet pattern that included frequent beef, chicken and dairy consumption was positively associated with plasma B12 concentration( Reference Villamor, Mora-Plazas and Forero 24 ). A small study of Dutch adolescents showed that frequency of consumption of animal-derived foods (dairy foods, meat, eggs and fish) explained nearly half the variance in serum B12 concentrations( Reference Van Dusseldorp, Schneede and Refsum 25 ). The dose-related association between micronutrient-enriched beverage consumption and plasma B12 in our study is highly plausible given their high B12 content (approximately 2 μg per serving). No association was seen with dairy food consumption. Although the B12 content of the widely consumed ‘curd’ (yoghurt) is thought to be relatively low, less frequent yoghurt intake was a predictor of lower B12 status in a recent study of South Indian women( Reference Samuel, Duggan and Thomas 6 ). It is likely that our findings reflect adherence to the lacto-vegetarian dietary pattern (characterised by frequent yoghurt consumption and a low frequency of meat consumption) previously described in our cohort( Reference Kehoe, Krishnaveni and Veena 23 ). Lacto-vegetarian diet pattern scores were negatively correlated with plasma B12 concentrations( Reference Kehoe, Krishnaveni and Veena 23 ).
We examined the relationship between frequency of consumption of raw vegetables and B12 status because of the suggestion that microbial contamination of uncooked vegetables (e.g. due to contamination by animal faeces) may be an important source of B12 in some contexts( Reference Stabler and Allen 44 ). We found no convincing association between raw vegetable consumption level and B12 status. Foods made of fermented rice or lentils, such as dosa and idli, were also of interest as potential B12 sources through microbial B12 production during fermentation( Reference Burgess, Smid and van Sinderen 3 ). Our data suggest that the content and/or bioavailability of B12 from these foods is negligible( Reference Burgess, Smid and van Sinderen 3 ).
Implications of the dietary findings
It remains to be established whether subclinical (asymptomatic) cobalamin deficiency is meaningful in terms of functional and health outcomes( Reference Smith and Refsum 45 ). Data linking lower B12 concentrations to greater adiposity, glucose intolerance and adult cognitive decline, and lower maternal B12 status to insulin resistance and poorer cognitive function in children, come mainly from associations in observational studies( Reference Yajnik, Deshpande and Jackson 5 , Reference Stewart and Christian 18 , Reference Morris, Jacques and Rosenberg 20 , Reference Krishnaveni, Veena and Hill 30 , Reference Bhate, Deshpande and Bhat 46 ). However, supplementation with physiological doses of B12 in a rural Indian population produced a marked fall in plasma homocysteine, suggesting functional benefit( Reference Deshmukh, Joglekar and Lubree 47 ). B12-containing supplements also improved cognitive function among elderly people with mild cognitive impairment and high homocysteine levels in the UK( Reference Smith, Smith and de Jager 48 ). We did not identify foods contributing to B12 status that are suitable for India’s vegetarians. Although micronutrient-enriched beverages are apparently a rich B12 source, they are high in sugar (4–8 teaspoons/serving, with extra sugar usually added). The drinks should be promoted with caution due to the associated risk of dental caries and, given increasing childhood obesity in India, the effect on overall energy intake( Reference Gupta, Shah and Misra 49 – Reference Moynihan and Kelly 51 ). Although a greater proportion of our cohort was underweight (24·4 %), overweight or obesity was present in 4·5 %. In a recent sample of 23 000 children in Mysore, overweight or obesity was found in 11·9 % of children( Reference Premanath, Basavanagowdappa and Shekar 52 ). If subclinical cobalamin deficiency is shown to be an important problem, other affordable approaches will need to be found to improve vitamin B12 intakes in India, especially among vegetarians. These may include food fortification( Reference Carmel 16 ).
Maternal B12 status
B12 concentrations in our children showed a strong positive association with maternal concentrations during pregnancy. B12 is actively transported across the placenta from mother to fetus; newborn B12 concentration is related to maternal status( 1 , Reference Molloy, Kirke and Brody 53 ). The importance of gestational B12 exposure in later childhood can only be studied in a birth cohort context like ours, and to the best of our knowledge B12 concentrations in children of this age in relation to maternal status during pregnancy have not previously been reported. The most obvious explanation for the correlation between maternal and children’s B12 status is that children eat the same foods as their parents. However, in our study, maternal B12 status was not related to children’s B12 intakes and the association between maternal and children’s plasma B12 was independent of children’s dietary measures. Thus, although we did not measure maternal diet directly, our results suggest that the association was not due to similarities in the diets of mother and child. Children with low dietary intakes are likely to be at increased risk of low B12 status if they are born to mothers with low B12 status( Reference Herbert 2 ). We also found that among children with low current B12 intakes, B12 concentrations were lower if their mothers had lower B12 status in pregnancy. Improving maternal status, by adding B12 to the routine pregnancy Fe and folate supplements, for example, could improve long-term B12 status among children.
Strengths and limitations of the study
Our cohort is likely to differ in some key characteristics from India nationally: it is predominantly urban; there is a greater proportion of Muslim families in the cohort than in the nation as a whole (35 % v. 12·5 %); and the range of standard of living is narrower within our cohort( 54 ).
Assessment of nutrient intakes using an FFQ and nutrient content tables inevitably introduces imprecision. Calculated energy intakes were high for children of this age and size. Although our FFQ has not been validated in terms of energy, food patterns derived from the FFQ have shown expected associations with blood micronutrient markers( Reference Kehoe, Krishnaveni and Veena 23 ). Nutrient losses during cooking had to be estimated because Indian nutrient composition data were available only for raw foods. Given these limitations, the avoidance of a fully reductionist approach (i.e. only examining diet in terms of calculated nutrient intakes) was a strength. Although supplementation is not thought to be common in this cohort, we were able to avoid distortion of our results by excluding children who reported use of multivitamin supplements. In spite of children’s B12 intakes being comprehensively measured, a limitation may be that we did not measure maternal B12 intake. An important limitation of our study was the absence of measures of relevant biomarkers (e.g. methylmalonic acid) to triangulate with B12 concentration to assess B12 status more accurately( Reference Carmel 55 ).
Conclusions
Flesh food (meat and fish) consumption is an important determinant of plasma vitamin B12 level in this population of South Indian children. Although there may be a secular trend towards serving children meat and fish, new approaches are needed to identify and/or develop appropriate dietary B12 sources for Indians who consume these foods infrequently for economic or religious reasons. Micronutrient-enriched beverages are an important source of vitamin B12 in our cohort, but they should be promoted with care due to their high sugar content. Maternal B12 concentrations during pregnancy remain strongly associated with children’s B12 concentrations well into childhood, independent of B12 intakes at 9·5 years; improving maternal B12 status in pregnancy may improve B12 status in Indian children.
Acknowledgements
Acknowledgements: The authors thank the study participants for their time and interest; Dr S.C. Karat (Medical Director of HMH); the research staff at the Epidemiology Research Unit, HMH; the laboratory staff at the KEM Hospital Diabetes Unit in Pune who performed the biochemical analyses; and SNEHA India for its support. Financial support: This study was funded by the Parthenon Trust, Wellcome Trust, Medical Research Council and UK Department for International Development. The funders had no role in the design, analysis or writing of this article. Conflict of interest: None. Authorship: The study was conceived and designed by A.M.C., C.H.D.F. and S.H.K. G.V.K. and S.R.V. led the research team and supervised data collection, B.M.M. and S.H.K. designed the FFQ, R.K. collected the nutritional data. E.M.-Z., P.E. and A.M.C. conducted the statistical analysis and A.M.C., C.H.D.F. and S.H.K. drafted the manuscript. All authors contributed intellectually to the final version. Ethics of human subject participation: Ethical approval for the study was granted by the HMH Research Ethics Committee.


