


Undernutrition adversely affects older adults’ health and quality of life and can be caused by a variety of physiological, pathological, psychological and social factors( Reference Stratton, Green and Elia 1 – Reference Hickson 3 ). Undernutrition is prevalent across the continuum of care, with the highest prevalence observed in the rehabilitation setting (50·5 %), followed by the hospital (38·7 %), the nursing home (13·8 %) and the community (5·8 %)( Reference Kaiser, Bauer and Ramsch 4 ). In absolute numbers, however, most undernutrition is encountered in the community as the majority of older adults lives independently( 5 ). Treatment of undernutrition with oral nutritional supplements increases body weight in older adults, but functional benefit from supplementation has not yet been assessed( Reference Milne, Potter and Vivanti 6 ). As it appears to be difficult to reverse the adverse effects of undernutrition, attention should be paid to the prevention of it( Reference Miller and Wolfe 7 ).
Undernutrition may be addressed by screening practices and nutrition education. Screening allows a targeted effort of time and resources on individuals at the greatest risk, resulting in a widespread demand for nutritional screening in at-risk populations( Reference Elia, Zellipour and Stratton 8 ). In the Netherlands, only one-quarter of home care clients is structurally screened for undernutrition and health care professionals (HCP) and older adults seem unaware of the problem( Reference Halfens, Meesterberends and Neyens 9 , Reference Ziylan, Haveman-Nies and van Dongen 10 ). Awareness of the importance of optimal nutritional status for healthful aging may be addressed by nutrition education or counselling. Moreover, during counselling, HCP identify and address risk factors for malnutrition including health, social, economic and geographical factors( Reference van der Pols-Vijlbrief, Wijnhoven and Schaap 11 , Reference Donini, Scardella and Piombo 12 ). However, the value of nutrition education for elderly remains under recognised and nutrition education research among older adults is scarce( Reference Lyons 13 , Reference Sahyoun, Pratt and Anderson 14 ).
Nutritional screening and nutrition education might be addressed using eHealth, which is defined as ‘health services and information delivered or enhanced through the internet and related technologies’( Reference Eysenbach 15 ). eHealth is expected to contribute to more efficient ways of providing high-quality health care to an aging population with increased pressure on health care resources( Reference Ludwig, Wolf and Duwenkamp 16 ). To our knowledge, eHealth has not yet been used for nutritional screening and nutrition education in a community-dwelling elderly population. We present an intervention that combines nutritional screening in the form of telemonitoring with computer-tailored nutrition education. The aim of this study was to evaluate the effects of this intervention on the primary outcome nutritional status and secondary outcomes diet quality, appetite, physical functioning and quality of life.
Methods
Study design
The study followed a parallel arm pre-test post-test design and took place from April 2016 until June 2017. The intervention had a duration of 6 months, and effect measurements took place during screening, at baseline (T0), after 4·5 months (T1) and at the end of the study (T2). In addition, telemonitoring measurements of nutritional status, appetite and diet quality took place in the intervention group as part of the intervention at the beginning of the study (TM0) and 3 months after the start of the study (TM1). The first measurements of nutritional status, appetite and diet quality were used for both effect evaluation and telemonitoring purposes (T0/TM0) (Fig. 1). The study was registered at ClinicalTrials.gov (identifier NCT03240094), url: http://bit.ly/2zFTs3P.
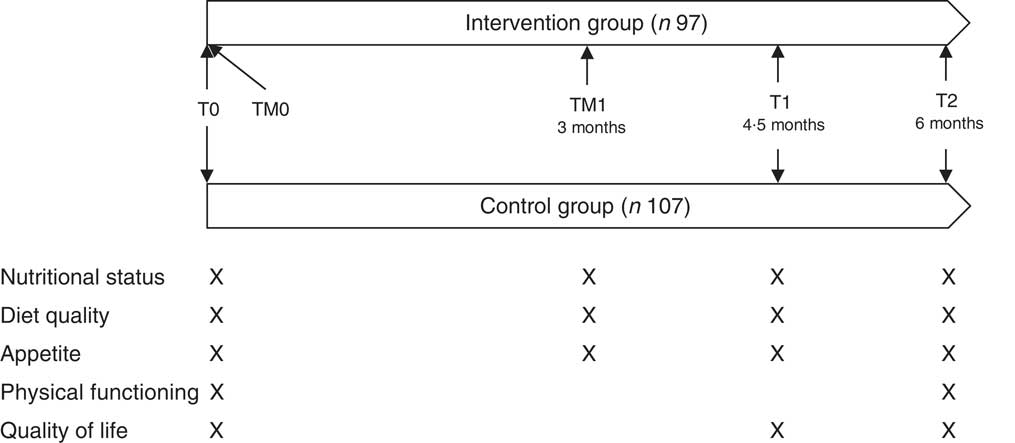
Fig. 1 Study design of the PhysioDom Home Dietary Intake Monitoring intervention in the Netherlands including effect measurements (T0, T1 and T2) and telemonitoring measurements (TM0 and TM1).
Ethical approval
This study was conducted according to the guidelines laid down in the Declaration of Helsinki and all procedures involving participants were approved by the Medical Ethical Committee of Wageningen University, no. NL53619.081.1. Written informed consent was obtained from all participants.
Participants
Recruitment took place from February 2016 until September 2016. Allocation of participants to the treatment group took place on the level of the municipality. The involved care organisations appointed five municipalities where nurses and dieticians were available to implement the intervention. Four other municipalities were allocated to the control group. As a result, participants in the intervention group were recruited from the municipalities of Ermelo, Harderwijk, Nunspeet, Putten and Renkum in the Netherlands. Participants in the control group were recruited from the municipalities of Ede, Rhenen, Veenendaal and Wageningen in the Netherlands. Participants were recruited via invitation letters from care organisations Zorggroep Noordwest-Veluwe and Opella, via advertisements in local newspapers and public spaces, and via invitation per post. Persons could participate when they were 65 years or older and received home care and/or lived in sheltered accommodation or a service flat. Persons who showed interest to participate were visited by a researcher to receive more information about the study, to ask questions, to sign the informed consent, and to be screened on the exclusion criteria. Individuals were excluded from participation if they were cognitively impaired (Mini-Mental State Examination (MMSE)<20), had diagnosed cancer, received terminal care, were bedridden or bound to a wheelchair, or were unable to watch television. In total, 215 persons were screened for eligibility, of whom ninety-seven were assigned to the intervention group and 107 to the control group, based on the municipality. In the intervention group, twenty-one participants were lost to follow-up, mainly due to health problems or perceived difficulties with the telemonitoring technology. In the control group, six participants were lost to follow-up due to various reasons (Fig. 2).
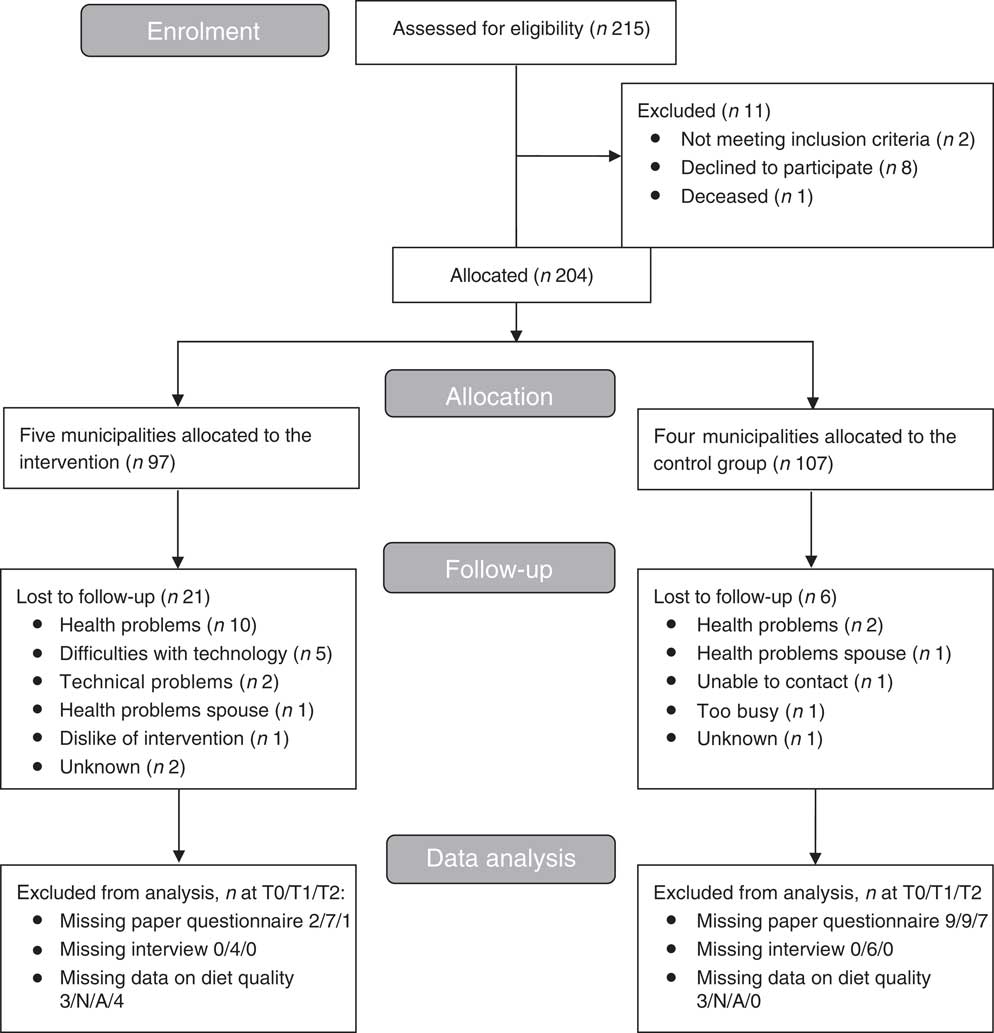
Fig. 2 Flow diagram of participants of the PhysioDom Home Dietary Intake Monitoring intervention in the Netherlands.
Intervention
The PhysioDom Home Dietary Intake Monitoring (HDIM) intervention consisted of the following components: telemonitoring, nutrition education and follow-up by a nurse. These components are described in more detail below.
Telemonitoring
Participants were asked to perform self-measurements of body weight (weekly), steps (1 week/month), and blood pressure (monthly or bi-monthly, and only for a subsample of participants upon indication of a nurse). For these measurements, participants received a weighing scale (type UC-411PBT-C; A&D), a pedometer (type UW-101; A&D) and a sphygmomanometer (type UA-767PBT-CI; A&D), respectively. The weighing scale and sphygmomanometer were connected via Bluetooth to a set-top box. This box was connected to the participant’s television. In this way, the telemonitoring results were automatically displayed on the participant’s television. Furthermore, telemonitoring results were sent from the set-top box to the nurses via a secured internet connection. Furthermore, participants filled out questionnaires about nutritional status with the Mini Nutritional Assessment Short-Form (MNA-SF)( Reference Kaiser, Bauer and Ramsch 17 ), appetite with the Simplified Nutritional Appetite Questionnaire (SNAQ)( Reference Wilson, Thomas and Rubenstein 18 ) and diet quality with the Dutch Healthy Diet FFQ (DHD-FFQ)( Reference van Lee, Feskens and Meijboom 19 ). These questionnaires were administered at the start of the study by means of an interview with a researcher (T0/TM0) and 3 months after the start of the study during a telephone interview with a researcher or using their own computer or tablet received from the researchers (TM1) (Fig. 1). The TM1 measurement of some participants was performed during the T1 measurement with researchers due to difficulties with filling out the questionnaires on a computer or tablet. Participants could view the results of these telemonitoring measurements on their television and received feedback on the results.
Nutrition education
Participants received computer-tailored and non-tailored information about nutrition. The computer-tailored information contained two letters with the results of the DHD-FFQ that were sent after the administration of the DHD-FFQ at T0/TM0 and TM1. The results included scores (0–10) for compliance with Dutch guidelines for several nutrients and food groups and physical activity (see Outcomes section) and computer-tailored advice on how to improve compliance. These computer-tailored advice appeared automatically after filling out the DHD-FFQ on a website. Per nutrient or food group, two (for trans-fatty acids) or five (for the other nutrients and food groups) different advice could be given, according to the score for that specific nutrient or food group. For example, participants with low scores for vegetable intake received suggestions that were easily accessible and that should fit with various reasons for not consuming vegetables (e.g. not liking vegetables), whereas participants with high scores for vegetable intake received suggestions that aimed at maintaining this behaviour and at having sufficient variation in vegetables. The non-tailored information consisted of three short and general television messages (<500 characters) that were sent weekly to the participants and that targeted determinants of dietary and physical activity behaviour such as awareness, knowledge and attitude. For example, topics included dental health, eating alone v. eating with others, and how to enhance the taste of the meal in case of impaired taste perception.
Follow-up by a nurse
In total, seven nurses and three dieticians were involved in the study. Each participant was assigned to a nurse who worked in the same municipality as where the participant lived. Nurses received the telemonitoring results and interpreted these with the help of alerts that were activated in case of undernutrition or the risk of undernutrition, obesity or new blood pressure measurements. Thresholds for activation of alerts are described elsewhere( Reference van Doorn-van Atten, Haveman-Nies and Pilichowski 20 ). Nurses decided about follow-up of alerts with the help of decision trees( Reference van Doorn-van Atten, Haveman-Nies and Pilichowski 20 ). In case of risk of undernutrition, the nurse investigated on the causes by looking into the questionnaire results and by contacting the participants to ask more in-depth questions about the personal situation of the participant and possible risk factors. The nurse also advised participants on how to improve protein and energy intake and gave a brochure with advice on this. Studies have indicated the potential of nutrition counselling by a HCP to impact nutritional outcomes in older adults( Reference Nykänen, Rissanen and Sulkava 21 – Reference Bandayrel and Wong 24 ). In case of undernutrition and obesity, the nurse discussed with the participant whether referral to a general practitioner (GP) or dietitian was desired for professional treatment. In case of undernutrition or risk of undernutrition, the HCP advice had priority over the advice from the DHD-FFQ, although HCP could use the results from the DHD-FFQ to prioritise in the individual advice that was given to participants. In case of abnormal blood pressure measurements, the nurses followed their regular care pathways.
Implementation
To guide the quality of implementation, the researchers held four preparatory meetings with the involved HCP, held monthly to bi-monthly evaluation meetings with HCP during the study, provided individual at-home training to participants, and provided manuals and a support desk to the HCP and participants. The preparatory meetings for the HCP’s lasted one and a half hour each. During these meetings, the HCP received all the information, materials and training needed to provide proper follow-up of telemonitoring measurements to participants. The nurses also received a workshop from a dietitian with the aim to improve knowledge about nutrition and undernutrition in older adults. The individual at-home training for participants took approximately 45 min and covered the use of the television channel, the weighing scale, the pedometer and, if applicable, the sphygmomanometer and/or tablet. Researchers stimulated compliance with the intervention by giving participants a paper calendar with the telemonitoring measurements, illustrated cards with cues to use the television channel and to perform the telemonitoring measurements, and three newsletters. Participants in the control group received usual care. Domestic care was received by 80 % of the control group participants, personal care and nursing care by 30 % and 3 %, respectively.
The intervention including its theoretical framework is described in more detail elsewhere( Reference van Doorn-van Atten, Haveman-Nies and Pilichowski 20 ).
Outcomes
Measurements took place during the screening visit, at T0, T1 and T2. In addition, telemonitoring measurements took place at TM0 and TM1 as part of the telemonitoring intervention in the intervention group only (Fig. 1). Data were collected with paper questionnaires and through structured interviews at the participants’ homes performed by trained researchers or research assistants. Baseline characteristics were recorded during the screening visit in the intervention group and at T0 in the control group. Baseline characteristics included age, sex, height, BMI (kg/m2), education level, birth country, marital status, living situation (alone or with partner or relatives) and current diagnoses. These items were derived from The Older Persons and Informal Caregivers Survey Minimum DataSet (TOPICS-MDS)( Reference Lutomski, Baars and Schalk 25 ). Furthermore, cognitive functioning was measured with the MMSE( Reference Folstein, Folstein and McHugh 26 ) and dental problems, swallowing problems, type and amount of care or informal care, presence of a diet and wish for weight reduction were recorded. The primary outcome nutritional status was assessed with the Mini Nutritional Assessment at T0/TM0, T1 and T2( Reference Vellas, Villars and Abellan 27 ). A higher MNA score means a better nutritional status, with a score from 0–16 indicating undernutrition, a score from 17–23·5 risk of undernutrition, and a score from 24–30 a normal nutritional status. In addition, nutritional status was assessed at T0/TM0 and TM1 in the intervention group as part of the telemonitoring intervention, using the MNA-SF( Reference Kaiser, Bauer and Ramsch 17 ). Body weight was measured at T0, T1 and T2 by researchers to the nearest 0·1 kg using a scale of the brand A&D, type UC-411PBT-C. Participants were asked to take off their shoes and heavy clothes before the measurement. In addition, participants in the intervention group measured their body weight weekly as part of the telemonitoring intervention. Diet quality was measured with the DHD-FFQ at T0/TM0, TM1 and T2( Reference van Lee, Feskens and Meijboom 19 ). The DHD-FFQ has twenty-eight items and evaluates the compliance with Dutch dietary guidelines. These guidelines are formulated for the general population of 2 years and older and include vegetables, fruit, fish, alcohol, SFA, trans-fatty acids, Na and dietary fibre( 28 ). In addition, the DHD-FFQ assesses compliance with Dutch guidelines for physical activity( 28 ). For this study, compliance with guidelines for protein and vitamin D was also assessed, taking into account that older adults require a higher intake vitamin D and protein than a younger population( 28 , 29 ). The intake of these nutrients could be assessed by the DHD-FFQ as this questionnaire includes questions on all relevant protein and vitamin D rich food groups consumed by an elderly Dutch population( Reference Ocke, Buurma-Rethans and de Boer 30 ). Based on the level of compliance with a guideline, a score between 0 and 10 was composed with higher scores indicating better compliance with the guideline. Furthermore, a total score ranging from 0 to 80 indicates overall diet quality and is calculated by summing the scores for vegetables, fruit, fish, alcohol, SFA, trans-fatty acids, Na and dietary fibre. Appetite was measured with the SNAQ questionnaire at T0/TM0, TM1 and T2( Reference Wilson, Thomas and Rubenstein 18 ). Level of independence of activities of daily living and physical functioning were measured at T0 and T2 with the Katz-15 questionnaire and Short Physical Performance Battery, respectively( Reference Laan, Zuithoff and Drubbel 31 , Reference Guralnik, Simonsick and Ferrucci 32 ). Quality of life was measured with the Short Form 36 questionnaire at T0, T1 and T2( Reference Ware and Sherbourne 33 , Reference Aaronson, Muller and Cohen 34 ).
Statistics
Sample size calculation
We aimed to detect a difference in MNA change of three and assumed a standard deviation of 6·1, based on previous research(
Reference Nijs, de Graaf and Siebelink
35
). Furthermore, we took into account a two-sided significance level of 0·05 and a power of 80 %. Based on the formula
 $$2{\times}{{[ {( {Z\alpha {\rm \,/\,2{\plus}}Z\beta } )^{2} {\times}\sigma ^{2} } ]} \over {\delta ^{2} }}$$
, with α=0·05, β=0·80, σ=6·1 and δ=3, we needed a sample size of sixty-five participants per group. Allowing for a drop-out rate of 30 % at maximum, we needed a sample size of ninety-three participants in each group.
$$2{\times}{{[ {( {Z\alpha {\rm \,/\,2{\plus}}Z\beta } )^{2} {\times}\sigma ^{2} } ]} \over {\delta ^{2} }}$$
, with α=0·05, β=0·80, σ=6·1 and δ=3, we needed a sample size of sixty-five participants per group. Allowing for a drop-out rate of 30 % at maximum, we needed a sample size of ninety-three participants in each group.
Data were analysed with SPSS version 22. Descriptive data were presented as means and standard deviations or as percentages. Statistical analysis was carried out according to the intention-to-treat principle. Baseline differences between the intervention and control group were analysed with an independent t test or a χ 2 test. Differences in changes between the intervention and control group were analysed using linear mixed models. Therefore, we first specified a model as large as possible for the fixed and random part, for example, a saturated model with all main effects and interactions and an unstructured covariance matrix. Then we simplified the covariance model by specifying simpler covariance structures and testing them with (REML) LR test until a model was obtained that was as parsimonious as possible. Finally, we simplified the fixed part of the model by including dummy’s for T1, T2, treatment group, the interaction terms of the dummy’s for T1 and T2 and treatment group, age, sex and if necessary also other covariates that influenced the effect estimates. The analysis of the primary outcome nutritional status also included investigation of a possible interaction of the intervention with baseline nutritional status, categorised into normal nutritional status (MNA≥24) or having undernutrition or risk of undernutrition (MNA≤23·5). Furthermore, for the study outcome body weight, we investigated a possible interaction of the intervention with desire to lose weight as about half of the participants in the intervention group desired to lose weight. Finally, we used logistic regression to analyse the effects of the intervention on the score for compliance with the dietary guideline for trans-fatty acids, as this score could be either 0 or 10.
Results
Table 1 shows the baseline characteristics of the study population. Participants in the intervention group were slightly younger and had a higher BMI than participants in the control group. Furthermore, participants in the intervention group lived less often alone, were less often on a diet, and received more often informal care than participants in the control group.
Table 1 Baseline characteristics of participants of the PhysioDom Home Dietary Intake Monitoring study (Mean values and standard deviations; percentages)
MMSE, Mini-Mental State Examination.
* Independent t test or χ 2 test.
† Low education level: primary school or less; intermediate level of education: secondary professional education or vocational school; high education level: higher vocational education, university.
Participants who dropped out of the study were significantly older and had a lower MMSE score. They were also significantly more likely to have swallowing problems and to receive personal care and/or nursing care at home. Furthermore, participants who dropped out had a worse physical functioning and were less physically active than participants who completed the study.
Table 2 shows the crude means of the study outcomes. At T0, participants in the intervention group had a significantly lower compliance with guidelines for the intake of vegetables and fibre (t (197)=2·15, P=0·03), t (197)=2·64, P=0·009, respectively), and a lower compliance with guidelines for physical activity ((t (197)=3·31, P=0·001), than participants in the control group. The intervention group had significantly better compliance with guidelines for intake of trans-fatty acids than the control group at T0 (χ 2 (1, n 199)=4·63, P=0·03).
Table 2 Study outcomes on T0, T1 and T2, and the interaction terms treatment and time points T1 and T2 (Crude means and standard deviations; β-coefficients and odds ratios and 95 % confidence intervals)Footnote †
MNA, Mini Nutritional Assessment; DHD, Dutch Healthy Diet; SNAQ, Simplified Nutritional Appetite Questionnaire; SPPB, Short Physical Performance Battery; SF36, Short Form 36; MCS, Mental Component Score; PCS, Physical Component Score.
* P<0·05, ** P<0·01, *** P<0·001.
† All results are adjusted for age and sex.
‡ Adjusted for age, sex, swallowing problems, dental problems, cognitive functioning and desire to lose weight.
§ Adjusted for age, sex, and desire to lose weight.
|| Analysed using logistic regression. Adjusted for age, sex, and baseline compliance with guidelines for intake of trans-fatty acids.
Participants in the intervention and control group did not significantly differ in changes over time in the primary outcome nutritional status. However, we observed a significant interaction of the intervention with baseline nutritional status. Intervention group participants with a poor nutritional status at baseline improved significantly more in MNA score than control group participants with a poor nutritional status at baseline. Participants in the intervention and control group with a normal nutritional status at baseline did not significantly differ in changes over time in MNA score (β (T1)=2·55; 95 % CI 1·41, 3·68; β (T2) 1·77; 95 % CI 0·60, 2·94, Table 2). Furthermore, we did not find a significant effect of the intervention on body weight. Intervention group participants without a desire to lose weight increased more in body weight than control group participants without a desire to lose weight, although this was not statistically significant (Table 2).
The intervention did not have an effect on the total score for diet quality, but participants in the intervention group significantly increased their compliance with several Dutch dietary guidelines, compared to the control group. They significantly increased their compliance with the guidelines for vegetables (β=1·27; 95 % CI 0·49, 2·05), fruit (β=1·24; 95 % CI 0·60, 1·88), dietary fibre (β=1·13; 95 % CI 0·70, 1·57) and protein (β=1·20; 95 % CI 0·15, 2·24). Furthermore, participants in the intervention group slightly decreased their compliance with the guideline for the intake of Na, whereas participants in the control group increased their compliance with this guideline. This difference in change over time was significant (β=−0·97; 95 % CI −1·77, −0·17). The intervention did not have an effect on the remaining Dutch dietary guidelines for the intake of fish, SFA, trans-fatty acids, alcohol and vitamin D. Participants in the intervention group significantly improved their compliance with the Dutch guidelines for physical activity, compared to the control group (β=2·13; 95 % CI 0·98, 3·29).
Finally, participants in the intervention and control group did not significantly differ in changes over time in appetite, physical functioning and quality of life (Table 2).
Discussion
The aim of this study was to evaluate the effects of the PhysioDom HDIM intervention on nutritional status, diet quality, appetite, physical functioning and quality of life. The intervention was effective in improving nutritional status in participants at risk of undernutrition and in improving several items of diet quality and compliance with guidelines for physical activity. The intervention did not have an effect on body weight, appetite, physical functioning and quality of life.
The intervention led to an improved nutritional status in participants at risk of undernutrition. These participants received a more intense intervention than participants who were not at risk, as they received additional advice by a nurse and a brochure with advice on how to improve protein and energy intake. If necessary, they were referred to their GP or a dietitian. To our knowledge, this is one of the first studies that used eHealth for nutrition screening and nutrition education to improve nutritional status in community-dwelling elderly. Other similar non-eHealth studies consisted of nutrition screening with a validated screening tool, followed by a nutrition intervention such as printed nutrition education material( Reference Southgate, Keller and Reimer 36 ), nutrition newsletters and dietary consultation( Reference Benedict, Wilson and Snow 37 ), personalised evaluation and consultation( Reference Klein, Kita and Fish 38 , Reference Leggo, Banks and Isenring 39 ), or a combination of counselling, nutrition education and meals on wheels( Reference Keller, Haresign and Brockest 40 , Reference Wunderlich, Bai and Piemonte 41 ). These studies found similar positive effects on the nutritional status of older adults at risk of undernutrition, although many of these studies lack the presence of a control group or rely on self-report( Reference Hamirudin, Charlton and Walton 42 ). Our study adds to these findings by suggesting that eHealth can be used for nutrition screening, but that additional consultation of a HCP remains necessary to achieve an effect on nutritional status.
The intervention group improved compliance with guidelines for the intake of fruit, vegetables, dietary fibre and protein( 28 , 29 ). An optimal diet quality is essential for older adults as a more nutrient-dense diet is required considering the declined energy requirements and food intake that often accompany aging. Only one other pilot study was found that used eHealth to provide computer-tailored dietary advice to older adults, as part of a web-based platform concerning healthy eating, physical activity, and meaningful social roles. This 8-week intervention appeared to be feasible to implement, but it did not lead to significant effects on dietary intake and physical activity( Reference Lara, O’Brien and Godfrey 43 ). A review of non-eHealth studies that focus on dietary advice and nutrition counselling for older adults reported positive effects on dietary intake( Reference Bandayrel and Wong 24 ). For example, a 6-month home-based nutrition education intervention consisting of eight home visits, bi-weekly phone calls and monthly letters resulted in increased fruits and vegetables intakes( Reference Bernstein, Nelson and Tucker 44 ). The review further concludes that comprehensive interventions involving active participation and collaborative elements such as group classes and follow-up meetings are most promising in affecting nutritional outcomes, in contrast to interventions with limited personal contact with study participants( Reference Bandayrel and Wong 24 ). These type of interventions are costly to implement and expensive to scale up, however, as they require a considerable amount of human resources. Contrary to what this review concluded, our intervention with limited contact between participants and researchers was successful in improving diet quality. This could be explained by the fact that our intervention included personalised dietary advice, which is suggested to be more effective in achieving behaviour change than non-personalised advice( Reference Celis-Morales, Lara and Mathers 45 ). Furthermore, the control group unexpectedly improved compliance with guidelines for the intake of salt. This may be a chance finding, or it may be attributed to the fact that more participants in the control group were on a diet, although adjusting for this in the analyses did not alter the results. To conclude, this study shows that using a personalised eHealth approach for nutrition education can be as effective as a non-eHealth approach in improving diet quality, with the additional benefits that eHealth is more scalable and sustainable while keeping costs limited( Reference Celis-Morales, Lara and Mathers 45 ).
The intervention group significantly improved compliance with guidelines for physical activity. Participants were asked to wear a pedometer for 1 week/month during the intervention period. In addition, they were encouraged to set goals for their daily number of steps. In studies among younger adults, pedometer use is associated with significant increases in physical activity( Reference Bravata, Smith-Spangler and Sundaram 46 ). Studies in older adults also suggest that pedometer use can be effective in increasing daily steps( Reference Snyder, Colvin and Gammack 47 , Reference Harris, Kerry and Victor 48 ). Our study confirms that pedometer-based interventions appear to be an easy and cheap way to encourage physical activity in community-dwelling older adults, although more research is needed to establish long-term effects.
The intervention did not have effects on body weight, appetite, physical functioning and quality of life. The lack of effects on these type of outcomes is in line with a review by Van den Berg et al.( Reference van den Berg, Schumann and Kraft 49 ), which suggests that eHealth interventions for older adults show better results for behavioural outcomes than for medical outcomes, quality of life and economic outcomes. The lack of effects in this study could possibly be attributed to several aspects. First, a longer intervention duration, a more intense intervention, and a larger sample size might be needed to establish effects on these long-term outcomes. Second, it is suggested that nutritional interventions that are implemented among a wide range of patients with a smaller risk of undernutrition have not demonstrated clinical benefits( Reference Elia, Zellipour and Stratton 8 ). It is argued that interventions could better target persons who are at higher risk to become malnourished to be able to intervene in a more targeted and specialised way( Reference Elia, Zellipour and Stratton 8 ). Indeed, less than one-fifth of our study population risked undernutrition. Future research might target a population at greater risk of undernutrition to demonstrate effectiveness in a more homogenous sample, for example through connecting the intervention to care pathways for frail or hospitalised elderly patients.
To our knowledge, this is the first study that used eHealth for a combination of nutritional screening and education among community-dwelling older adults. A strength of this study was that the intervention was embedded within health care organisations, reflecting a real-life setting and thus improving external validity. Other strengths are the use of a theoretical framework including behaviour change techniques and providing tailored dietary advice, making a sustainable behavioural change more probable( Reference Celis-Morales, Lara and Mathers 45 ). Furthermore, the addition of scores for compliance with guidelines for protein and vitamin D to the DHD-FFQ can be regarded as a strength. These nutrients are of particular interest for older adults with regard to bone health and muscle functioning. Adding these components to the original DHD-FFQ resulted in a more relevant dietary advice for our participants. Limitations of the study include the non-randomised design. Randomisation was not desirable due to the risk of contamination as nurses delivered a large part of the intervention. This led to baseline differences between the intervention and control group. Although we were able to adjust for many possible confounders, we cannot completely exclude residual confounding. Another limitation was the high drop-out rate in the intervention group. However, under the assumption of most missing data being missing at random, linear mixed models still yield unbiased effect estimates( Reference Bell, Kenward and Fairclough 50 ). Nevertheless, future research should focus on ways to keep frail or diseased participants in a study, for example by optimising the usability of interventions.
In conclusion, the findings of this study suggest that an eHealth intervention for nutrition screening and education can lead to improved nutritional status in older adults at risk of undernutrition and that it can lead to improved adherence to guidelines for a healthy diet and physical activity in community-dwelling older adults. More insight is needed into how such interventions yield more impact, for example by studying the intervention’s delivery, acceptability and applicability in more detail, and by unravelling the intervention’s mechanism of impact.
Acknowledgements
The authors would like to thank all participants, involved health care professionals, and the boards of Zorggroep Noordwest-Veluwe and Opella. Furthermore, the authors would like to thank Mirthe Groothuis for her contribution to the coordination and data collection of the study, Jan Harryvan for his technical support, Hendriek Boshuizen for her advice about the statistical analyses, and Teuni Rooijackers, Nicolet Antonissen, Britt Hoens, Esther Lokerse and Dorien Oostra for their contribution to the recruitment of participants and data collection of the study.
This work was supported by the European Union, grant no. CIP-ICT-PSP-2013-7. The European Union had no role in the design, analysis or writing of this article.
M. N. v. D.-v. A. coordinated implementation of the study, analysed the data and drafted the article. All other authors critically read and revised the manuscript. M. N. v. D.-v. A., J. H. M. d. V., A. H.-N., L. C. P. G. M. d. G., M. M. v. B. and M. F. participated in the study design. M. F. contributed to the implementation of the intervention.
None of the authors has any conflicts of interest to declare.


