


In commercial pig farming systems, it is typical for nutritionists to formulate diets for economic objectives( Reference Ferguson 1 ) such as revenue/feed cost or feed cost/kg live weight (LW) gain( Reference Saddoris-Clemons, Schneider and Feoli 2 ). This is most commonly done through the use of linear programming. More recently, however, sustainability objectives rather than economic ones have increasingly come into consideration in diet formulation. There has been an increased interest in the quantification and mitigation of the environmental impacts of the livestock industry( Reference Steinfeld, Gerber and Wassenaar 3 ). Assessing farming operations in more ways than just their economic ‘bottom line’ may become more important as part of efforts to improve the sustainability of livestock systems.
For pig farming systems, feed production and manure management are the main sources of environmental impacts, for example( Reference Macleod, Gerber and Opio 4 – Reference Basset-Mens and Van Der Werf 6 ). Life Cycle Assessment (LCA) is a generally accepted method to evaluate holistically the environmental impact during the entire life cycle of a product or system( Reference Guinée, Gorrée and Heijungs 7 ), and there are many metrics through which environmental impacts can be quantified. Carbon footprint or global warming potential (GWP) is the metric that has received the most attention in the recent past( Reference Weidmann and Minx 8 ). Analyses of livestock systems using LCA have shown that monogastric animal production systems cause less GWP than meat production from ruminants, whether measured per kg of product or protein produced( Reference de Vries and de Boer 9 – Reference Eshel, Shepon and Makov 11 ). Pork production is, however, associated with relatively high levels of other environmental impact categories including non-renewable resource use (NRRU), acidification potential (AP) and eutrophication potential (EP)( Reference de Vries and de Boer 9 , Reference Williams, Audsley and Sandars 10 ). The production of feed is responsible for the majority of GWP (up to 65 %)( Reference Macleod, Gerber and Opio 4 , Reference Basset-Mens and Van Der Werf 6 , Reference Eriksson, Elmquist and Stern 12 ) and NRRU (up to 90 %)( Reference Mackenzie, Leinonen and Ferguson 5 ) resulting from pig farming systems. The majority of AP and EP caused by pig production is due to emissions during manure storage and application, as a direct result of the excretion of N and P by the animal( Reference Basset-Mens and Van Der Werf 6 , Reference Reckmann, Traulsen and Krieter 13 , Reference Dourmad, Ryschawy and Trousson 14 ). As such, the ingredient and nutritional composition of pig diets are extremely important considerations when quantifying the environmental impacts of pig production systems.
The objective of this study was to develop a novel methodology that enables pig diets to be formulated explicitly for environmental impact objectives using an LCA approach, while not penalising animal growth. The methodology was associated with the following challenges: (1) how to account for environmental impacts caused by both nutrient excretion and ingredient choice, (2) how to formulate diets for multiple environmental impact objectives and (3) how to identify the optimal nutritional composition of diets for different objectives. An LCA model for Canadian pig farming systems was integrated into a diet formulation tool. The LCA model was then used to quantify the potential reductions that can be made to the environmental impact of Canadian pig farming systems through explicitly optimising diets for this purpose in a diet formulation tool.
Methods
The system under consideration
Modern pig farming systems can be considered to have three distinct production phases: (1) gestation and farrowing where piglets are produced by breeding sows, (2) the nursery or weaning phase when pigs are separated from their mothers and (3) the grower/finisher (G/F) phase where pigs are fattened from about 30 kg to slaughter weight( 15 ). Fig. 1 shows the major components of this system when considered in an LCA model: from the production of feed ingredients to animals shipped from the farm gate for slaughter. There were three main compartments of material flow considered in the LCA model: (1) the production of feed ingredients, (2) the consumption of feed, energy and other materials for on-farm pig production and (3) the storage and land application of manure. Benchmark data from 2012 on Canadian pig farms showed that 78 % of feed consumed per pig produced at least 75 % of the environmental impacts that occurred during the G/F phase( Reference Mackenzie, Leinonen and Ferguson 5 ). Attention therefore was given to formulating diets only for the G/F phase of production. Diets were formulated in two scenarios for pig production systems in Eastern and Western Canada because the main ingredients used in their typical diets are not the same. Pig diets in Eastern Canada are typically based on maize similar to US pig diets( Reference Thoma, Nutter and Ulrich 16 ), whereas pig diets in Western Canada use wheat and barley as the main cereal component/s( 17 ).

Fig. 1 The structure and main components of the pig production systems as considered by the Life Cycle Assessment model. Feed production in the model included the manufacture of fertilisers and pesticides, etc. as inputs to growing crops.
The life cycle assessment model
The environmental impacts resulting from all diets formulated in this study were calculated using an LCA model of pig systems in Eastern and Western Canada( Reference Mackenzie, Leinonen and Ferguson 5 ). Some aspects of this model were also included as part of the diet formulation process (see Diet formulation rules). The details regarding the main components of the LCA model of Canadian pig farming systems are provided below. The system boundaries of the LCA were cradle to farm gate and the functional unit was 1 kg expected carcass weight (ECW)( Reference Mackenzie, Leinonen and Ferguson 5 ). The breeding and nursery production stages were treated as independent to the G/F phase in this study and remained constant for all comparisons made.
Feed production
The average environmental impacts per kg of ingredient for all ingredients used in the G/F diets can be found in Table 1. Important causes of environmental impact in the feed supply chain for pigs include the following: fossil fuel inputs for fertiliser production, emissions resulting from the spreading of fertilisers, fossil fuel use for field operations, energy inputs to processing (drying, grinding, etc.) and transport( Reference Van Der Werf, Petit and Sanders 18 ). When modelling a complex supply chain, as is the case for animal feed, the inputs to the process (wheat, water, energy, etc.) are shared between the different co-products resulting from these processes, and the environmental impacts associated with them must be allocated. Economic allocation was used as the methodology for co-product allocation throughout the feed supply chain, as advised in the FAO Livestock Environmental Assessment and Performance Partnership recommendations( 19 ). The price ratios found in the online Supplementary Material S1 were used for the purposes of economic allocation. Life cycle inventory (LCI) data for the production of major crops were adapted from a previous LCA on Canadian crop production( Reference Pelletier, Arsenault and Tyedmers 20 ). LCI data for amino acids lysine, methionine, threonine and tryptophan were obtained from an LCA study on the impact of amino acids in pig diets( Reference Garcia-Launay, van der Werf and Nguyen 21 ). LCI data for the production of minerals dicalcium phosphate, salt and limestone came from the Ecoinvent databases( 22 ). LCI data for maize dried distillers grains with solubles (DDGS) from Canadian sources were not available, and therefore were adapted from data representative of ethanol production in the USA( 22 ), assuming the use of Canadian maize and typical electricity mix. The LCI for bakery meal was based on data provided by a large retailer of bakery meal (Sugarich Ltd, unpublished results) and adapted for a Canadian scenario( Reference Mackenzie, Leinonen and Ferguson 23 ). Surplus material from bread production is a large proportion of the material used for bakery meal sold for use in monogastric diets (Sugarich Ltd, unpublished results) and was used as a representative input to bakery meal in this study. The LCI for the production of 1 kg bread was adapted from the LCA food database( Reference Nielsen, Nielsen and Weidema 24 ) with the input of Canadian wheat and energy sources. A price ratio of 10:1 was assumed for bread and surplus material, with an average 10 % of material collected as surplus from the bread supply chain either during the production process or discarded at the supermarket (Sugarich Ltd, unpublished results). Processing inputs for packaging removal, drying and grinding were estimated to be 20 kWh electricity and 62 kWh natural gas/tonne of material processed (Sugarich Ltd, unpublished results). LCI data for meat meal were adapted from a previous LCA study on rendering, and the yields by mass from rendering were assumed to be 57·7 % for fat and 42·3 % for meat meal( Reference Ramirez, Humphries and Woodgate 25 ). The price ratio of rendered fat: meat meal was assumed to be 1·22( Reference Mackenzie, Leinonen and Ferguson 23 ). The LCI data for wheat milling were adapted from Ecoinvent( 22 ) in order to represent Canadian energy inputs. Bread flour yields were estimated to be 73 % on average, with remaining material flows of 2 % wheat germ, 12·5 % wheat shorts and 12 % wheat bran( Reference Blasi, Kuhl and Drouillard 26 ). A price ratio of 1:0·11:0·22:0·44 was assumed for wheat flour–wheat germ–wheat shorts–wheat bran. This was based on the expectation that flour would provide about 90 % of the gross margin for a typical milling operation( 27 ) and Canadian price data for the co-products from wheat milling as animal feed( Reference Mackenzie, Leinonen and Ferguson 23 ).
Table 1 Average environmental impacts per kg for all feed ingredients included in the grower/finisher diets tested

eq, Equivalent; NRRU, non-renewable resource use; AP, acidification potential; EP, eutrophication potential; GWP, global warming potential; DDGS, dried distillers grains with solubles.
* Inventory data for these ingredients was compiled as part of a previous life cycle assessment studies of Canadian pig farming systems( Reference Mackenzie, Leinonen and Ferguson 5 , Reference Mackenzie, Leinonen and Ferguson 23 ).
† Calculated by combining the total normalised NRRU, AP, EP and GWP using the Institute of Environmental Sciences at Leiden University methodology( 39 ) with equal weighting.
Manure model
The manure model estimated the emissions of CH4, NH3, N2O, N2 and NO x , which occurred during housing, storage and application as well as the leaching of NO3 and PO4. Indirect N2O formation resulting from NH3 and NO x emissions and NO3 leaching was also modelled in accordance with the Intergovernmental Panel for Climate Change (IPCC) principles( 28 ). Manure was assumed to remain in the barn for up to 7 d; it was then transferred to outside storage (except in cases where storage was a pit beneath the barn). Manure was expected to be applied to land twice annually in spring and autumn. The model of NH3 emissions for housing and storage was based on a previous model of NH3 emissions from pig production in Canada( Reference Sheppard, Bittman and Swift 29 ). A tier 2 IPCC methodology was adopted for emissions of CH4, N2O, NO x and NO3, but adapted to reflect small N losses from housing. As average ambient temperatures were considered to be <0°C during winter( 30 ), emissions during this period were considered negligible for outside storage methods. The proportional mix of floor types in pig housing, storage and application techniques in each region was based on information from the Livestock Farm Practice Survey( Reference Sheppard, Bittman and Swift 29 ), as well as Statistics Canada records regarding the storage and application of swine manure( Reference Beaulieu 31 , 32 ). All N, P and K excreted via faeces or urine were assumed to be applied to land as fertiliser, once losses during housing and storage were accounted for. Manure applied to land was assumed to replace the need to apply equivalent synthetic fertilisers at a rate of 0·75, 0·97 and 1 for N, P and K, respectively( Reference Nguyen, Hermansen and Mogensen 33 ). The proportional mixture of the types of synthetic fertilisers replaced by the NPK content of the manure in each region was derived from sales figures for Eastern and Western Canada to assume a regional average fertiliser mix( Reference Korol 34 ).
Farm performance
With the exception of feed intake during the G/F stage and carcass yield, the baseline herd performance characteristics (litter size, mortality, etc.) used in this study were as those modelled for pig systems in Eastern and Western Canada in a previous regional LCA study( Reference Mackenzie, Leinonen and Ferguson 5 ). All characteristics of herd performance other than average feed intake and carcass yield were assumed to be independent of feed composition in the G/F production stage( Reference Mackenzie, Leinonen and Ferguson 23 ). Although this represents a simplification made for the purposes of a modelling exercise, it is valid for the scenarios modelled in this study. All diets formulated were nutritionally balanced and were not be expected to have implications on herd health status or mortality during the G/F phase. It is reasonable to expect that other model inputs such as on-farm energy use are independent of feed composition. The on-farm energy consumption data were adapted from a detailed study of energy consumption in conventional pig housing systems in Iowa( Reference Lammers, Honeyman and Harmon 35 ), as there were no equivalent data for Canadian systems available. To reflect longer and colder Canadian winters in comparison with Mason City, Iowa (which was used in the Lammers et al. ( Reference Lammers, Honeyman and Harmon 35 ) calculations), larger loads of liquid petroleum gas (LPG) for heating were assumed to be required to maintain adequate barn temperatures. On the basis of average temperature data for Mason City( 36 ), and regional data for Eastern and Western Canada( 30 ), the LPG inputs for heating barns in Eastern Canada were estimated to be 25 % higher compared with the Iowa case study. LPG input for heating in Western Canada was assumed to be 25 % larger than that for Eastern Canada. These represent approximations as a previous sensitivity analysis showed that the model was not very sensitive to the assumptions made regarding LPG use for any of the impact categories tested here( Reference Mackenzie, Leinonen and Ferguson 5 ). The mix of electricity generation in the LCA was the national mix for the Canadian grid( 37 ); this was assumed for all Canadian unit processes in the LCA.
Quantifying environmental impacts
The environmental impacts of the system were quantified by the LCA using four environmental impact categories. Three of these categories quantified negative impacts resulting from emissions caused by the system – AP, EP and GWP. We included GWP as it has received the most attention in efforts to quantify the impact of livestock systems. The impact categories AP and EP were considered as they quantify the main environmental impacts, which result from the storage and spreading of animal manure. The fourth impact category quantified the systems use of NRRU and was included because of the relatively high usage of cereals and oil seed meals in pig diets, which have a significant input of resources such as fertilisers( Reference Steinfeld, Gerber and Wassenaar 3 ).
System GWP was quantified in CO2 equivalents (eq) on a 100-year timescale using the IPPC methodology( 28 ). The methodology of accounting for GWP caused by land use change in this study followed the PAS 2050 guidelines( 38 ). The methodologies for calculating AP (SO2 eq), EP (PO4 eq) and NRRU (Sb eq) were established by researchers at the Institute of Environmental Sciences at Leiden University (CML)( 39 ). This methodology was chosen as it is designed to quantify these impact categories on a global scale, importantly accounting for the long-term impacts of airborne emissions on global levels of substances, which contribute to AP and EP. The CML methodology for normalising different types of environmental impact( Reference Huijbregts, Breedveld and Huppes 40 ) was also utilised to formulate diets to minimise the combined environmental impact score of the system. The impacts that result from a process are normalised against a reference, which is an estimate of the total annual level of global emissions and resource use caused by human activity( Reference Huijbregts, Breedveld and Huppes 40 ). The normalised scores for AP, EP, GWP and NRRU were then combined additively, with equal weighting to generate a combined environmental impact score in the diet formulation tool. Equal weighting was adopted in this example to ensure that large increases in an individual environmental impact category did not occur when optimising to minimise the combined environmental impact score. The cradle-to-grave environmental impact calculations were performed using the software package SimaPro 7.3.3.
Diet formulation rules
A diet formulation tool was developed that predicted the environmental impacts for each category resulting from G/F diets for the feed supply chain and manure management. The tool also quantified the feed cost per kg LW gain for each solution. The tool formulated diets using linear programming in Microsoft Excel® with the software plug-in open solver( Reference Mason 41 ). Nutritional values for all ingredients in the diets were primarily taken from the Stein Monogastric Nutrition Laboratory ingredient matrix( 42 ). In cases where certain values were missing (or ingredients themselves were missing from the matrix), values from the NRC 2012 feed ingredient tables( 43 ) and the Premier Nutrition Atlas( 44 ) were used. All the G/F diets were formulated with four feeding phases (starter, grower, finisher and late finisher); this reflected typical feeding programmes adopted by commercial pig operations in Canada( Reference Mackenzie, Leinonen and Ferguson 5 ).
The predicted start weight of the pigs in the diet formulation tool was fixed at 27·4 kg with a finish weight of 124 kg for the G/F phase, based on benchmark data collected for a previous LCA study of Canadian pig farming( Reference Mackenzie, Leinonen and Ferguson 5 ). Diets were not formulated for a fixed nutritional density, but rather this was an outcome of the solution for a specific objective. The average feed intake per pig for each diet within a feeding phase was predicted based on meeting the animal’s requirements for growth. The net energy (NE) requirement for each feeding phase was defined in compliance with the NRC 2012 animal requirement tables( 45 ). Minimum nutrient levels in g/MJ of NE were then defined for each feeding phase, so that the digestible protein and macronutrient contents of the feed would not be limiting for animal growth( 45 ). It was thus assumed that feed intake was driven by the animal’s need to meet its daily energy requirements; as such feed intake increased when diets of reduced energy density were fed( Reference Kyriazakis and Emmans 46 , Reference Patience 47 ). The average predicted NE intake was constant for all diets. As all diets were nutritionally balanced, the animals were expected to spend the same average number of days in the barn over the course of the G/F phase. When diets were formulated at reduced energy density, daily feed intake was expected to compensate for this. Any effects the increased daily intake may have had on gut fill were taken into account( Reference Mackenzie, Leinonen and Ferguson 23 ).
Average ingredient prices and availability in Ontario and Manitoba for 2015 were provided by Trouw Nutrition (derived from Statistics Canada data( 48 ) – see online Supplementary Material S2 for the list of available ingredients and price ratios in each region). These were used to represent typical diet formulation scenarios for Eastern and Western Canada. Ontario and Manitoba produced about 24 and 23 % of the total pigs marketed in Canada in 2011, respectively( Reference Brisson 49 ). Importantly, maize was not considered as an available ingredient in the Western diets as is typical in many scenarios in this region; similarly, barley was not considered as an available ingredient in the Eastern diets (A Pharazyn, unpublished results).
The average gain:feed ratio over the G/F phase in the benchmark data for Canadian pigs was 0·365( Reference Mackenzie, Leinonen and Ferguson 5 ) with feed intake of 264 kg/pig based on the mean start and finish weights. This was used as a starting point for the assumptions on average feed intake in this study. A dietary specification was defined, which represented an industry standard to ensure that the feed:LW gain ratio was minimised within reasonable commercial constraints. The specifications for this ‘typical’ diet are given in Table 2, and it was assumed that this diet ensured an average gain:feed ratio of 0·365. Lower limits were defined for the nutritional density of the diets for each feeding phase. These were set at 95 % of the energy content of the typical industry diet in the first two feeding phases and at 92·5 % for the latter two feeding phases. These restrictions were to ensure that feed intake would not be restricted by gut fill, which can be caused by diets of lower nutrient density, which contain a larger proportion of bulky feed( Reference Kyriazakis and Emmans 46 ). These minimum specifications of the G/F diet for each phase can also be found in Table 2. For each ingredient, a maximum inclusion rate was defined for each feeding phase in order to account for any anti-nutritional properties or other negative impacts on animal performance due to variability. These limits were based on guidance for pig farmers provided by the Ontario Ministry of Agriculture, Food and Rural Affairs( 50 ) as well as peer-reviewed studies in the case of some important co-products( Reference Mackenzie, Leinonen and Ferguson 23 ) (see online Supplementary Material S3 for further details on ingredient inclusion limits).
Table 2 The nutritional specifications of the ‘typical’ grower/finisher diet for Canadian pig systemsFootnote *

* The lower limits permitted in the diet formulation rules used in this study are also shown.
The retention of N in finished pigs was calculated using the principles of Wellock et al. ( Reference Wellock, Emmans and Kyriazakis 51 ) and was assumed to be 0·0256 (sd 0·00128) body weight (BW). Retentions of P and K were calculated using an isometric relationship of body composition with BW( Reference Symeou, Leinonen and Kyriazakis 52 ) and were assumed to be approximately 0·005 (sd 0·00025) and 0·002 (sd 0·0001) BW, respectively. For K, this assumption represents a linear approximation around slaughter weight of a curvilinear relationship( Reference Rigolot, Espagnol and Pomar 53 ). All N, P and K not retained by the finished pigs were assumed to be excreted via faeces or urine. The predicted levels of nutrient excretion were required as inputs to the manure model.
Diets formulated
The process followed to formulate G/F diets for environmental impact objectives is shown as part of Fig. 2. The average values of NRRU, AP, EP and GWP/kg of each ingredient as seen in Table 1 were added to the list of ingredient properties in the diet formulation tool. In addition to this, equations that predicted the average environmental impact per kg of N, P and K excretion assuming an average mix of manure management practices were extracted from the manure sub-model of the LCA( Reference Mackenzie, Leinonen and Ferguson 5 ). This enabled the tool to account for the environmental impact resulting from predicted levels of nutrient excretion when formulating the diets. Thus, for any diet formulated, the average values of NRRU, AP, EP and GWP resulting from the feed supply chain and manure storage and application were predicted.
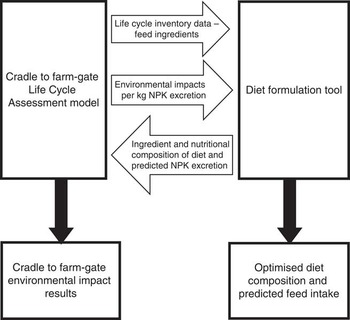
Fig. 2 Schematic of the methodology followed in this study to formulate diets for environmental impact objectives.
The tool was used to formulate G/F diets for both economic and environmental impact objectives. Two diets were formulated for economic objectives: (1) to minimise feed cost per kg LW gain (least cost) and (2) to minimise feed cost per kg LW gain with a requirement to maintain a certain level of feed efficiency (least-cost EFF). The NE content of the latter diet was fixed, so that the feed:LW gain ratio was minimised within reasonable commercial constraints. The minimum specifications of this diet were the ‘industry standard’ energy and nutrient levels shown in Table 2. This is a common commercial scenario, whereby diets are formulated for least cost without compromising feed efficiency( Reference Ferguson 1 ). This diet was included to quantify whether this strategy has any benefit for the environmental impact of the system compared with considering feed cost alone.
Four diets were formulated to minimise the individual environmental impact categories NRRU, AP, EP and GWP. A further diet was formulated to minimise the combined environmental impact (least EI) of the G/F phase, as measured using the combined normalised levels of NRRU, AP, EP and GWP under the CML methodology( 39 ) with equal weighting. All diets formulated for environmental impact objectives were restricted to a 30 % maximum cost increase in comparison with the least cost diet. Diets were formulated for these objectives in both regional scenarios for ingredient prices and ingredient availability for Eastern and Western Canada. Diets were formulated using linear programming. The resulting diets were optimal solutions based on the mean nutritional and environmental impact properties of the ingredients, as well as the mean impact levels associated with nutrient excretion calculated by the LCA.
Dietary comparisons in the life cycle assessment model
Accounting for the uncertainty in LCA is important to produce credible and reliable results( Reference Lloyd and Ries 54 ). In this study, an uncertainty analysis was used for statistical comparison of the diet formulations. The cradle to farm gate LCA model was hosted in the specialist software SimaPro. All input parameters had a mean, associated distribution (e.g. normal, lognormal, etc.) and standard deviation. The uncertainty in the environmental impact calculations was quantified using Monte Carlo simulations( Reference Mackenzie, Leinonen and Ferguson 5 ). Variability in all characteristics of herd performance other than feed intake was assumed to be independent of feed composition in the G/F production stage. Feed intake for each simulation was a function of the energy density of the diet in relation to the average energy requirement of the herd over the G/F production stage. This requirement had a distribution to represent variation in feed intake due to genetic and environmental factors, which were assumed to be independent of the feed composition.
As shown in Fig. 2, each diet was tested in the cradle to farm gate LCA of pig farming systems in Eastern and Western Canada. In each case, 1000 simulations of the model were run in order to calculate the NRRU, AP, EP and GWP of the system when adopting these diets. This number of simulations ensured that the SEM of the results for each impact category were low enough for good repeatability( Reference Mackenzie, Leinonen and Ferguson 5 ). Parallel Monte Carlo simulations were used to compare all other diets with the least-cost diet. The parallel simulations enabled the model to determine whether the diets had resulted in any significant changes to the environmental impact levels of the system compared with the least-cost scenario. This method of uncertainty analysis to distinguish between two scenarios in an LCA model was described in detail by Mackenzie et al. ( Reference Mackenzie, Leinonen and Ferguson 5 ). In brief, uncertainties were categorised as either specific to the system (α) or shared between the systems being compared (β)( Reference Leinonen, Williams and Wiseman 55 , Reference Leinonen, Williams and Waller 56 ). For each simulation, a value for each parameter was randomly selected from the specified distribution input for this variable. Where parameters are shared between two scenarios being tested (e.g. maize yield (kg/ha) when feeding two different diets containing maize), for each individual comparison the same point on the distribution is selected. In this case, variations in all parameters except the G/F diet composition, the resulting feed intake and nutrient excretion during the G/F phase and carcass yield were considered as shared uncertainty in the comparisons. Although the average energy requirement was variable to account for differences caused by animal and environmental factors, in each comparison, the NE intake was the same for both diets. The key output of the simulations was the frequency in which the environmental impact of one scenario was greater or smaller than the second scenario for each impact category tested. Environmental impact levels were reported as significantly different in cases where P<0·05 over 1000 parallel simulations of the LCA model. This allowed the model to account for shared uncertainty between two systems (in this case diets) modelled in the LCA, but provide a useful answer as to which is likely to have greater environmental impact.
Results
Diet composition
The overall ingredients and nutritional composition of the diets formulated for Eastern and Western Canada are in Tables 3 and 4, respectively, along with the predicted feed cost and average feed intake per pig for each diet. For both regional scenarios, the least-cost diet had the lowest nutritional density, and thus the highest average predicted feed intake over the G/F cycle of the diets formulated. The least-cost EFF diet minimised feed intake (by design) and was cheaper per kg LW than all diets formulated for environmental impact objectives.
Table 3 The overall ingredients and nutritional composition (across all four feeding phases) of the grower/finisher diets formulated for different objectives for Eastern CanadaFootnote *

Least cost, least feed cost per kg live weight gain; least-cost EFF, least cost/kg live weight gain while maximising feed efficiency within commercial constraints; NRRU, non-renewable resource use; AP, acidification potential; EP, eutrophication potential; GWP, global warming potential; HP, high protein; least EI, least combined environmental impact score; CP, crude protein; CAD, Canadian dollars; DDGS, dried distillers grains with solubles; AV, animal-vegetable.
* All ingredient inclusion and nutrient levels shown are g/kg as fed unless otherwise stated. The average predicted feed intake and feed costs for each grower/finisher diet are also shown.
Table 4 The overall ingredients and nutritional composition (across all four feeding phases) of grower/finisher diets formulated for different objectives for Western CanadaFootnote *

Least cost, least feed cost per kg live weight gain; least-cost EFF, least cost/kg live weight gain while maximising feed efficiency within commercial constraints; NRRU, non-renewable resource use; AP, acidification potential; EP, eutrophication potential; GWP, global warming potential; least EI, least combined environmental impact score; HP, high protein; CP, crude protein; CAD, Canadian dollars; DDGS, dried distillers grains with solubles; AV, animal-vegetable.
* All ingredient inclusion and nutrient levels shown are g/kg as fed unless otherwise stated. The average predicted feed intake and feed costs for each grower/finisher diet are also shown.
Of the diets formulated for environmental impact objectives, the least-NRRU diets were the most expensive in both regions, resulting in a 30 % increase in feed cost in comparison with the least-cost diet. The least-GWP diets also resulted in large increases in feed cost per kg LW of 30 and 23 % in the East and West Canadian scenarios, respectively. The least-NRRU and least-GWP diets raised feed costs significantly owing to increased inclusions of relatively expensive protein meals (soyameal and rapeseed meal). The least-AP diet increased feed costs by 12 % in Eastern Canada and 16 % in Western Canada compared with the least-cost diet. The least-EI diets were 12 % more expensive than the least-cost diet in both regions. The least-EP diet was the cheapest of the diets formulated for environmental impact objectives, increasing feed costs by 8 and 6 % compared with the least-cost diet in Eastern and Western Canada, respectively.
In both regions, the least-GWP diet was the most energy dense of all the diets formulated for environmental impact objectives (along with the least-EI diet in the East), with feed intake being the same as the least-cost EFF diet. The West Canadian least-EI diet was less energy dense, and thus average feed intake per pig was higher at 274 kg in comparison with 264 kg/pig in the Eastern scenario. The least-EP diet reduced average feed intake by 3 % in the Eastern scenario and 6 % reduced average feed intake in the West. Compared with the least-cost diet, average feed intake was 5 % lower for the least-AP diet in the East Canadian scenario and 4 % in the West. The least-NRRU diets were the least nutritionally dense of the environmental impact objective diets with feed intake 2 % lower in the East and 4 % lower in the West in comparison with the least-cost diet.
The least-cost EFF diet contained the largest amount of cereals (maize in the East and wheat/barley in the West) of all diets formulated. In both regions, this diet contained the lowest levels of co-products (such as maize DDGS and wheat shorts), as well as an increased combined inclusion of oilseed meals (rapeseed meal and soyameal), compared with the least-cost diet. All diets formulated for environmental impact objectives in Eastern Canada included the maximum allowed levels of bakery meal in the G/F diets. Similarly, with the exception of the least-NRRU diet, all diets formulated for environmental impact objectives in Eastern Canada contained the maximum amount of wheat bran. This was not the case for the wheat/barley-based diets formulated in Western Canada.
In both regions, the least-NRRU diet contained the lowest combined inclusion of whole cereals (wheat, barley and maize). The least-NRRU diet contained no synthetic amino acid supplements or maize DDGS in either region. In both regions, the least-GWP and least-NRRU diets were very similar: both contained high levels of wheat shorts and, in the East, bakery meal and meat meal. There was also an increased inclusion of soyameal in the least-GWP diets with very little synthetic amino acid supplementation compared with the least-cost formulation.
Environmental impacts: Eastern Canada
The environment impact results per kg of ECW from cradle to farm gate for the East Canadian diets when tested in the LCA model are given in Table 5. The relative trade-offs of diets formulated for different objectives in terms of environmental impact, feed cost and feed intake are shown in Fig. 3 for Eastern Canada. The least-cost EFF diet reduced NRRU and GWP by 8 and 3 %, respectively, compared with the least-cost diet; levels of AP and EP were not significantly different between these two scenarios. The combined environmental impact score of the least-cost EFF diet was marginally lower than the least-cost diet by <1 %.

Fig. 3 The environmental impacts, feed cost and feed intake per kg of carcass weight for grower/finisher diets in Eastern Canada formulated for different objectives, represented as a fraction of the results for the least-cost diet. Least cost (![]() ), least feed cost per kg live weight gain; least-cost EFF (
), least feed cost per kg live weight gain; least-cost EFF (![]() ), least cost/kg live weight gain while maximising feed efficiency within commercial constraints; NRRU (
), least cost/kg live weight gain while maximising feed efficiency within commercial constraints; NRRU (![]() ), non-renewable resource use; AP (
), non-renewable resource use; AP (![]() ), acidification potential; EP (
), acidification potential; EP (![]() ), eutrophication potential; GWP (
), eutrophication potential; GWP (![]() ), global warming potential; least EI (
), global warming potential; least EI (![]() ), least combined environmental impact score.
), least combined environmental impact score.
Table 5 The environmental impacts per kg of carcass weight for grower/finisher diets in Eastern Canada formulated for different objectives
eq, Equivalent; least cost, least feed cost per kg live weight gain; least-cost EFF, least cost/kg live weight gain while maximising feed efficiency within commercial constraints; NRRU, non-renewable resource use; AP, acidification potential; EP, eutrophication potential; GWP, global warming potential; least EI, least combined environmental impact score; CML, Institute of Environmental Sciences at Leiden University; NS, not significantly different from the least-cost diet (P>0·05).
Reductions in NRRU (48 %), AP (5 %), EP (6 %) and GWP (17 %) were made when diets were formulated to minimise these impact categories in comparison with the least-cost diet. The maximum reduction achieved in the combined environmental impact score was 5 % when optimising the G/F diets for this objective compared with the least-cost diet. In each case, diets aimed at minimising the individual environmental impact categories resulted in increases in some of the other impact categories tested, compared with the least-cost diet. The least-NRRU diet also reduced GWP by 14 %, but increased AP and EP by 46 and 49 %, respectively. Similarly, the least-GWP diet reduced NRRU by 44 % but increased AP by 26 % and EP by 28 % . The least-AP diet increased NRRU by 19 %, whereas EP was reduced by 5 % with no significant qdifference in GWP. The least-EP diet also meant that AP was 5 % lower; however, NRRU and GWP increased by 13 and 3 %, respectively. The least-EI diet did not increase any of the four environmental impact categories tested – the only diet formulated to achieve this.
Environmental impacts: Western Canada
The environment impact results per kg of ECW from cradle to farm gate for the diets in Western Canada when tested in the LCA model are in Table 6. The relative trade-offs of diets formulated for different objectives in terms of environmental impact, feed cost and feed intake are shown in Fig. 4 for Western Canada. The least cost EFF diet resulted in a 6 % increase in NRRU and 4 % lower levels of AP, whereas EP and GWP did not change. The combined environmental impact score of the least-cost EFF diet was 3 % lower than the least-cost diet.

Fig. 4 The environmental impacts, feed cost and feed intake per kg of carcass weight for grower/finisher diets in Western Canada formulated for different objectives, represented as a fraction of the results for the least-cost diet. Least cost (![]() ), least feed cost per kg live weight gain; least-cost EFF (
), least feed cost per kg live weight gain; least-cost EFF (![]() ), least cost/kg live weight gain while maximising feed efficiency within commercial constraints; NRRU (
), least cost/kg live weight gain while maximising feed efficiency within commercial constraints; NRRU (![]() ), non-renewable resource use; AP (
), non-renewable resource use; AP (![]() ), acidification potential; EP (
), acidification potential; EP (![]() ), eutrophication potential; GWP (
), eutrophication potential; GWP (![]() ), global warming potential; least EI (
), global warming potential; least EI (![]() ), least combined environmental impact score.
), least combined environmental impact score.
Table 6 The environmental impacts per kg of carcass weight for grower/finisher diets in Western Canada formulated for different objectives
eq, Equivalent; least cost, least feed cost per kg live weight gain; least-cost EFF, least cost/kg live weight gain while maximising feed efficiency within commercial constraints; NRRU, non-renewable resource use; AP, acidification potential; EP, eutrophication potential; GWP, global warming potential; least EI, least combined environmental impact score; CML, Institute of Environmental Sciences at Leiden University; NS, not significantly different from the least-cost diet (P>0·05).
Reductions in NRRU (46 %), AP (17 %), EP (10 %) and GWP (24 %) were made when diets were formulated to minimise these impact categories in comparison with the least-cost diet. A 7 % reduction was made in the combined environmental impact score per kg of ECW when this was the objective. Diets optimised to minimise the individual environmental impact categories resulted in increases in some of the other impact categories tested, compared with the least-cost diet. The least-NRRU diet also reduced GWP by 19 % but increased AP and EP by 28 %. Similarly the least-GWP diet increased AP by 8 %, EP by 16 % with NRRU reduced by 37 % compared with the least-cost diet. The least-AP diet increased NRRU by 28 % and did not significantly alter EP or GWP. The least-EP diet meant that AP was 7 % lower; however, NRRU increased by 8 % with no significant change in GWP. The least-EI diet in the West reduced AP (17 %), but did increase NRRU by 17 %, with no significant difference in EP or GWP compared with the least-cost diet.
Discussion
As feed production and manure management are the main sources of environmental impact in pig production systems( Reference Mackenzie, Leinonen and Ferguson 5 , Reference Basset-Mens and Van Der Werf 6 , Reference Reckmann, Traulsen and Krieter 13 , Reference Thoma, Nutter and Ulrich 16 ), it is logical to consider diet formulation as a mechanism to reduce the environmental impact of pig production. In this study, we formulated diets for the G/F production stage as this is where the majority of feed intake occurs per finished pig( Reference Mackenzie, Leinonen and Ferguson 5 ). There is also potential to formulate sow diets for environmental impact objectives to make reductions to the environmental impact of pig production systems. Although previous analysis of the farming systems modelled here showed that the proportion of environmental impacts from this production phase is approximately 15 %/kg ECW for most impact categories( Reference Mackenzie, Leinonen and Ferguson 5 ). Previous LCA studies have used scenario testing to demonstrate the potential for dietary changes to reduce the environmental impact of non-ruminant livestock systems( Reference Eriksson, Elmquist and Stern 12 , Reference Garcia-Launay, van der Werf and Nguyen 21 , Reference Leinonen, Williams and Waller 56 – Reference Ogino, Osada and Takada 58 ). In this study, we used a different approach by developing a novel methodology, which integrated a cradle to farm gate LCA model into a diet formulation tool to formulate diets for specific environmental impact objectives. Methodologies such as this one allow nutritionists to integrate environmental impact objectives into diet formulations and for livestock producers to quantify the environmental impact of different feeding strategies. The methodology was associated with several challenges that are discussed below. The effectiveness of the methodology as a tool to reduce the environmental impacts of pig production systems and the strategies it identified to achieve this are then addressed.
Methodological challenges
Accounting for environmental impacts caused by ingredient choice, as well as nutrient excretion
Previous LCA studies using LCI data to formulate diets that minimise the environmental impacts per kg of diet( Reference Nguyen, Bouvarel and Ponchant 59 , Reference Moe, Koehler-munro and Bryan 60 ) have not taken into account the implications for nutrient excretion and the resulting environmental impacts. Predicting nutrient excretion is a common step in diet formulation. There are equations that can be integrated within animal growth models to predict nutrient excretion for a larger range of scenarios, using a more mechanistic approach than the one adopted in this study( Reference Ferguson 1 , Reference van Milgen, Valancogne and Dubois 61 ). Previous studies have formulated diets where minimising nutrient excretion or levels of methane emissions were explicit objectives, as a way of incorporating environmental goals into least-cost formulation( Reference Pomar, Dubeau and Létourneau-Montminy 62 , Reference Moraes and Fadel 63 ). These studies, however, did not adopt a holistic LCA approach to quantify whether reductions in these specific emissions reduced the cradle to farm gate environmental impacts of the production system. The method developed in this study accounted for the aggregated environmental impacts during manure management caused by N, P and K excretion when formulating diets for environmental impact objectives. It predicted the feed intake required for pigs to reach a target weight with any N, P and K not retained by the animal excreted via urine or faeces. A component of an LCA of pig farming systems was integrated into the diet formulation algorithm to predict the NRRU, AP, EP and GWP, which resulted from the storage and application to land of excreted nutrients as manure( Reference Mackenzie, Leinonen and Ferguson 23 ). This included an estimate of the potential of the nutrients contained in the manure produced to replace mineral fertilisers being applied to fields in crop systems, an approach known as system expansion( Reference Thomassen, Dalgaard and Heijungs 64 ). This approach incorporates the potential benefits of replacing mineral fertilisers with manure as well as accounting for the extra emissions this may cause. To our knowledge, this is the first time a diet formulation tool using a holistic LCA approach from cradle to farm gate has been developed to formulate livestock diets for environmental impact objectives.
Formulating diets for multiple environmental impact objectives
When formulating diets for environmental impact objectives in livestock systems, adopting a single metric is necessary in order to optimise diets for this purpose using linear programming. However, diets formulated to minimise one impact category may cause large increases in another type of environmental impact. If multiple environmental impact categories are to be accounted for when using linear programming, a combined environmental impact score must be defined. Combining environmental impacts in a meaningful way is a significant methodological challenge to LCA practitioners; its subjective nature means there is little agreement on how best to approach it( Reference Finnveden, Hauschild and Ekvall 65 ). In this study, the CML global normalisation methodology was adopted; there are many more complex methods for combining impacts that give various weightings to different types of impact( Reference Goedkoop and Spriensma 66 , Reference Soares, Toffoletto and Deschênes 67 ), but these methods are still based on subjective allocations of importance to the different impact categories. Such weightings are not currently recommended in the International Organization for Standardization standard for Life Cycle Impact Assessment( Reference Finnveden, Hauschild and Ekvall 65 , 68 ). It was not the purpose of this study to advance the discussion on how best to weigh environmental impacts. Any solution produced to minimise a metric for combined environmental impact is dependent on the methodology used to quantify it. Subjective choices such as which impact categories are included and how these categories are then weighted (to name only two) will hugely influence the outcome. The step of combining the impact categories provided the formulation tool with a framework to assess the trade-offs between decreases in one type of environmental impact and increases in another. Some methodologies have monetised the environmental impact categories using either the preferences of a panel, or the authors’ stated preferences to give a monetary value to different impact categories( Reference Weidema 69 , Reference Finnveden, Eldh and Johansson 70 ). Further work to define acceptable methodologies for the monetisation of environmental impacts would enhance efforts to reduce the environmental impact of livestock systems. This could allow feed cost and environmental impacts to be integrated into a single objective to formulate diets, which are economically and environmentally more sustainable.
Allowing flexibility in the diet formulation rules to identify the optimal nutritional strategies for environmental impact objectives
Previous studies that have formulated diets for environmental impact objectives have done so for a fixed minimum nutritional specification for energy (MJ/kg) and nutrient content (g/kg), above which feed intake was assumed not to be affected( Reference Nguyen, Bouvarel and Ponchant 59 , Reference Moe, Koehler-munro and Bryan 60 ). This is a fairly restrictive way to formulate diets, and there is no consideration of the trade-off between environmental impact per kg of feed and feed intake. In this study, the formulation algorithm accounted for the expected effect of energy density on feed intake and identified the optimum energy density across each feeding phase for a particular impact objective. This approach is common in commercial diet formulation as maximising gain to feed will not always result in the optimum outcome in terms of feed cost or other economic objectives( Reference Ferguson 1 ). This was evident in the diets formulated to minimise feed cost per kg LW gain, which were the least energy dense of all diets formulated in this study. Livestock diets have not been previously formulated for environmental impact objectives using this flexible approach to the nutritional density of the solution.
In this study, improving gain:feed ratio on a least-cost basis reduced the environmental impacts of the farming system, as shown by the least-cost EFF diet in both regions having a lower combined environmental impact score than the least-cost diets. The diets formulated for least NRRU, AP and EP, however, did not maximise gain:feed ratio in both the East and the West Canadian scenario. The optimum energy density of the G/F diet was also different for each of the impact objectives. Similarly the least-EI diets in the scenarios for Eastern and Western Canada also had differing energy densities, showing the need for flexibility when formulating diets for environmental impact objectives depending on the available ingredients. Formulating diets for a fixed minimum nutritional specification at an assumed feed intake would have restricted the ability of the tool to minimise both individual environmental impact categories and the combined environmental impact score of the system. This is the first study to present a diet formulation algorithm that has the flexibility to identify the optimal nutritional density of livestock diets for different environmental impact objectives. The study demonstrated how environmental impact objectives can be integrated into modern diet formulation tools. The integration of diet formulation and LCA could be utilised to weigh the relative costs of reducing specific types of environmental impact from modern pig farms through diet manipulation. The approach could also be used to help modern pig production systems adapt and limit their liability to environmental taxes imposed on them.
Formulation strategies for environmental impact reduction
In most cases (with the exception of EP in the east and AP in the west), diets formulated for environmental impact objectives had a lower total inclusion of whole cereals (maize, wheat or barley) than diets formulated for economic objectives. This is because when formulating diets for environmental impact objectives, the environmental ‘cost’ of production compared with the nutritional profile of these cereals is less favourable than their market value. When available, bakery meal was included at (or close to) maximum allowed levels in all diets formulated for environmental impact objectives. Bakery meal has relatively low levels of environmental impacts in the categories tested, and has high nutritional value as an ingredient in diets fed to growing pigs (although there are concerns about its variability)( 50 ). Apart from these two examples, there were a few uniform trends observed in the strategies adopted for different environmental impact objectives.
When minimising NRRU and GWP, high-protein diets were formulated with increased inclusions of soyameal and co-products such as wheat shorts, wheat bran and meat meal. Amino acid supplementation was not utilised when minimising NRRU and GWP. This contrasted with previous studies, conducted mainly in Europe, suggesting low-protein diets with amino acid supplementation as a method of reducing GWP in pig production systems( Reference Garcia-Launay, van der Werf and Nguyen 21 , Reference Ogino, Osada and Takada 58 , Reference Mosnier, van der Werf and Boissy 71 ). The reason for the difference is that the majority of soyameal used in European animal feed is imported from South America( Reference Krautgartner, Henard and Rehder 72 ) and is associated with recent land use change, which carries a significant environmental impact penalty. Similarly, maize DDGS was also excluded from the least-GWP and least-NRRU diets because its production is associated with high levels of these impact categories (Table 1), due to energy inputs for drying and processing( 22 ). Previous LCA studies have also found that including maize DDGS in pig diets increased GWP in pig farming systems( Reference Thoma, Nutter and Ulrich 16 , Reference Mackenzie, Leinonen and Ferguson 23 , Reference Stone, Dollarhide and Benning 73 ).
In order to minimise AP and EP, diets were formulated with increased amino acid supplementation to minimise crude protein content. Other studies that have used scenario testing to assess the effect of amino acid supplementation in pig diets on the system’s environmental impacts have made similar conclusions( Reference Garcia-Launay, van der Werf and Nguyen 21 , Reference Ogino, Osada and Takada 58 ). The results from both regions showed that increased inclusions of maize DDGS can be used as part of balanced G/F diets to minimise EP and AP in pig farming systems. This finding contradicts previous studies that individually tested the effect of including DDGS in Canadian pig diets( Reference Mackenzie, Leinonen and Ferguson 23 ). The reason for the contradiction is due to differences in formulation objectives, with previous studies formulating for least cost rather than formulating for environmental impact objectives. This highlights the advantage of explicitly formulating pig diets for environmental impact objectives. A diet formulation algorithm can be used to formulate a balanced solution that includes ingredients that reduce the overall levels of a particular impact category, while simultaneously accounting for the trade-off between changes in feed intake and potential reductions in the environmental impacts per kg of the diet fed.
Effectiveness of optimisation as a strategy to reduce environmental impact in pig systems
The results of this study showed that through optimising G/F diets specifically for the purpose of reducing the environmental impact of pig production, it is possible to reduce the overall levels of NRRU, AP, EP and GWP in both maize- and wheat/barley-based diets. Relatively large proportional reductions were shown to be possible in the levels of NRRU and GWP in both regions when optimising to minimise the impacts individually. However, because of increases in EP and AP, these diets increased the combined environmental impact score of the system. Such outcomes can only be considered a reduction in the environmental impact of the system if environmental impact categories other than the objective (e.g. GWP) are considered unimportant. This is difficult to justify in the case of pig farming systems that have been shown to cause relatively small levels of GWP compared with meat produced from ruminants( Reference de Vries and de Boer 9 – Reference Eshel, Shepon and Makov 11 ). The results show the importance of considering multiple impact categories when using linear programming to optimise diets to reduce the environmental impacts of livestock systems.
Optimising G/F diets to minimise the combined environmental impact score resulted in relatively modest reductions (approximately 5 %) in the pig farming system in both regions. Cost was not the limiting factor for further reduction of the combined environmental impact score of the system; as the least-EI diets in both regions were below the 30 % increase limit on feed cost. Further reductions in the combined environmental impact score through diet optimisation were restricted by the contrasting formulation strategies required to minimise NRRU and GWP compared with those for AP and EP. The solutions for least NRRU and least GWP were high-protein diets, which included large amounts of low-value co-products. However, the diets for least EP and AP minimised dietary protein content and increased levels of amino acid and mineral supplementation; production of these ingredients had high NRRU and GWP. This meant the possible reductions in the combined environmental impact score were much lower than those for individual environmental impact categories such as GWP or NRRU.
There are examples of policies using financial penalties or rewards to provide economic incentives for livestock producers to reduce their environmental impacts. These have included taxes on spreading fertilisers in the European Union( 74 ) and payments to farmers for reducing the greenhouse gas emissions caused by farming activities in Australia (the carbon farming initiative)( 75 ). Methodologies such as those presented here could be used to evaluate how livestock producers might adapt formulation strategies under such mechanisms, and whether these changes would reduce the cradle to farm gate environmental impact of livestock systems for a particular impact category. It is also possible to carry out sensitivity analyses in order to estimate the necessary levels of penalty or payments to incentivise changes that reduce the levels from cradle to farm gate by x % for a given impact category.
Conclusions
A modified diet formulation algorithm was designed, which integrated important elements of an existing LCA model into a linear programme for diet formulation, in order to formulate G/F diets for environmental impact objectives. The flexibility of this approach allowed it to identify the optimum nutritional composition of the diets for a particular environmental impact objective as well as altering the ingredient composition. The optimum energy density of the G/F diet was different for each of the environmental impact objectives. Through optimising diets for individual environmental impact categories, relatively large reductions in NRRU and GWP were found to be possible compared with the least-feed cost diet; however, these came at the expense of increases in AP and EP. The results showed that the easy solution to minimise environmental impacts is not always to feed a low-energy diet, high in co-products. This was demonstrated by the least-GWP diets, which in both regions were the most energy dense along with the least-cost EFF diets. Diets were also formulated to minimise a combined environmental impact score for NRRU, AP, EP and GWP, which enabled reductions in the environmental impacts of the system without any large increases in individual impact categories. Further studies to define acceptable methodologies to combine and monetise different categories of environmental impact could allow feed cost and environmental impacts to be integrated into a single objective. This would allow nutritionists to formulate diets that are economically and environmentally more sustainable. This study demonstrated how environmental impact objectives can be integrated into modern diet formulation tools for livestock production systems using LCA.
Acknowledgements
The authors would like to thank Peter Latham and Sugarich Ltd for providing usable data on the production process for bakery meal.
This project was sponsored by Trouw Nutrition Canada in the form of a postgraduate studentship to S. G. M.
This paper derives from the doctoral thesis of S. G. M. under the supervision of I. K., I. L. and N. F. All authors contributed to designing the formulation tool and the scenarios to be tested. S. G. M. constructed the diet formulation tool, formulated the diets and conducted the LCA model simulations. All the authors contributed to the interpretation of the outcomes and the reporting of the paper.
The authors declare that there are no conflicts of interest.
Supplementary Material
For supplementary material/s referred to in this article, please visit http://dx.doi.org/doi:10.1017/S0007114516000763


