


With the rising prevalence of obesity, especially in deprived communities in the UK(Reference Heslehurst, Ells and Simpson1), there are increased risks for maternal and fetal health such as gestational diabetes, pre-eclampsia and complicated delivery(Reference Sebire, Jolly and Harris2). However, also in deprived communities there is a higher incidence of low birth weight (LBW) and its associated infant mortality and morbidity(3). The present study explores maternal BMI and infant anthropometrics in a multi-ethnic community in East London.
Women were recruited at their first antenatal appointment (n 402). Maternal and infant anthropometric measurements were taken by midwives and participants stated their own ethnic origin. Participants gave written consent and approval was given by the local research ethics committee.
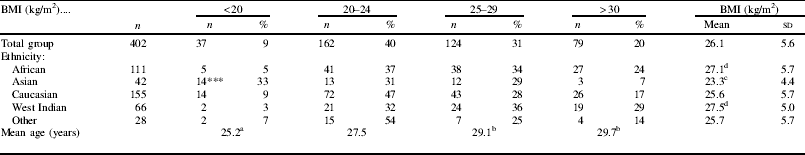
There were no differences in gestational age at the first appointment between BMI groups (81–84 d). Half the sample had a BMI of ≥25 kg/m2, indicating that they were overweight at the start of their pregnancy, and of these 20% were classified as obese (BMI>30 kg/m2).
a,b Values within the row with unlike superscript letters were significantly different (ANOVA; post-hoc Tamhane 2; P<0.001).
c,d Values within the column with unlike superscript letters were significantly different (ANOVA; post-hoc Tamhane 2; P<0.001). Value was significantly different from those for other ethnic groups (x2):
*** P<0.001.
Asians were more likely to have a BMI<20 kg/m2 (P<0.001) and the mean BMI differed between the ethnic groups, with Asians having a lower mean BMI than African and West Indians (P<0.001). The mean age also differed by BMI group: those with a BMI<20 kg/m2 were significantly younger than those with a BMI of 25–29 kg/m2 and >30 kg/m2 (P<0.001).
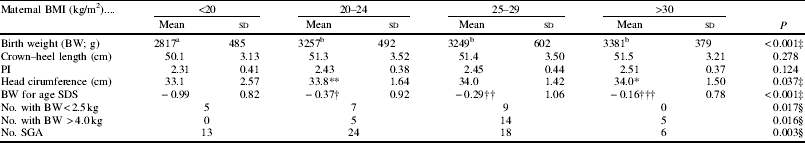
n 353. PI, ponderal index (100×(weight (g)/length (cm3))); SDS, sd score; SGA, small for gestational age defined as <10th centile BW for gestational age.
a,b Values within the row with unlike superscript letters were significantly different (Tamhane 2; P<0.001). Values were significantly different from those for <20 kg/m2 group (Tukey-HDS):
* P=0.044,
** P=0.028. Values for SDS were significantly different from those for <20 kg/m2 group (Tamhane 2):
† P=0.002,
†† P=0.001,
††† P<0.001.
‡ ANOVA.
§ x2.
Women with a BMI<20 kg/m2 gave birth to infants who on average weighed less, had a smaller head circumference and had a lower birth weight for gestational age sd score than those from the other BMI groups. However, there was no difference in thinness as measured by ponderal index. Mothers in the highest BMI group were less likely to have an infant who was small for gestational age (SGA) and mothers in the lowest BMI group were more likely to have an infant who was SGA (P=0.003). Of women in the lowest BMI group 15% gave birth to an infant with a LBW compared with none in the highest BMI group.
In conclusion, in this diverse group of pregnant women, Asians had a lower BMI compared with other ethnic minorities. Infants were more likely to be LBW or SGA when maternal BMI was <20 kg/m2.


