In a recent article in this Journal Nicolas Duquette (Reference Duquette2014) detected, for the first time, a “strong and robust association between crowded voyages and slave mortality.” He arrived at this result by using econometric methods to incorporate into the analysis voyages for which loss rates on the middle passage were observed, but information on the duration of the voyage was missing in the Transatlantic Slave Trade Database (TSTD). This article does not take issue with Duquette's methods. Instead it argues that the crowding variable, crucial to his and others’ research on the determinants of middle passage loss rates, is deeply flawed. Its denominator, ship tonnage, has been grossly mismeasured over part of the period when changes in crowding were most likely to have influenced slave mortality. This article argues that both the unstandardized and standardized tonnage variables in the TSTD are traps for the unwary. Recalculation of Duquette's estimation using corrected ship tonnages reveals a more limited relationship between crowding and slave mortality, a relationship observed only in the British slave trade before the late 1780s.
Correctly quantifying the relationship between crowding and mortality is important not only for understanding the scale of a great crime against humanity, but for understanding the underlying business practices and shipping technologies that were used. Previously, the inability of scholars to find a conditional correlation between crowding and mortality was taken as evidence that the slave trade was for the most part expected-profit-maximizing; ship captains packed their vessels to the point where they expected the risks of further crowding to offset the value of potentially greater cargo, and thereafter any differences in observed mortality were driven mostly by infectious disease or bad weather hitting unlucky voyages more than others—a factor not observable while loading on the African coast. Duquette (Reference Duquette2014) summarizes this literature.
Contradicting this model, a new literature on the slave system casts doubt on slave captains as efficient, rational, well-informed actors. John Dalton and Tin Leung (Reference Dalton and Cheuk Leung2015, Reference Dalton and Cheuk Leung2016), for example, find large dispersions in the productivity of slavers within and across national carriers, and that captains themselves explain a great deal of the productivity differences across voyages. Furthermore, Dalton and Leung (Reference Dalton and Cheuk Leung2016) document that more than 60 percent of slave captains sailed just one voyage. Therefore, it is likely that, even if captains’ incentives were well-aligned with the voyage's owners, there could be suboptimal crowding of ships due to the captains’ inexperience and misjudgement of the profit-maximizing packing—profit-maximization will only drive the observed relationship between crowding and mortality to zero if these mostly inexperienced captains were informed enough to make good decisions. Alternatively, ship captains might have been uninformed about the profit-maximizing crowding level, not because of their own inexperience, but because of imperfect information about the health of their human cargo. Ann Carlos (Reference Carlos1992) argues, for example, that the African factors of the Royal African Company stand out among British joint-stock companies’ foreign agents for their incompetence, because the company's short-term contracts on the unhealthy West African coast limited opportunities to filter on ability ex ante.
This article, however, suggests that the lack of an association between crowding and mortality is not due to profit-maximizing behavior nor to data observation problems, but to the way ship tonnage was measured. Problems with tonnage measurement concern almost all ships voyaging before the mid-1780s. The basic, but not the only problem, is well known through the work of Christopher French (Reference French1973) and John McCusker (Reference McCusker1967, Reference McCusker1981), and arises because the way in which British and American shipowners declared the tonnage of their ships before the British Ship Registration Act of 1786 and similar legislation by the United States in 1789. The British act established comprehensive registration of British ships and made it compulsory to calculate tonnage by a formula initially laid down in 1695 and revised in 1773. Before the 1786 Act, many shipowners seem to have ignored this formula and systematically understated tonnages, probably to reduce their liabilities for port charges and other taxes. In 1792 William Irving, a prominent customs official, declared that the tonnage of North American vessels had been consistently understated by a third (McCusker Reference McCusker1967, p. 82). Modern work (French Reference French1973) has argued that understatement was less consistent than Irving suggested and might vary according to the size of the ship and the port in which it was registered. British ship tonnages before and after the late 1780s are thus not strictly comparable, which led the editors of the TSTD to adjust most of the earlier tonnages in order to create a standardized tonnage variable denominated in post-1786 tons, which are commonly referred to as “measured tons” (Eltis Reference Eltis2010).Footnote 1 Here it will be shown that these adjustments are inconsistent and often inappropriate.
Before going into the details it is important to point out that in the eighteenth century there was no perfect formula for calculating a ship's cargo-carrying capacity. Official formulae were calculations of volume and only very approximate. The British formula, for example, was based only on the ship's length and breadth, with the depth being approximated by half the breadth. Of course, the weight of cargo that a ship could carry depended not only on the space available, but also on the specific gravity of the cargo and on how tightly it was packed and loaded into the ship. In the particular case of slave ships what mattered was not so much volume as deck area, which Charles Garland and Herbert Klein (Reference Garland and Klein1985) show to be related to measured tonnage in a nonlinear way. Contemporaries knew that measures were only approximations. Advertisements of ships for sale in the late 1770s generally state tonnages with the qualifiers “more or less” or “thereabouts” (Public Ledger 1775–1779). In pre-1786 sources tonnages are usually quoted to the nearest number ending in zero and there is significant heaping at numbers ending in 00 and 50. Contemporaries were also aware that cargo capacity could differ from measured tonnage. For example, in 1777 the Adventure was described as “about 160 tons measurement, but will carry 240” (Public Ledger 12 December 1777).
The issue is thus not the absolute accuracy with which ship capacity was measured, but the consistency of capacity measures across time and space. There is already considerable measurement error in eighteenth-century tonnages. It will be argued here that the adjustments made in the TSTD introduced more error, some of it systematic. In trying to correct for the understatement of some pre-1786 tonnages, the editors have overstated: (1) the size of most slave ships in this period; (2) the size of French, Portuguese, and Dutch ships relative to British and American ships; and (3) the size of smaller ships relative to larger ones.
These conclusions follow for the most part from the demonstration that Lloyd's Register, a contemporary firm that regularly surveyed ships as a service to insurers, did measure tonnages consistently from the 1760s onward. Most late eighteenth-century British slave ships in the TSTD can be found in Lloyd's Registers. Of the 1,383 distinct ships departing Britain between 1776 and 1807 a Register tonnage can be attached to 91 percent of them. Since most of the ships not identified made only one voyage, those with Register tonnages accounted for 96 percent of all voyages. Before 1776 it is more difficult to attach Register tonnages to slave ships. The 1776 volume remains useful for earlier years, but before that only the 1764 and 1768 volumes survive, and both have gaps. Nonetheless, of the 1,280 ships departing between 1760 and 1775 a Register tonnage can be attached to 38 percent and these ships accounted for 51 percent of all voyages. Hence the coverage from the mid-1770s is quite complete; those in the 1760s and early 1770s somewhat less so.
Other problems with the TSTD's standardized tonnages arise from inappropriate and inconsistent application of the British adjustments to French and Portuguese ships and from some errors in data entry and manipulation concerning British and Dutch ships. The extent of the various problems is not trivial. The TSTD contains 16,655 observations for its standardized tonnage variable, of which 10,501 are for the period up to 1786. These early standardized tonnages are the result of 9,012 adjustments, almost all of which are flawed in one way or another. In the case of Duquette's work inappropriate adjustments affect 65–73 percent of the observations in his samples.
The errors in the TSTD standardized tonnage variable have implications for research on the effects of crowding on slave mortality. In the case of Duquette's work the use of corrected, but still imperfect, tonnages turns out, strangely, to weaken his results. A closer look shows that the use of corrected tonnages still implies a strong link between crowding and mortality in the British slave trade, but not for French or other nations’ slave voyages. This confirms recent research by Peter Solar and Klas Rönnback (Reference Solar and Rönnbäck2015) on the British slave trade, in which the substitution of tonnages from Lloyd's Registers for the TSTD tonnages produced a clear connection between crowding and loss rates. But here it is shown that this relationship held only for the period before the passage in 1788 of Dolben's Act, a measure designed to reduce crowding on British slave ships.
THE BRITISH PROBLEM
The tonnages in the TSTD come from a variety of sources, including ship registers in British ports, lists of ships arriving at Caribbean ports, newspaper advertisements, Admiralty Court proceedings, and Lloyd's Registers. Sometimes the tonnage of the same ship varied from voyage to voyage. The ship could have been lengthened or rebuilt in the interim, but some of these variations probably resulted from changes in the source of the tonnage figures. In the database five to ten sources are often cited collectively for a single voyage, so it is generally not possible to isolate the source from which any given tonnage is taken.
The editors of the TSTD, drawing on the work of French (Reference French1973), adjusted upward almost all pre-1786 tonnages, from whatever source, according to the size of the ship. This was done for three size classes (1–150 tons; 151–250 tons; >250 tons) in the manner shown in Figure 1. Small ships were adjusted upward by about 80 percent; medium size ships by about 50 percent; and large ships by about 13 percent. It is apparent in Figure 1 that these adjustments are discontinuous, which leads to changes in the ordering of ships by size. The major problem arises for ships in the range from 200 to 300 tons. For example, the standardized tonnage of a ship whose unstandardized tonnage is 200 tons turns out to be larger than that of a ship whose unstandardized tonnage is 260 tons and the standardized tonnage of a ship of 250 tons is larger than that of one whose initial tonnage is 300 tons. Similar, but smaller, inversions occur around 150 tons. The standardized tonnage of a ship whose unstandardized tonnage is 150 tons is larger than that of ships with unstandardized tonnages up to 170 tons. These discontinuities introduced unnecessary errors and spurious variability into the standardized tonnages in the TSTD. The impact of these discontinuities was magnified by fairly severe heaping of unstandardized tonnages at numbers ending in 50 and 00 (Solar Reference Solar2016).
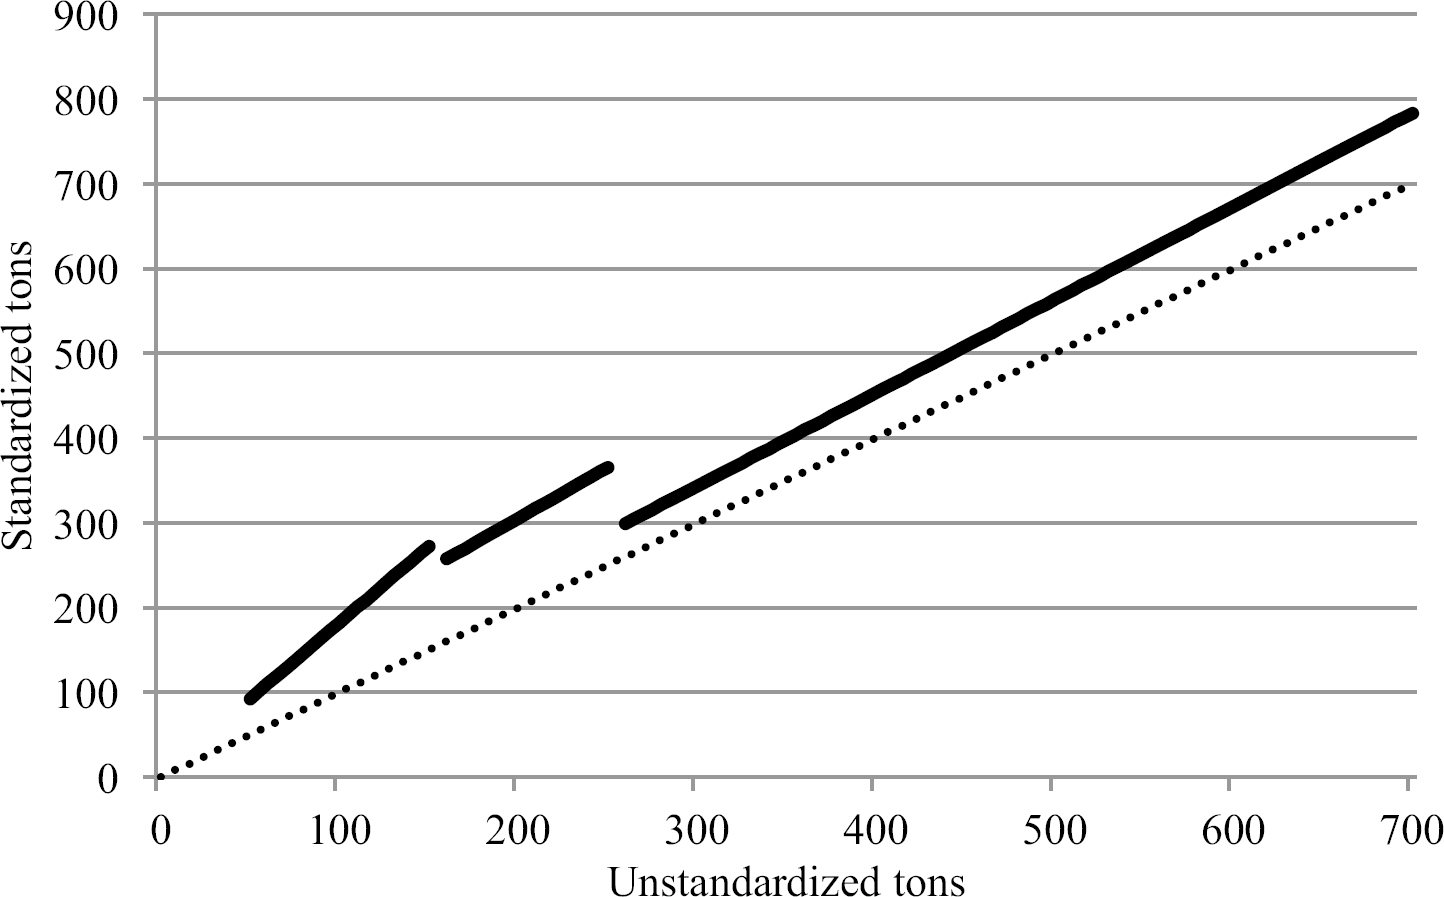
Figure 1 TONNAGE ADJUSTMENTS IN THE TSTD
The editors also adjusted tonnages that should not have been adjusted, notably those drawn from Lloyd's Register.Footnote 2 In order to see this, it is necessary, first, to show that the tonnages reported in the Registers were consistent both across the 1773 and 1786 acts and with the official tonnages from the late 1780s onward. This will establish the Registers as an alternative source for pre-1786 tonnages such that they are directly comparable with the post-1786 tonnages. Figure 2 shows the kernel densities for three comparisons: (1) the tonnages of all ships (mostly non-slavers) in the 1791 Register whose names began with the letters A and B and whose recorded date of construction was 1780 or earlier with the tonnages of the same ships in the 1781 Register; (2) the tonnages of all ships (again mostly non-slavers) in the 1776 Register whose names began with P and whose recorded date of construction was before 1769 with the tonnages of the same ships in the 1768 Register; and (3) the tonnages of slave ships that made voyages in the years 1782, 1783, or 1784 with the same ships that made voyages in 1788 or 1789.Footnote 3 All three kernel densities, in which the variable is the ratio of tonnage in the later year to that in the earlier year, show a strong peak at one, indicating that the tonnages of many of the ships were the same in both years. The distributions have tails both below and above one and show no evidence of any general upward or downward adjustments of tonnages corresponding to either the 1773 Act or the 1786 Act. The distributions show that there were indeed some large upward changes in tonnage between 1768 and 1773 and between 1781 and 1791, but many of these upward changes can be seen from annotations in the Registers to have resulted from structural changes in the ships concerned. For 9 of the 15 upward revisions of 25 percent or more between 1781 and 1791 the vessels had been either lengthened or rebuilt in the interim. The same is true of the largest upward changes in the tonnages of the slave ships.
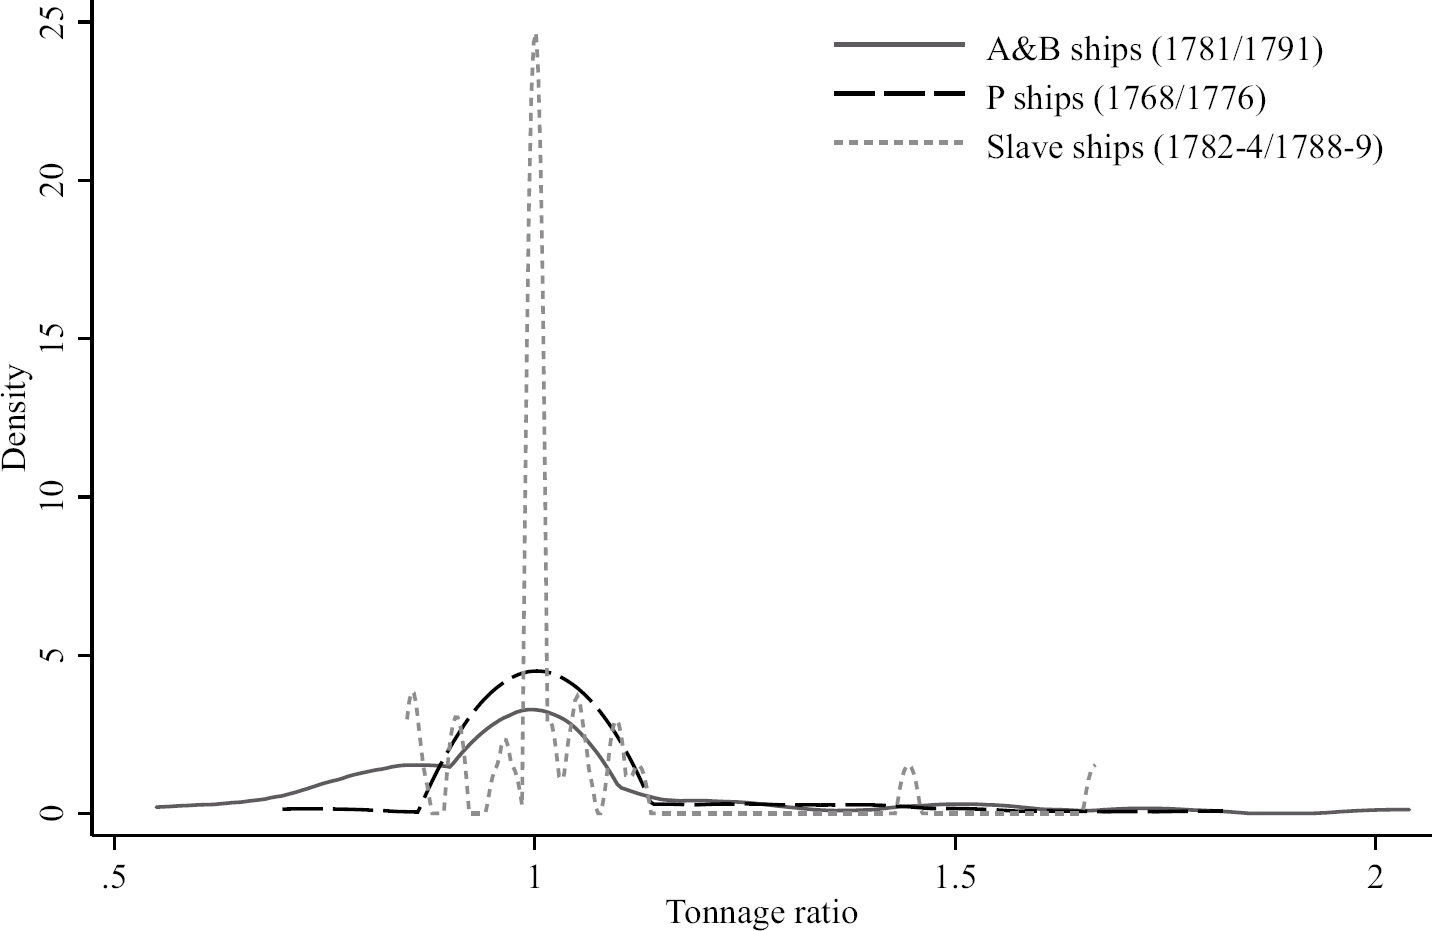
Figure 2 KERNEL DENSITIES OF SHIP TONNAGE COMPARISONS ACROSS SOURCES
There seem to be no sources that show how the Register's surveyors measured ships and calculated their tonnages. The supposition must be that they used methods comprehensible to contemporaries, most likely something like the formula specified in the 1773 Act. Ship measurement in three other contexts may provide some guidance. First, the British government consistently employed the 1773 Act formula when hiring transports in wartime. Government inspectors surveyed candidates and calculated their tonnages, on the basis of which their owners were subsequently paid (Syrett Reference Syrett1970, Reference Syrett2008; Condon Reference Condon1972). Second, shipowners applying to the High Court of Admiralty for licenses to privateer had to declare tonnages. The declared tonnages of 576 privateers granted letters of marque between 1776 and 1782 were just 5 percent lower than their tonnages as shown in Lloyd's Registers. The median difference was zero.Footnote 4 Third, the tonnages of ships put up for sale or hire were quoted in newspaper advertisements. The 16 Bristol slave ships advertised between 1770 and 1785 averaged 212 tons (Richardson Reference Richardson1996) as compared with 200 tons in Lloyd's Registers (and only 144 unstandardized tons in the TSTD). Similar results hold for 156 non-slave ships advertised in the Public Register from 1775 to 1778.
A more direct test of the hypothesis that the Register's surveyors used tonnage measured by a consistent formula is to compare the tonnages in the Registers with those in post-1786 official shipping registers. Robert Craig and Rupert Jarvis (Reference Craig and Jarvis1967) have published an edition of the early Liverpool registers. Of the 96 ships registered there in 1788, 75 can be matched to entries in the 1789 and 1790 volumes of Lloyd's Register. Tonnages in the two sources are identical in 16 cases, with another 11 cases involving differences of no more than 5 percent. The differences range from the Mary, for which the Lloyd's tonnage is 31 percent lower, to the Jane, for which the Lloyd's tonnage was 67 percent higher. On average the tonnages in the Registers were about 10 percent larger than those in the Liverpool registers. In principle, the Liverpool port officials should have been using the official formula from the 1786 Act, but applying that formula to ship dimensions in the Liverpool registers yields tonnages that are on average almost 8 percent larger than the tonnages reported, and hence close to those in Lloyd's Registers. In the years following 1790, the tonnages in Lloyd's Registers and those in the Liverpool registers are increasingly aligned. By 1793, 37 of 50 tonnages were identical. Most of the remaining differences involved larger values in Lloyd's than in the Liverpool registers, suggesting that the Register's Liverpool surveyor did not take the official tonnages as writ. That said, this comparison of the two sources indicates that the methods used by Lloyd's surveyors produced figures that were quite consistent with official tonnages as recorded after 1786.
Now that it has been established that from the 1760s Lloyd's Registers measured tonnages consistently and in a manner similar to that used to arrive at official tonnages after 1786, the way in which the editors of the TSTD adjusted pre-1786 tonnages can be assessed by comparison to the Register tonnages. For the period from 1760 to 1786 it was possible to match observations in these two sources for 1,848 voyages made by 790 ships. For a ship making several voyages the tonnages were usually the same across all its voyages, probably because they came from the same source. But for some ships tonnages in one or the other source differed across voyages. When the TSTD voyages have been cleaned of what are effectively duplicate observations for the same ship, there remain 1,002 observations on the 790 ships. The majority of the variant observations for the same ship were due to tonnages varying from one voyage to another within the TSTD, probably because they were drawn from different sources.
The first result of this analysis is that the editors of TSTD relied very little on tonnages from Lloyd's Registers. For only 552 of the 1,002 observations were the Registers listed as a source, and for only 196 of these was the unstandardized tonnage equal to that in the Registers. For ships where the Registers were not listed as a source, it is possible that some of the secondary sources cited may have drawn on them, but in only 81 of the 446 cases was the unstandardized tonnage the same as that in the Registers. The editors clearly took no more than 30 percent of unstandardized tonnages from the Registers. Unfortunately, in more than 90 percent of the cases in which unstandardized and Register tonnages were the same these tonnages were then adjusted upward, which, on the argument here, should not have been done.
Lloyd's Register and unstandardized TSTD tonnages are compared in Table 1. The distribution of the ratio of Register to unstandardized tonnage is clearly bimodal, with peaks at 1 and somewhere between 1.2 and 1.29, though there is a long tail at higher values. Tonnages from the two sources are identical for more than a quarter of the observations and identical or within 10 percent of being identical for more than a third of the observations. The sources listed in the TSTD make it likely that many of these identical or near-identical observations were drawn from Lloyd's Registers.
Table 1 REGISTER VS TSTD TONNAGES 1760–1786
Sources: TSTD; Lloyd's Registers.
The majority of the unstandardized tonnages in the TSTD are different from those in the Registers. Strangely, some are considerably larger than Register tonnages, though it is not clear why shipowners would have declared such high tonnages. Even so, three-quarters of these tonnages were adjusted further upward by the editors of the TSTD. But most unstandardized tonnages in the TSTD were, as would be expected, less than the Register tonnages and 95 percent of these were adjusted upward. The small number which were not adjusted came mainly from the mid-1780s and were 10–20 percent lower than the Register tonnages.
Comparisons to the Register tonnages indicate that the size of the ship was not systematically related to its understatement. As noted earlier, the editors of the TSTD made different adjustments for three class sizes: up to 150 tons; 151–250 tons; and 251 tons or more. If only observations for which the Register tonnage is at least a quarter larger than the unstandardized tonnage are taken into consideration, that is, the ones that probably should have been adjusted, then the Register tonnages are greater than the unstandardized tonnages for these three class sizes by averages of 57, 43, and 48 percent. The editors of the TSTD would thus seem to have overadjusted the tonnages for smaller vessels and underadjusted them for larger ones.
The similarity of these differences across tonnage classes suggests, at first sight, that in cases in which upward adjustment is appropriate, it would have been more straightforward and less inducive of error to have applied a constant adjustment factor to ships of all sizes. For ships of which the Register tonnage was a quarter or more larger, the average margin was 54 percent. This figure is not much more than the 50 percent adjustment suggested by William Irving in 1792 and the 46 percent that McCusker (Reference McCusker1967) found many years ago from his sample of five ships.
But while a constant adjustment factor is probably better than the sort of adjustments made in the TSTD, the large variance in the ratios of Register to unstandardized tonnages shown in Table 1 indicates that this may still be only a very approximate solution. There seem to be no clear determinants of these ratios. They do not seem to vary in a systematic way across ship size, place of construction, place of registration, year of voyage, or data source.
One further error concerns more than 200 British ships making voyages between 1676 and 1731. For these ships tonnages have been adjusted downward in the TSTD, but the discussion in David Eltis and David Richardson (Reference Eltis and Richardson1995, pp. 481–82) indicates that the adjustment being made is from measured to registered tonnage. Since standardization was to measured tonnage, either the columns should be reversed or no adjustment should have been made to the original figures.
ADJUSTMENTS TO NON-BRITISH TONNAGES
The adjustments made by the TSTD editors to British tonnages before 1786 were also applied to French and Portuguese ships, but in a rather inconsistent fashion. For French ships upward adjustments were made to almost all ships up through 1773, then to only a few ships between 1774 and 1783. For Portuguese ships upward adjustments were made to ships sailing between 1686 and 1773, but not to ships sailing before 1686 or between 1774 and 1783. No justification drawing on legislation or practice in these countries was given for these variations in adjustment.
The main reference given by the editors concerning the equivalence of capacity measurements was Frederic Lane (Reference Lane1964, p. 229), who, drawing on eighteenth-century evidence, offered the following rough conversions:
If Lane was referring to the British registered ton before 1786, then this would argue for upward revisions of all French and Portuguese figures, not just in selected periods. Moreover, since there is no evidence that the French or Portuguese changed their methods of ship measurement at the same time as the British did, this would suggest that tonnages from these countries should also be adjusted upward after 1786.
But it seems more likely that these conversions should be interpreted to refer to the British measured ton, in which case none of the French and Portuguese tonnages should have been adjusted upward. Decadal averages of the unstandardized tonnages for several countries are shown in Table 2. There do seem to have been persistent differences in the size of slave ships across countries. The Americans consistently employed small vessels and the Portuguese, particularly early on, seem to have used larger vessels. The figures also seem to suggest that until the third quarter of the eighteenth century the British used much smaller ships that did the French, Dutch, and Portuguese. But by the 1790s and 1800s the British were using ships of a size comparable to those used by the slave traders of the other nations.
Table 2 MEAN UNSTANDARDIZED TSTD TONNAGES 1750–1819
Note: ∗ from 1784 until 1792 the French government subsidized the slave trade based on tonnage, which led shipowners to overstate tonnages (Eltis Reference Eltis2010). The mean value for 1780–1783 was 182 tons.
Source: TSTD.
Was this convergence a real phenomenon? Evidence from Lloyd's Registers shows that there was indeed some increase in the average size of British slavers in the 1780s (Figure 3). But this change could only have accounted for about half of the increase shown in Table 3. An obvious explanation of the rest is obligatory adoption of the measured ton by British shipowners. If so, then this would indicate that none of the French and Portuguese figures should have been adjusted upward in the period before 1786.
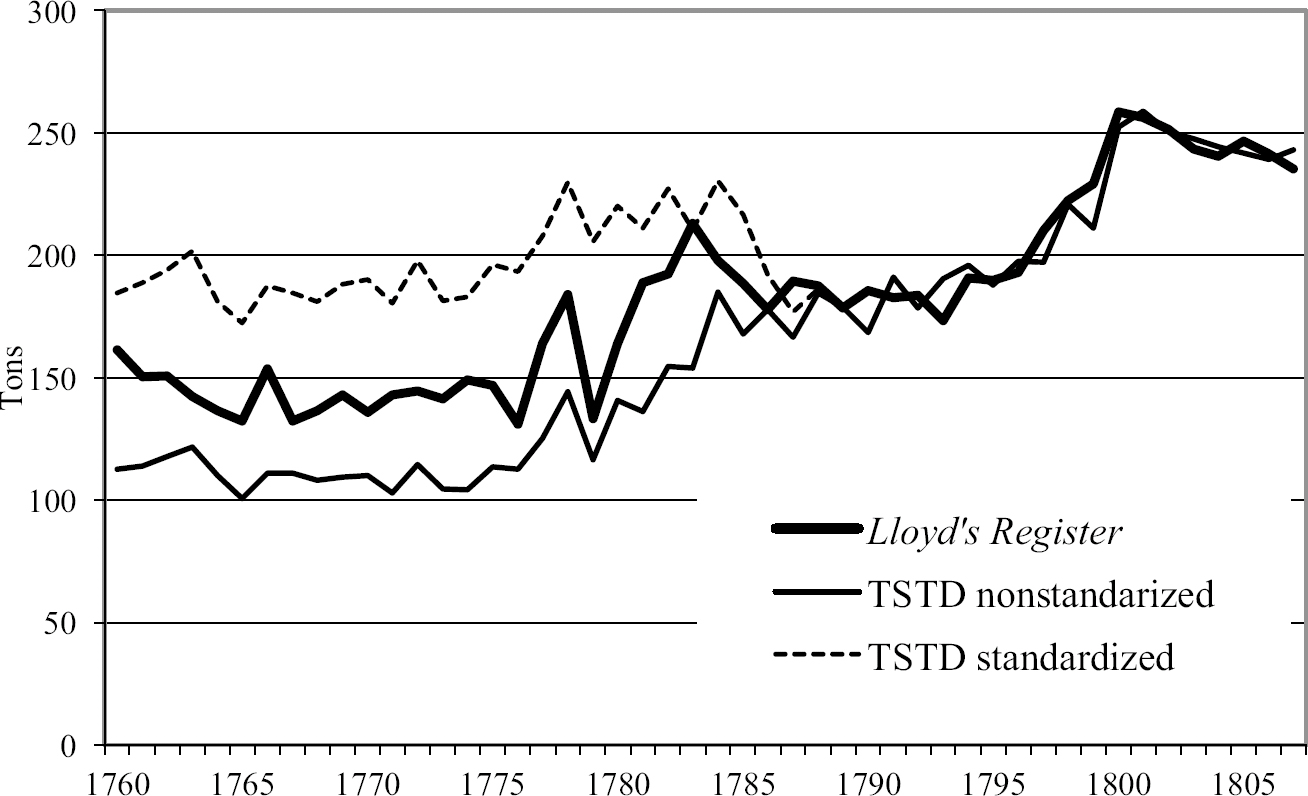
Figure 3 AVERAGE TONNAGES OF BRITISH SLAVE SHIPS 1760–1807
Table 3 CORRELATION COEFFICIENT BETWEEN REVISED VARIABLES AND MEASUREMENT ERRORS
∗ = Significant at the 0.1 percent level.
Notes: Labeled cells report pairwise correlation coefficients between labeled column and row variables; p-values for test of statistical difference from zero are reported below in parentheses. “Tonnage error” and “Crowding error” are computed as the values from TSTD adjusted tonnages, less values from the corrected values described in this article.
Sources: TSTD, Lloyd's Registers.
The unstandardized tonnages also argue against the editors' choice of 1774 as a break in the practice of capacity measurement in France and Portugal. The average tonnage of French slave ships in 1770–1773 was 180 tons; in 1774–1779 it was 183 tons. In the Portuguese case the average tonnage over the same periods increased from 212 to 253, but the latter figure was still lower than the average tonnage in the 1760s.
Finally, there is a clear error in the construction of the standardized tonnage variable for almost all of the 400 or so Dutch ships. The TSTD relied predominantly on information collected by Johannes Postma (Reference Postma2008) and reported by him in lasts, the Dutch unit of capacity. The last, as noted previously, was roughly equivalent to two English tons and the figures reported as unstandardized tonnages in the TSTD have been converted accordingly. Unfortunately, the editors doubled these tonnages again to arrive at standardized tonnages, which means that the size of Dutch slave ships was systematically overstated. Dutch ships would thus rarely appear to be crowded.
IMPLICATIONS OF INAPPROPRIATE ADJUSTMENTS
Figure 3, drawing on the evidence from Lloyd's Registers, offers a corrected view of how the average tonnage of British slave ships changed from 1760 to 1807. Over the period as a whole, the average British slaver became a good deal larger, from something under 150 tons in the early 1760s to about 250 tons on the eve of abolition. This increase, of somewhat more than two-thirds, is larger than the 50 percent suggested by D. P. Lamb (Reference Lamb, Anstey and Hair1976, p. 99). The average unstandardized and standardized tonnages from the TSTD are also shown in Figure 3. From the late 1780s the TSTD series are very similar to the series based on Lloyd's Registers, a broader confirmation that the Registers were recording something similar to official tonnages after 1786. Before the late 1780s there are marked differences. The unstandardized tonnages are well below those in the Registers, much as one would expect since many of these were tonnages that had been understated. The TSTD standardized tonnages are well above the Register tonnages in the 1760s and 1770s, again as expected given the problematic adjustments in the TSTD. Both the unstandardized and standardized tonnages converge to the Register tonnages from the early 1780s since during this period the editors of the TSTD often drew values for ship tonnages from sources dated after the 1786 Act.
This figure suggests, again broadly, why researchers may have found it difficult to detect a relationship between crowding and slave mortality on British ships when the crowding variable was based on the standardized tonnages in the TSTD. These tonnages overstate ship size and hence understate crowding in the period up to the mid-1780s. In 1788 Parliament passed Dolben's Act, which set limits on the number of slaves per ton that British ships could carry. Use of the standardized tonnages will thus tend to understate any reduction in crowding that resulted from this act and hence any effect that the Act may have had on slave mortality.
We explore the implications further by presenting revised estimates of Duquette's (Reference Duquette2014) regressions using corrected ship tonnages (and hence crowding). The presence of inaccurate tonnages in Duquette's sample could have affected his estimates in three ways, with ambiguous overall implications for his analysis. First, because most of the TSTD tonnages are understated, calculated crowding (which is inversely related to tonnage) would have been mostly overstated. Second, the adjustments introduce measurement error in independent variables. We would expect both the scaling error and attenuation to bias Duquette's estimated coefficient on crowding toward zero. Third, if the errors in the TSTD's adjustments were correlated with other variables of interest, then in a multivariate regression the overall effect of the error is ambiguous—the estimated coefficient on crowding might capture not crowding itself, but other influences on mortality correlated with the measurement error.
Correlation coefficients in the data confirm that this third factor is a matter of concern. Table 3 reports pairwise correlation coefficients for the (revised) tonnage and crowding, voyage duration (where observed), and the measurement errors in the tonnage and crowding variables. The correlations between tonnage, crowding, and mortality are statistically significant, but not large. The signs of the errors suggest that mismeasurement of tonnages should have overstated the relationship between tonnage and mortality, while understating the relationship between crowding and mortality. More intriguingly, the correlations between errors in tonnage and crowding measurement and (observed) Middle Passage duration are large and statistically significant. Duration is positively associated with error in tonnage, and negatively with the error in crowding. This finding suggests all coefficients measured in Duquette's study may be estimated with errors driven by multivariate correlations with the erroneous tonnage adjustments.
Reestimation of Duquette's regression using corrected tonnages indicates that adjustment errors caused his estimated crowding effect to be overstated. Duquette estimated a regression of the form
where Mortality is the percentage death rate of embarked slaves, Crowding is the ratio of embarked slaves to corrected shipping tons, Tonnage is the corrected volumetric capacity of the ship, and Duration is the number of days on the Middle Passage between the last port in West Africa and the first port in the Americas. Additionally, the specification adds fixed effects by trade route (ψ route ( i )) and by decade (ϕ decade ( i )) to isolate correlations of the variables of interest with mortality from unobserved influences of captains' route-based expectations and from changes in shipping practices and technology over time.
Table 4 reports multivariate regression results for equation (1). Columns (1), (2), and (3) report Duquette's earlier estimates for the reader's convenience; columns (4), (5), and (6) report equivalent results, respectively, using the corrected tonnages. Columns (1) and (4) estimate a simple linear regression for 763 observations with voyage duration observed. The main focus of Duquette's article was the argument that the sample of perfectly observed voyages was imperfectly representative of the slave trade as a whole, and he used different missing data methods to expand the sample. Following the same methodology, columns (2) and (5) extend the sample to voyages missing observed Middle Passage duration using multiple random imputation; columns (3) and (6) add an interaction between Crowding and Duration to capture nonlinear and perhaps increasingly severe mortality effects of crowding on unexpectedly long voyages.
Table 4 MULTIVARIATE REGRESSION OF SLAVES' MIDDLE PASSAGE MORTALITY RATE ON VOYAGE CHARACTERISTICS
∗∗∗ p<0.01
∗∗ p<0.05
∗ p<0.1
Notes: Standard errors in parentheses corrected for an arbitrary covariance structure by ship. In columns 2, 3, 5, and 6, estimates and errors are corrected for imputation bias using multiple random imputation (50 iterations). The R-squared presented in columns 2, 3, 5, and 6 is for an ordinary regression using the 50th imputation of Duration.
Sources: TSTD, Lloyd's Registers.
Though most of the regression coefficients are qualitatively unchanged, the estimated relationship between crowding and mortality is much closer to zero and statistically insignificant using the corrected sample. In all three specifications, the point estimate on the relationship between crowding and mortality is reduced by about one-third in absolute value. As in Duquette's article, the estimated coefficient for voyages with observed Middle Passage duration is small, negative, and statistically insignificant, but even so column (4) reports a value closer to zero—that is, even without creating imputed values to expand the data set, the associations between corrected crowding and mortality imply a smaller relationship in absolute magnitude. When the sample is expanded to include otherwise complete voyage records without duration (including most British voyages), the point estimates, while positive, are smaller and no longer statistically different from zero. Surprisingly, then, more accurate tonnage measurement makes the effect of crowding on Middle Passage mortality disappear in the full sample.
Because the errors in the TSTD's tonnage measurement are highly national, we investigate further by flag of the carrier. In Table 5 we subdivide the sample into three groups: French voyages (N=772), British voyages (N=1,016), and those of all other countries (N=377). Because of the reduced number of observations, fixed effects for time-period unobserved factors are implemented in 25-year instead of 10-year indicator variables. Otherwise, odd-numbered columns (1) through (5) report identical regressions to Table 3, column (5) and even-numbered columns (2) through (6) equivalent to Table 3, column (6).
Table 5 MULTIVARIATE REGRESSION OF SLAVES' MIDDLE PASSAGE MORTALITY RATE ON VOYAGE CHARACTERISTICS
∗∗∗ p<0.01
∗∗ p<0.05
∗ p<0.1
Notes: Standard errors in parentheses corrected for an arbitrary covariance structure by ship. In columns 6 and 7, estimates and errors are corrected for imputation bias using multiple random imputation (50 iterations). All columns use imputed duration and present R-squared for an ordinary regression using the 50th imputation of Duration.
Sources: TSTD, Lloyd's Registers.
The point estimate on crowding is economically and statistically significant only for British slave ships, where a one standard deviation increase in the revised crowding variable (0.75) is associated with an increase of 4.9 to 6.2 percentage points in slave mortality. French voyages report a point estimate about half the size of the British association, and one not statistically different from zero. The duration of the Middle Passage, on the other hand, is statistically and economically significant only for French voyages. The French data is the best and most consistent source of voyage durations in the TSTD and has fewer imputed values than the British data, so it has the lowest noise-to-signal ratio for this contributor to mortality.
That the effect of crowding on mortality is found primarily for the British voyages is striking, particularly since British voyages are the focus of our revised tonnage estimates. We now extend the analysis further to two questions related to the timing and conduct of the British trade: Did the regulatory restrictions imposed by Dolben's Act (1788) reduce slave mortality? And how did the introduction of copper-sheathed ships change slave mortality? Our understanding of both questions is improved by the use of corrected tonnages.
Dolben's Act placed restrictions on how tightly packed slaves could be on the Middle Passage. However, because the measurement and recording of ship tonnages changed at around the same time as the Act (from the adjusted and overstated tonnages in the TSTD to more or less correct values), attempts to measure the effect of Dolben's Act will be confounded by the simultaneous change in crowding measurement error. We can look for an effect of the Act by splitting the British sample into the period before and after 1788. As shown in Table 6 the post-Dolben sample has no statistically significant relationship between crowding and mortality, while prior to Dolben, British voyages present a strong, statistically significant effect of crowding. It appears that Dolben's Act did successfully rein in the worst excesses of British slavers.
Table 6 REGRESSION OF BRITISH SLAVE MORTALITY ON CROWDING WITH COPPER SHEATHING
∗∗∗ p<0.01
∗∗ p<0.05
∗ p<0.1
Notes: See Table 4.
Sources: TSTD, Lloyd's Registers, Solar and Rönnbäck (Reference Solar and Rönnbäck2015).
The British ships are the focus of Solar and Rönnbäck's (Reference Solar and Rönnbäck2015) study of copper sheathing. They find that coppered slave ships made the Middle Passage more quickly and with lower mortality than uncoppered ships. This fact invites a study of the mortality effects of a particular technological innovation added to the stock of ships over time instead of controlling for unobserved technology using fixed effects ϕ period ( i ). We repeat the specification of equation (1) for British voyages while adding a new variable to measure coppered vessels.
where Copper is equal to 1 if the vessel was copper-sheathed at the time of voyage i and equal to 0 if it was not. For a small number of observations where sheathing status was unknown, Copper is also set equal to zero. Other variables are as previously described. Other technologies are captured with 25-year effects ϕ period ( i ), and time-invariant properties of trading routes captured with route effects ψ route ( i ).
Table 6 reports the results of this estimation. Consistent with Solar and Rönnbäck's findings, coppered British voyages exhibit lower mortality than uncoppered, a difference of about 3 percentage points (although lower than Solar and Rönnbäck's 5 to 7 percent). However, the point estimate of crowding's relation to slave mortality on British ships is little changed.
This may be surprising, since coppering appears to have been an important variable omitted from the previous regressions, and one likely to be correlated with crowding. However, this correlation has two offsetting effects: because coppered ships had shorter crossings, captains were likely to pack coppered vessels more tightly, all else equal.Footnote 5 Coppering therefore both increased crowding and reduced travel time, with ambiguous effects on the mortality associations of either.
As a final check, we may wonder whether the rise of coppered vessels and the passage of Dolben's Act are picking up the same effect, since both came in the latter period of the British slave trade. The addition of a Dolben indicator variable and an interaction variable reduces the precision of the estimates while leaving the sign and order of magnitude unchanged; absent new evidence, there is no reason to conclude that the effects of the Dolben Act or copper sheathing on slave mortality are confounding one another.
CONCLUSIONS
The Transatlantic Slave Trade Database is a magnificent achievement of collective scholarship and a rich resource for historians of slavery. This makes it all the more painful to point out such severe problems with just two of the many variables in the database. That said, researchers doing quantitative work on the slave trade would be well advised to avoid the current standardized tonnages. Even the unstandardized tonnages may be misleading. They certainly are when comparisons involving British and American ships span the 1786 Ship Registration Act, and may even be so for the pre-1786 period since the tonnages in the TSTD were drawn from a variety of not necessarily comparable sources.
From the early 1760s Lloyd's Registers are a more reliable source of tonnages for British ships. For earlier British and American voyages tonnages drawn from certain sources, such as newspaper advertisements, can be used without adjustment. But those from other sources, such as the plantation registers or the naval shipping lists, should be adjusted upward. A constant adjustment of about 50 percent would seem the most appropriate.
The results of this exercise also have broader implications for the history of the British shipping industry in the late eighteenth century. The consistency of the tonnages from Lloyd's Registers with the measured tonnages after the 1786 Ship Registration Act suggest that Lloyd's Registers should be the preferred source of data on ship capacity from the 1760s onward.
Beyond the issue of shipping tonnage itself, this analysis demonstrates the importance of continually improving the accuracy, breadth, and coverage of historical data for accurate quantitative history. The simplest explanation for the lack of an association found in the literature between crowding and mortality is neither expected profit maximization by ship captains, nor the patterns of data observation suggested by Duquette, but simple nonclassical measurement error in the standardization of ship tonnages. It is hoped this article builds upon the extensive and excellent work invested in the TSTD, and illuminates the value of continuing to question and improve upon this remarkable resource. Though it is clear that slave mortality was affected not simply by crowding but also by national carrier, crowding regulation, and shipping technology, the economic and business considerations underpinning these patterns merit further study.
Appendix Table 1 REGRESSION OF SLAVES EMBARKED ON TONNAGE AND OTHER FACTORS
Appendix Table 2 VARIABLE DEFINITIONS