


The high prevalence of type 2 diabetes mellitus (T2DM) in ethnic subgroups is an important public health challenge in Norway(Reference Jenum, Holme and Graff-Iversen1). Immigrants from South Asian countries have a higher risk of developing overweight, obesity and T2DM compared with other populations, including ethnic Norwegians(Reference Abate and Chandalia2–Reference Hjellset, Bjørge and Eriksen7), and the women have higher risk than the men(Reference Jenum, Holme and Graff-Iversen1, Reference Kumar, Meyer and Wandel8). Pakistanis constitute the largest non-Western ethnic majority group in Oslo, the capital of Norway(Reference Kumar, Grøtvedt and Meyer6, Reference Blom and Henriksen9).
In addition to early-life conditions and genetics, part of the increased risk may be explained by Westernization of lifestyle, i.e. changes in diet and physical activity(Reference Misra, Misra and Wijesuriya10). Reported changes in diet after migration to Western countries are increased intakes of meat, oil, fruits, sugar, diary products, fish and boiled potatoes, and reduced intakes of traditional foods such as vegetables and legumes(Reference Lawrence, Devlin and Macaskill11–Reference Wandel, Raberg and Kumar14), corresponding to increased intake of products low in fibre and high in animal fats(Reference Misra, Misra and Wijesuriya10, Reference Mellin-Olsen and Wandel13–Reference Wandel15). Such dietary changes are associated with an increased risk of T2DM(Reference Hu, van Dam and Liu16–Reference Meyer, Kushi and Jacobs19).
Traditionally, nutrition information has been given with the ethnic Norwegian population in mind. Norwegian health personnel are experiencing challenges when offering nutrition advice to immigrants(Reference Mellin-Olsen and Wandel13, Reference Fagerli, Lien and Wandel20). A low level of education, poor command of the Norwegian language and low levels of literacy, which are common among Pakistani-Norwegian women, complicate the immigrants’ achievement of health information and access to health-care services(Reference Blom and Henriksen9). Consequently, culturally adapted health interventions may be especially effective in preventing T2DM in ethnic subgroups(Reference Jenum, Holme and Graff-Iversen1, Reference Fagerli, Lien and Wandel20). There has been a shift in preventive health care from information and influence to empowerment, dialogue and participation. An important part of recent health promotion ideology is the emphasis on process as much as results(Reference Mæland21, Reference Green and Tones22). This health promotion ideology reflects characteristics in the relationship between the provider and recipient, and might entail cooperating without assuming responsibility for the other person's performance and accepting without judging the other's feelings and choices(Reference Fisher, La Greca and Greco23). This health promotion approach may be preferred when wanting lifestyle changes to last for a longer time than the intervention period.
Previous research has found maintenance of changes in dietary behaviour several months and years after group-based interventions(24–Reference Logan, Woodside and Young27). However, other interventions have shown limited long-term effects(Reference Kumanyika, Van and Bowen28). More research is needed to find intervention components that enhance the degree of maintenance of dietary changes(Reference Kumanyika, Van and Bowen28).
The intervention study
The present paper is based on data from a culturally adapted, randomized controlled intervention study with the aim to prevent T2DM and metabolic syndrome among Pakistani immigrant women by influencing diet and physical activity. The intervention lasted for 7 months and the outcome was then assessed (follow-up 1). A subsequent follow-up was done 24–36 months after baseline (follow-up 2). A previous paper from the study(Reference Johansen, Bjorge and Telle29) has reported shifts in the intentions to change type and amount of fat, sugar and vegetable intake from baseline to follow-up 1 to coincide with significant reductions in the intakes of sugar-rich drinks and red meats, and an increase in the intake of fruit and vegetables. Between baseline and follow-up 1 there were significant reductions in fasting blood glucose (0·16 mmol/l), glucose concentration 2 h after an oral glucose tolerance test (0·53 mmol/l) and BMI (0·28 kg/m2) in the intervention group(Reference Hjellset, Råberg Kjøllesdal and Bjørge30). The changes were significantly different between the control and intervention group for fasting blood glucose (P = 0·022) and insulin (P = 0·036). There was a significant increase in participants having the metabolic syndrome in the control group (P = 0·011), but not in the intervention group. Larger changes were seen for those in the intervention group attending 60 % or more of the intervention sessions.
Aim of the present paper
Data from the baseline, follow-up 1 and follow-up 2 (after 2–3 years) data collections are used in the present paper. The aim was to investigate whether the shifts in intention to change food behaviour and the changes in diet that were found at follow-up 1, were maintained at follow-up 2.
Methods
Design
The intervention study was carried out in Oslo in the suburban area (Søndre Nordstrand) having the highest proportion of Pakistani immigrants (12 %). Data collection was carried out in 2006–2009 at three time points: (i) baseline; (ii) right after the 7 ± 1 month intervention (follow-up 1); and (iii) 2–3 years after baseline (follow-up 2). Data were collected through interviews carried out by native language speakers (Punjabi, Urdu) using a questionnaire with food frequency questions (FFQ) and questions on intentions to change diet. Sociodemographic data were collected and weight and height were measured by trained personnel.
Recruitment
A multi-recruitment strategy has been recommended for South Asians, which includes: defining the demographic and social profile of the population; consulting representative community members to provide assistance in the data collection; and setting inclusion and exclusion criteria as wide as possible(Reference Hussain-Gambles, Leese and Atkin31). Participants were recruited by this strategy, visiting the local health station, mosques and social gatherings in the local community. Interested women were contacted by telephone and given a verbal invitation to participate, as many Pakistani women have a low level of literacy.
The inclusion criteria were women, 25–65 years of age, living in Norway and born in Pakistan or born in Norway by two Pakistani parents. Of the 245 invited women, forty-seven were excluded according to the following criteria: T2DM, CVD, close relative included in the project, pregnancy, lack of interest (n 9) or other reasons (n 11).
Participants
A total of 198 women were included and randomized to the control (n 97) or intervention (n 101) group using a computerized block randomization list, set up by a statistician. A central telephone randomization system was used. The research assistant called the randomization telephone at an independent research unit to allocate each participant to the control or intervention group. The research unit stored information on ID numbers, and this information was obtained and communicated to the participants after finishing the baseline measurements.
A total of 157 women (79·3 %) came to the follow-up 1 assessment; seventy-six from the control group and eighty-one from the intervention group. At the follow-up 2 assessment, a total of 121 women (61·1 %) came, fifty-seven and sixty-four from the control and intervention group, respectively.
Characteristics of the participants
The characteristics of the participants at baseline are presented in Table 1. Mean age was close to 40 years in both groups. Prevalence of overweight or obesity (BMI ≥ 25·0 kg/m2) was 87·3 % and 76·2 % in the control and intervention group, respectively. A total of 66·1 % in the control group and 57·8 % in the intervention group scored above the Asian specific cut-off (BMI ≥ 27·5 kg/m2) for high health risk(32). Significant difference between the groups at baseline was only seen for years lived in Norway; on average 2·9 more years in the intervention group compared with the control group.
Table 1 Baseline characteristics of participants in the control and intervention groups; Pakistani women aged 25–60 years, Oslo, Norway, 2006–2009
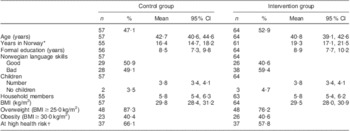
*Significant difference between the control and intervention group for years in Norway (P = 0·044) at baseline.
†BMI ≥ 27·5 kg/m2. The WHO Expert Consultation Group has recommended the use of Asian-specific cut-off points for BMI in order to identify those at increased risk of chronic diseases(32).
The intervention
The intervention group was successively assigned into subgroups of ten to twelve women. The intervention included six group sessions lasting for 2 h each. The intervention approach was focused on empowerment, dialogue and participation, which implied efforts to make the participants confident of being able to reach the goal they wanted. The focus was directed to how each woman could see the possibility of favourable lifestyle changes in her life, together with her family. The basis for the teaching was prevention of T2DM through glucose control with emphasis on diet and physical activity. The intention was to make the women able to incorporate the knowledge acquired for changing practice. The teaching was based on knowledge about Pakistani lifestyle in Norway and Pakistan. Culturally adapted materials were used and discussions were encouraged. All information was translated to the women's mother tongue.
The participants were encouraged to reduce intakes of sugar, starch and other refined carbohydrates, change to more complex carbohydrates, eat more vegetables, beans and lentils in line with their traditional diet and eat more fatty fish. Fruits were recommended in small amounts. Carbohydrates were the main focus of the group sessions. In addition, the participants were encouraged to change type of fat from butter/margarine/vegetable oil to rapeseed or olive oil, and asked to measure the amount of fat used in cooking. The participants were told to avoid the use of cheap oils marketed as ‘vegetable oil’, which is commonly used by the Pakistani immigrants(Reference Mellin-Olsen and Wandel13). This oil consists of a mixture of oils, including a substantial amount of palm oil, which is known to be atherogenic.
The control group did not take part in the group sessions, but for ethical reasons they were offered one group session after the follow-up 1 assessment (i.e. before the follow-up 2 assessment).
Questions on intention to change dietary behaviour
Intention to change intake of vegetables, sugar and amount and type of fat was assessed by questions related to the stages of change construct from the Transtheoretical Model(Reference Prochaska, Redding and Evers33). According to the theories behind the Transtheoretical Model, change involves progress through a series of five stages characterized by the extent to which an individual intends to change behaviour(Reference Kerr, Weitkunat and Moretti34–Reference Verheijden, Bakx and Delemarre38). The questions on intention to change behaviour had five response categories: (i) ‘I have not changed my behaviour the last 6 months, and I am not planning to for the next 6 months’ (pre-contemplation); (ii) ‘I have not changed my behaviour the last 6 months, but I am considering doing so within the next 6 months’ (contemplation); (iii) ‘At the moment I am trying to change my behaviour, but not on a regular basis’ (preparation); (iv) ‘During the last 6 months I have changed my behaviour’ (action); and (v) ‘I changed my behaviour ≥6 months ago’ (maintenance)(Reference Prochaska, Redding and Evers33).
The FFQ
The FFQ was based on experiences from previous studies conducted in Norway(Reference Kumar, Meyer and Wandel8, Reference Mellin-Olsen and Wandel13, Reference Lorentzen, Ommundsen and Jenum39) and the Diabetes in Europe–Prevention using Lifestyle, Physical Activity and Nutritional (DE-PLAN) Intervention Project, an international diabetes study conducted by the European Union(Reference Schwarz, Lindstrom and Kissimova-Scarbeck40). The dietary questions from the Norwegian study were validated for ethnic Norwegians(Reference Mosdøl41) and modified after pilot studies within the Pakistani population, as described by Wandel et al.(Reference Wandel, Raberg and Kumar14).
The women were asked to report from their usual diet in recent months. The ‘Picture pamphlet with portion sizes’, developed by the Norwegian Food Safety Authority, the Norwegian Directorate of Health and the Department of Nutrition at the University of Oslo, was used to improve the reporting of amounts regarding oil used in curries and intake of drinks. Selected pictures from ‘Matmalen’, developed by the Swedish National Food Administration, were also used.
Variables
When investigating intention to change food behaviour, the five response categories were re-coded in two ways. They were first aggregated into two categories, (i) pre-action (pre-contemplation, contemplation, preparation) and (ii) action (action, maintenance), for analysing the change in distribution between pre-action and action stages. Second, the response categories were aggregated into three categories, (i) pre-action (pre-contemplation, contemplation, preparation), (ii) action (action) and (iii) maintenance (maintenance), for analysing the change in distribution from action to maintenance stage.
Changes in actual intake of the following food items and beverages were investigated: soft drinks and fruit drinks with sugar; red meats; fish; sweet foods (pastries, ice cream, pudding, chocolate, etc.); and vegetables. The variables on intake were re-coded for the statistical analyses. Intake of beverages was assessed in glasses/d, and multiplied by the size of the glass into dl/week. Intakes of red meats, fish and sweet foods were assessed and analysed in portions/week. Intake of vegetables was assessed in portions/d, and converted into g/d by multiplying portions with portion sizes.
Statistical analyses
Data were analysed using the SPSS statistical software package versions 16·0 and 18·0 (SPSS Inc., Chicago, IL, USA). Only data from participants who showed up for all three data collections were included for the main analyses. All outliers were kept, and a significance level of P ≤ 0·05 was chosen.
Pearson's χ 2 test was carried out for investigating the distribution of intention to change food behaviour in the groups and for investigating if there were differences between the groups in distribution. McNemar's test for difference in correlated proportions of matched-pair samples was carried out for investigating if there were changes in intention to change within the groups between the time points.
Crude means for actual food and beverage intakes were estimated using the ‘Explore’ function in SPSS. Univariate analyses of covariance via the ‘GLM’ (general linear model) procedure were carried out for investigating if there were differences between the groups at baseline, follow-up 1 and follow-up 2 assessments. Adjustments for baseline intake were carried out in these analyses, and adjusted means for intake were estimated via analysis of covariance. The paired t test was carried out for investigating if there were changes in mean intake within the groups between the time points.
Ethics
The participants gave signed consent and the study was conducted in full accordance with the ethical principles as per the World Medical Association Declaration of Helsinki. The Norwegian Data Inspectorate approved the study and it was cleared by the Regional Committee for Medical Research Ethics.
Results
Intention to change dietary behaviour
The shift from pre-action to action/maintenance stages from baseline to follow-up 1 that was observed in the intervention group, was maintained at follow-up 2 compared with baseline for intention to reduce fat (P < 0·001) and change type of fat (P < 0·001). For intention to reduce sugar intake and increase vegetable intake, the pattern was similar but the difference from baseline was not significant. The difference between the control and intervention group in distribution between the pre-action and action/maintenance stages at follow-up 2 was significant only for intention to reduce fat (P = 0·048). No significant shift from pre-action to action/maintenance stages from follow-up 1 to follow-up 2 was seen in the groups.
Figure 1 shows the movements between the action and maintenance stages at the three assessments. Whereas a high percentage in the intervention group moved into the action stage from baseline to follow-up 1, the most notable shift from follow-up 1 to follow-up 2 was from action to maintenance stage. This was significant for intention to reduce fat (P < 0·001), change type of fat (P = 0·001), increase vegetable intake (P < 0·001) and reduce sugar (P = 0·003). In the control group such a shift was seen only for intention to reduce fat (P = 0·021).
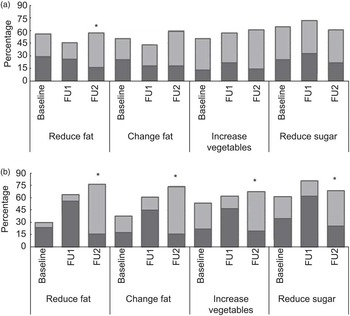
Fig. 1 Distribution between action ( $$$$) and maintenance stages (
 $$$$) at baseline, follow-up 1 (FU1) and follow-up 2 (FU2) for intention to reduce fat intake, change type of fat, increase vegetable intake and reduce sugar intake; Pakistani women aged 25–60 years, Oslo, Norway, 2006–2009. (a) Control group (n 57); (b) intervention group (n 64). Significant change from action to maintenance stage within the control group or intervention group from follow-up 1 to follow-up 2, using McNemar's test for difference in correlated proportions of matched-pair samples: *P < 0·001
Maintenance of changes in actual diet
Intake of soft drinks with sugar was significantly reduced by 2·6 dl/week (P < 0·001) and fruit drinks with sugar by 2·1 dl/week from baseline to follow-up 1 (P = 0·002) in the intervention group (Fig. 2). The reductions were maintained at follow-up 2 (P = 0·001 and P = 0·004, respectively) compared with baseline. In the control group, small and insignificant changes in intake of sugar-rich drinks were seen from baseline to follow-up 1 and from follow-up 1 to follow-up 2. Significant differences between the control and intervention group were observed at baseline for mean intake of fruit drinks with sugar (P = 0·020), at follow-up 1 for mean intake of soft drinks with sugar adjusted for baseline value (P = 0·028) and at follow-up 2 for mean intake of fruit drinks with sugar (P = 0·023; Table 2).
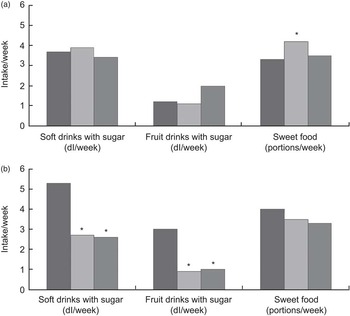
Fig. 2 Mean intakes of food items and beverages rich in sugar within (a) the control group (n 57) and (b) the intervention group (n 64) at baseline ( $$$$), follow-up 1 (
 $$$$) and follow-up 2 (
 $$$$); Pakistani women aged 25–60 years, Oslo, Norway, 2006–2009. Significant change in intake from baseline to follow-up 1 or from baseline to follow-up 2 within the control group or intervention group, using the paired t test: *P < 0·05
Table 2 Crude and adjusted mean intakes of food items and beverages in the control group (n 57) and intervention group (n 64) at baseline, follow-up 1 and follow-up 2, and differences between the groups; Pakistani women aged 25–60 years, Oslo, Norway, 2006–2009
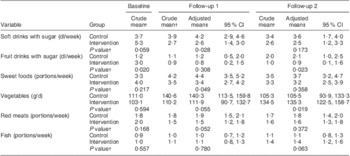
†Crude mean obtained using the ‘Explore’ function in the SPSS statistical software package versions 16·0 and 18·0 (SPSS Inc.).
‡Adjusted means and P values for difference between the control and intervention group obtained by univariate analyses of covariance via the ‘GLM’ (general linear model) procedure in SPSS.
There was a small and insignificant reduction in portions of sweet foods in the intervention group from baseline to follow-up 1 and 2 (Fig. 2). The participants in the control group significantly increased their intake of sweet foods by 0·9 portions/week from baseline to follow-up 1 (P = 0·032), but a small and insignificant decrease in intake was seen from follow-up 1 to follow-up 2. The intake of sweet foods was significantly higher in the control group compared with the intervention group at follow-up 1 (P = 0·049), but no significant difference was seen between the groups at follow-up 2.
Intake of vegetables increased in both control and intervention groups from baseline to follow-up 1, but significantly only in the control group (P = 0·027; Fig. 3). However, from follow-up 1 to follow-up 2 intake of vegetables decreased significantly by 35·3 g/d in the control group (P = 0·010). In the intervention group, the vegetable intake was further increased by 24·3 g/d from follow-up 1 to follow-up 2 (P = 0·048), leading to a significantly higher intake at follow-up 2 compared with baseline (P = 0·014). Intake of vegetables was significantly higher in the intervention group (134·5 g/d) than the control group (105·3 g/d) at follow-up 2 (P = 0·019; Table 2).
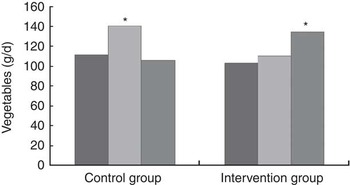
Fig. 3 Mean intake of vegetables in the control group (n 57) and intervention group (n 64) at baseline ( $$$$), follow-up 1 (
 $$$$) and follow-up 2 (
 $$$$); Pakistani women aged 25–60 years, Oslo, Norway, 2006–2009. Significant change in intake from baseline to follow-up 1 or from baseline to follow-up 2 within the control group or intervention group, using the paired t test: *P < 0·05
The significant reduction in intake of red meats by 0·5 portions/week from baseline to follow-up 1 in the intervention group (P < 0·001) was maintained at follow-up 2, leading to a significant reduction in intake at follow-up 2 compared with baseline (P = 0·007; Fig. 4). No significant change in meat intake was observed in the control group. At follow-up 1, intake of red meats was on the border of being significantly higher in the control group compared with the intervention group (P = 0·052), while no significant difference was observed at follow-up 2 (Table 2).
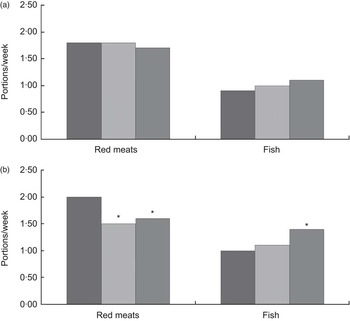
Fig. 4 Mean intakes of red meats and fish in (a) the control group (n 57) and (b) the intervention group (n 64) at baseline ( $$$$), follow-up 1 (
 $$$$) and follow-up 2 (
 $$$$); Pakistani women aged 25–60 years, Oslo, Norway, 2006–2009. Significant change in intake from baseline to follow-up 1 or from baseline to follow-up 2 within the control group or intervention group, using the paired t test: *P < 0·05
A small and insignificant increase in fish intake was observed from baseline to follow-up 1 in both groups (Fig. 4). From follow-up 1 to follow-up 2 a further increase was seen in the intervention group (P = 0·015), and the fish intake was increased significantly by 0·4 portions/week at follow-up 2 compared with baseline in the intervention group (P = 0·002). No change was seen in the control group.
Discussion
The present paper reports on the first culturally adapted intervention study aimed to reduce the risk of T2DM among Pakistani immigrants in Norway. Pakistani immigrant women are considered difficult to reach with health information(Reference Hussain-Gambles, Atkin and Leese42) and are therefore often excluded from health trials, resulting in a lack of research regarding this group.
Intention to change food behaviour
Changing diet involves change of long-established food behaviour, representing a complex process where people's intention to change is believed to be important(Reference Glanz, Patterson and Kristal43, Reference Kristal, Hedderson and Patterson44). Assessing intentions to change diet is challenging, as nutritional knowledge affects self-reported intentions and one may move irregularly from one stage to another and back(Reference Curry, Kristal and Bowen45, Reference Povey, Conner and Sparks46). The validity of self-reported stages of change also depends on awareness of actual dietary intake(Reference Curry, Kristal and Bowen45). The present study showed that the women in the intervention group progressed from the action to the maintenance stage from follow-up 1 to follow-up 2 for intention to reduce fat and sugar, change fat and increase vegetables, which might be a result of actual adaption of dietary behaviour after the intervention or increased knowledge. This is in accordance with the theory behind the empowerment approach(Reference Ursin and Eriksen47), with the emphasis on making the participants capable of reaching their goals. In the control group, the shifts were smaller and patterns were irregular. The significant shift in intention to reduce fat in the control group may be a result of the repeated exposure to questions about fat intake, or to dietary advice given in the group session after follow-up 1. Furthermore, reducing fat is probably the advice most commonly heard through other channels of nutrition information and intentions to do so may have been reinforced by the repeated exposure to the issue.
Maintenance of changes in dietary behaviour
The women's shift from action to maintenance stage corresponds to the maintenance of registered dietary changes. Maintenance of reduction in intake of soft drinks and fruit drinks with sugar was seen in the intervention group at follow-up 2, and the same tendency, although not significant, was found for sweet foods. Thus, changes were maintained after a prolonged time period for behaviours that are reported difficult to change and in a population group that is considered difficult to reach. In an earlier study, Pakistani women in Oslo mentioned that there is a social pressure to serve and eat sweet foods and drinks as this is connected to hospitality, and that such habits may be difficult to change(Reference Mellin-Olsen and Wandel13).
A small and insignificant increase in vegetable intake was seen in the intervention group from baseline to follow-up 1, with a further and significant increase from follow-up 1 to follow-up 2. The participants in the control group showed more irregular changes from baseline to follow-up 2. The mean intake at follow-up 2 (105·3 g/d in the control group and 134·5 g/d in the intervention group) was however substantially lower than the Norwegian recommendations for intake of vegetables (450 g/d)(48). Intake of vegetable curries may be reduced in Norway, as intake of one hot meal daily instead of two or three is common, but also because meat curries may be preferred(Reference Mellin-Olsen and Wandel13). Reduced intake of traditional vegetables and vegetable curries after immigration to Norway has been described and may be explained by higher cost, lower quality and lower availability of fresh vegetables in Norway(Reference Mellin-Olsen and Wandel13).
The reduction in intake of red meats was maintained at follow-up 2 in the intervention group while fish intake was further increased from follow-up 1 to 2. Such changes are in line with the recommendations by the Norwegian Directorate of Health(48). The intervention did not focus on intake of red meats, but the women were encouraged to eat more fish and vegetables. However, one has to bear in mind that increased intakes of fish and vegetables may lead to reduced intakes of other foods, such as red meats.
Previous research has shown that qualitative changes in diet, i.e. changes in food item choices, are more likely to be maintained compared with energy restrictions(Reference Kumanyika, Van and Bowen28). Maintenance of changes in diet has been seen for months and years after group-based interventions aimed at changing dietary behaviour(24–Reference Logan, Woodside and Young27). However, previous research has not focused on maintenance of changes in diet in an immigrant Pakistani population after culturally adapted interventions.
Limitations of the study
The recruitment strategy may have resulted in a sample with an above-average interest in health, leading to less pronounced differences between the groups. However, our sample is comparable to Pakistani women participating in a large population-based study carried out in Oslo regarding prevalence of overweight, education and years in Norway(Reference Kumar, Meyer and Wandel8).
Carry-forward analyses are commonly used in intervention studies with a long follow-up time and high drop-out rate. However, such analyses should be used with caution and with consideration as to the aim of the study. As the aim of the present study was to investigate if the changes at follow-up 1 were maintained at follow-up 2, carry forward was not the most suitable analysis, since it implies using some of the data from follow-up 1 in the analyses at follow-up 2. However, we also did carry-forward analyses on the sample. The results were similar to those presented here. This indicates that the changes observed are not due to special characteristics of those attending all the data collections.
Using FFQ for assessing food intake has some challenges. Self-reported intake easily leads to recall bias. It should be kept in mind that under-reporting of sugar intake is common, especially in women with BMI ≥ 30·0 kg/m2 and in people eating healthily to avoid overweight(Reference Rasmussen, Matthiessen and Biltoft-Jensen49). The process of answering the questions in the FFQ may raise awareness about healthy eating and influence the answers. Furthermore, misconceptions between the interviewer and the interviewee cannot be ruled out. However, the women in the control group were exposed to the questionnaires in the same way and at as many times as the women in the intervention group. Thus, the learning process when answering the questions in the questionnaire should be equal in the two groups. Furthermore, the person who did the teaching in the group sessions was not present when collecting the data from the follow-up 2 study, thus minimizing the possibility of a stronger pleasing bias for the intervention group.
Conclusions and implications for further research
The results from the present study suggest that a culturally adapted intervention with focus on empowerment among Pakistani immigrant women has the potential of changing the participants’ intention to change food behaviour months and years after completion of the intervention. A high proportion in the intervention group had moved from action to maintenance stage for intention to change dietary habits. Furthermore, healthful changes in diet, as reduced intakes of soft drinks with sugar, fruit drinks with sugar and red meats, and increased intakes of vegetables and fish, were maintained in the intervention group. Thus, empowerment-focused culturally adapted interventions have the potential of leading to long-term maintenance of beneficial changes in diet.
Acknowledgements
The work was supported by the Norwegian Research Council, the Jahre Foundation and the Throne Holst Foundation. The authors declare no conflicts of interest. M.W. and G.H.-O. planned and supervised the project. B.B. and V.T.H. conducted the intervention and coordinated the data collection. K.M.H.-K. did the statistical analyses and the drafting of the article. All authors contributed in the final stage of the writing. The authors are grateful to the many people who contributed in different stages of the project. They especially want to thank Monica Morris, Aisha Ashgar Ali, Anica Munir, Eva Kristiansen, Marianne Lunde and all of the participating women who gave their time and shared their knowledge and experience.


