


I. INTRODUCTION
Radar sensors have become more and more common in everyday life over the years. Although radars were originally designed to monitor military and civil air traffic, their application area is now much wider and more versatile. For example, radar sensors can be found installed in cars to assist in increasing driver safety, but also in bathrooms to control water valves. While radar sensors are fairly well-developed at present, this technology is still rapidly developing, and engineers are constantly searching for the most cost-effective solutions required by the mass market. The wide availability of radio-frequency and digital components in the market makes it possible for amateur radio enthusiasts and/or students to construct simple, low-cost radars. Further, as the drone market has been growing quickly, of late there is an urgent need to equip the drones with small, light radars used as both safety and anti-collision sensors, as well as imaging ones providing ground imaging in dark, foggy or cloudy environments.
The idea of constructing a small radar for drone applications has thus attracted the attention of the authors. This paper presents the design of an frequency modulated continuous wave (FMCW) analog-front-end (AFE) for radar imaging applications. The AFE is an electronic device typically placed between the digital part of the radar and its antennas. In modern radars the transmitted signal is synthesized digitally and converted to an analogue signal by a digital to analogue converter (DAC). Usually, DACs produce either baseband or intermediate frequency (IF) signals, which are first up-converted in frequency, amplified by an AFE, and then transmitted by a T x antenna. The signal received by the R x antenna (or a set of antennas) is amplified by low noise amplifiers, down converted (in the AFE) and then converted again to a digital form using the analogue to digital converters (ADCs). The digital signal is processed in field-programmable gate arrays (FPGAs) and computers to obtain final results in the form of plots, tracks or radar images. At present, the digital components are highly flexible, so it is easy to build radar exciters (radar signal generators) and radar signal processors using commercial off-the-shelf (COTS) components. However, the construction of an AFE is still a challenge as it should be very sensitive and as noiseless as possible on the one hand, but it is highly dependent on the applications on the other hand [Reference Bowick, Blyler and Ajluni1].
In this paper, the authors present a simple project of a wideband AFE for an FMCW radar working at the central frequency of 5.5 GHz with a maximum instantaneous bandwidth of 0.5 GHz, capable of providing detection and high resolution imaging capability (image resolution 15 × 30 cm2). In section 2 the concept and description of the AFE hardware is presented. In section 3 the concept of the FMCW radar system with the designed AFE hardware is presented. In section 4 the test results are shown, starting with the laboratory test and ending with the airborne tests and synthetic aperture radar (SAR) imaging.
II. HARDWARE DESCRIPTION
The goal of the presented work was to design a small, flexible radar with an AFE for an FMCW wideband radar. For this purpose, the central frequency of 5.5 GHz was selected with an instantaneous bandwidth of up to 0.5 GHz. The design was based on COTS. The digital part of the radar was based on software radio modules and a micro PC computer.
The whole idea of the radar signal synthesis and radar signal acquisition and processing can be described in a few steps:
-
1. The radar sounding signal is synthesized at a low IF frequency by the direct digital synthesis [Reference Omran, Sharaf and Ibrahim2] module, which was built using software defined radio (SDR) architecture applied in universal software radio peripheral (USRP) (www.ettus.com). A USRP device baseband frequency of 460 MHz was selected with an instantaneous bandwidth from 10 to 40 MHz.
-
2. The IF signals are passed via a frequency multiplier network to obtain the central frequency of 5.5 GHz. In the project the frequency multiplier of 12 × was used.
-
3. The sounding signal is amplified and transmitted by the T x antenna.
-
4. The signal received by the R x antenna is amplified using a low noise amplifier and mixed with the transmitted signal to obtain a 0 IF frequency beat signal.
-
5. The beat signal is amplified, filtered, and converted to a digital form using the ADC. The USRP device is used as an acquisition system.
The principle of FMCW AFE operations is presented in Fig. 1.
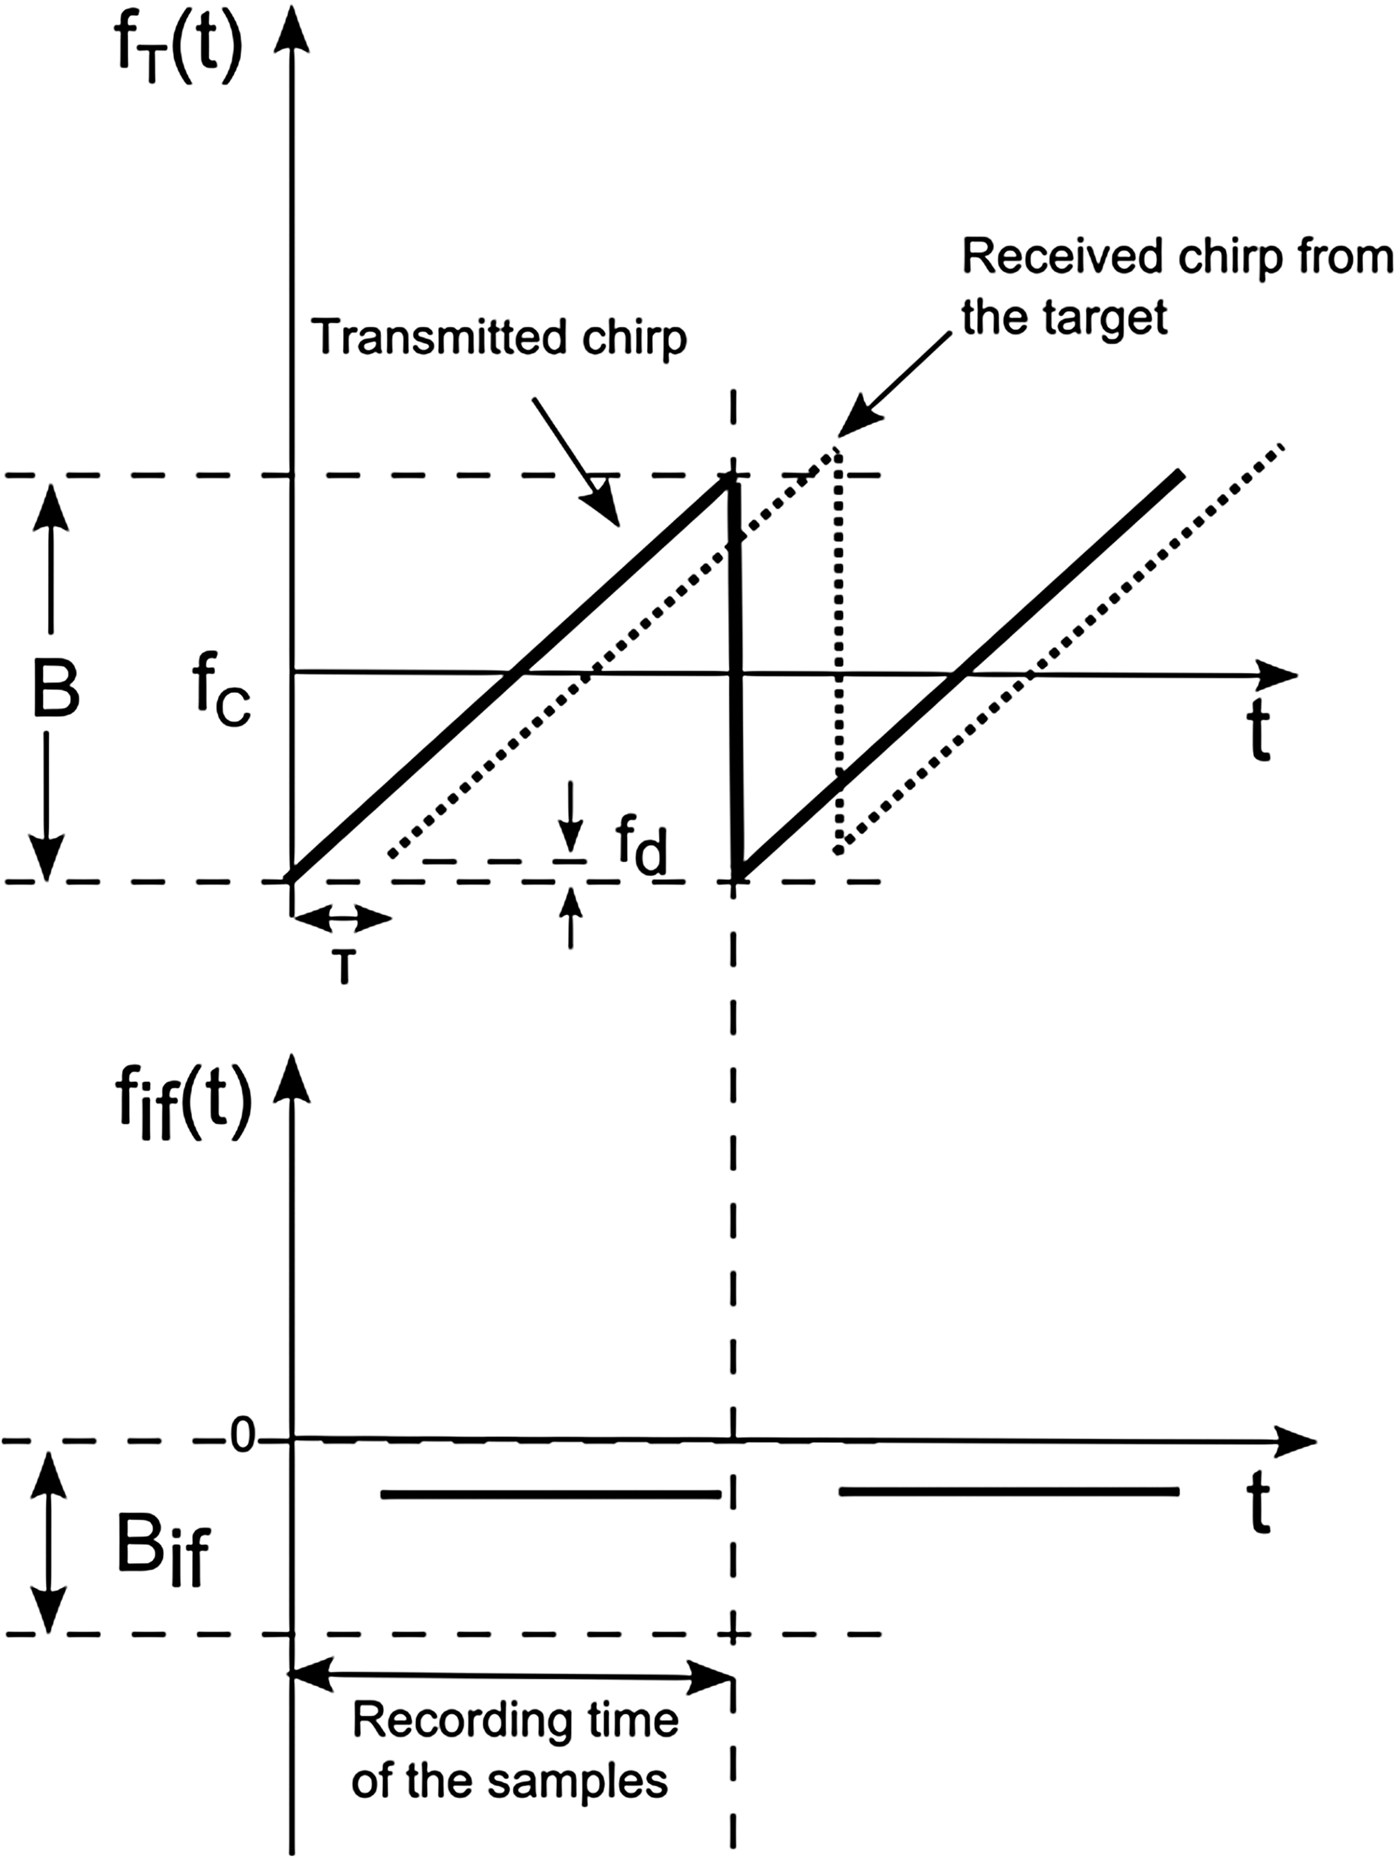
Fig. 1. AFE operation.
The transmitted signal is a Linear FMCW signal. The fundamentals of the FMCW radar can be found in [Reference Komarov and Smolskiy3]. The saw-tooth signal as presented in Fig. 1 can be described by equation (1):
 $${s_t} = {A_t}(t){e^{j\phi \left( t \right)}}. $$
The phase for the FMCW radar is a square shaped function, which can be described for the time of one period 0 < t < T chirp as follows (equation (2)):
 $$\phi (t) = \displaystyle{B \over {2{T_{chirp}}}}{t^2} + \left( {{f_c} - \displaystyle{B \over 2}} \right)t + {\phi _0}.$$
The received signal is an attenuated copy of the transmitted signal shifted in time and in Doppler frequency (equation (3)):
 $${s_r} = {A_r}(t - \tau ){e^{j\phi \left( {t - \tau} \right)}}*{e^{j2\pi {f_d}t}}.$$
After mixing both the transmitted and received chirp signals in the AFE, the 0 IF signal is obtained. The output of the mixer has many frequency components, with the most interesting being produced at low frequencies. The output of the mixer is filtered out with a low-pass filter and amplified. One of the products at low frequencies is a beat signal with a frequency representing target distance (for a stationary object) and target radial velocity with respect to the radar (for a moving object). The beat signal, which is the output of the AFE, can be described as follows (equation (4)):
 $${s_{if}} = {A_{if}}(t){e^{j2\pi {f_{if}}t}}.$$
The beat signal frequency is the sum of two frequency factors: one corresponding with target range, the other with target velocity as described by equation (5):
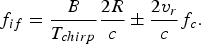 $${f_{if}} = \displaystyle{B \over {{T_{chirp}}}}\displaystyle{{2R} \over c} \pm \displaystyle{{2{v_r}} \over c}{f_c}.$$
The AFE system was designed and constructed by the authors solely using hardware available at the laboratory, which was only one of the constraints that had to be taken into account.
The input signal for the AFE was generated by the USRP device at the carrier frequency 460 MHz with a maximum bandwidth of 40 MHz and a maximum power of 0 dBm. The maximum power of the beat signal for the receiving USRP was 10 dBm, and the resolution of 16 bits gave a lower power boundary of the beat signal at the −86 dBm level. Because of this, the gain in the receiver part was set at the level of 40 dB. The transmit power in C-band was designed to be 0 dBm with the possibility of it being increased up to 20 dBm with an external amplifier.
Moreover, the authors took into account the common difficulties in FMCW radars such as coupling, leakage, and filtering unwanted components of the signal, while trying to maximize the performance of the FMCW radars [Reference Brooker4] as well as placing particular importance on the transmitted bandwidth and the dynamic range.
A frequency multiplier with a multiplication factor of 12 was used to achieve the desired C-band (carrier frequency of 5.52 GHz) of operation, with a maximum bandwidth of the transmitted signal up to 480 MHz in order to have a range resolution of 0.3 m [Reference Parrish5]. The frequency multiplier provides a minimum of 30 dB of attenuation of other harmonics in comparison with the desired 12 harmonic. An additional bandpass filter was placed after the frequency multiplier to filter the desired bandwith of operation. This way the requirements for the sampling frequency could be lowered, but at the same time, some drawbacks such as harmonics generation and/or an increase in phase noise [Reference Jones6] might be noticed. To suppress the generated harmonics a bandpass filter was used, while the generated phase noise was partially compensated by the frequency mixer [Reference Jones6].
A schematic illustration of the AFE system is presented in Fig. 2, which shows a high isolation (ca. 30 dB) coupler with a coupling factor of 16 dB used in order to split the transmitted signal and to obtain the reference for mixing. The reference signal is then amplified to fulfill the minimum requirement of the mixer. By mixing the reference signal (FMCW signal) with a deflected echo signal coming from the R x antenna, the signal at the mixer output is a sinusoidal signal with a frequency proportional to the object's range and radial velocity [Reference Parrish5].
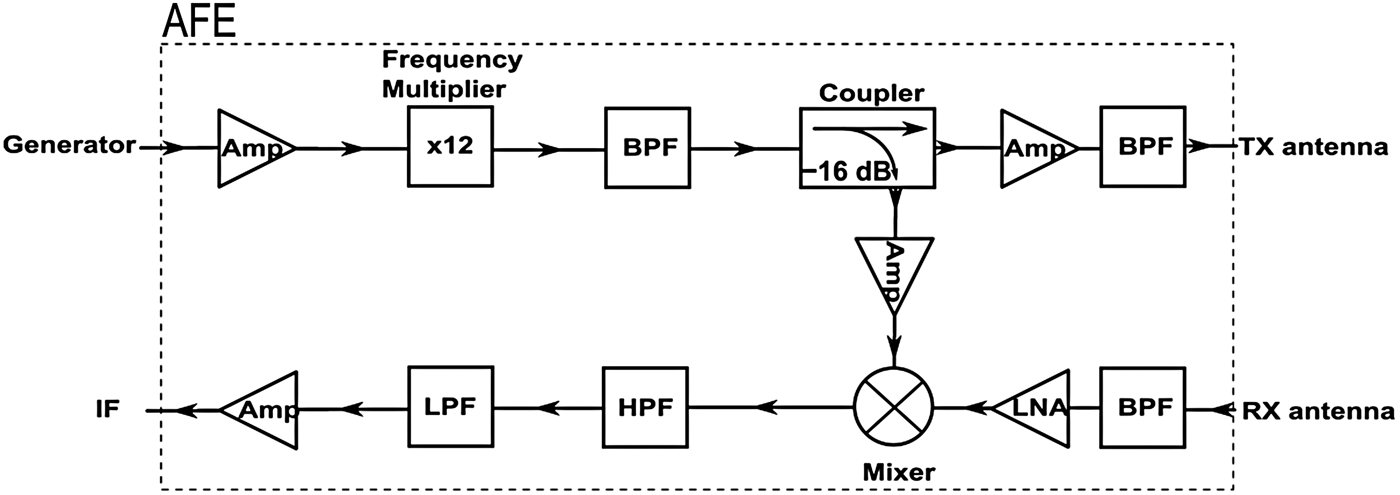
Fig. 2. AFE scheme.
The beat signal generated is further amplified and filtered before sampling. The overall operation of the AFE is presented in Fig. 2. In general, combining high-pass filters with low-pass ones enables the realization of a bandpass filter, which specifies the cut-off frequencies from the desired range. Reducing the bandwidth of the received signal (which, in turn, decreases the thermal noise input in the system) is another function of the low-pass filter, in addition to selecting the differential component of the beat signal. The use of a high-pass filter, on the other hand, effectively eliminates the leakage signal [Reference Brooker4], which is one of the main challenges in designing FMCW radars. The experiments presented in this paper were carried out with a high-pass filter installed. It is worth stressing that the frequency of leakage signals varies depending on the parameters of the transmitted chirp signal (the bandwidth and modulation period). It should be kept in mind that in the case where no high-pass filter is installed, if the leakage signal is too large it can saturate the amplifier placed behind the mixer and degrade the overall system's performance [Reference Pek7]. This does not occur if the paths of the leakage signal and the reference signal are of the same length, which constitutes a condition, which is hardly ever satisfied. If this is the case, the mixer works as a phase detector working only with the AC signals.
Below, in Figs 3 and 4, AFEs are presented as designed and constructed by the authors. As can be seen the AFEs are constructed from COTS components, mainly connectorized with SMA connectors. The first version of the AFE (in its early stage of development) is presented in Fig. 3. Recently, the authors have proposed an AFE system implemented on a printed circuit board (PCB) by using surface mount device/technology (SMD). A smaller and lighter AFE with two receiving channels is presented in Fig. 4.

Fig. 3. AFE photo.

Fig. 4. AFE (SMD version).
III. SIGNAL GENERATION AND ACQUISITION
The use of USRP devices enables easy modification of the transmitted signal parameters and the overall system configuration. The USRP is a multipurpose software-defined radio transmitter/receiver designed for low-cost experimentation and prototyping [8]. The USRP has been used only in the generation and acquisition processes, although it allows for the conducting of other operations of the signal, e.g. demodulation, filtering, etc. A functional diagram of the FMCW radar system is presented in Fig. 5. Two USRP devices and the computer are connected by a Gigabit Ethernet (GigE) interface, which enables the user to realize a maximum transfer of 50 MS/s of real-time bandwidth in both directions (transmitting and receiving) simultaneously (a full duplex). Together with the USRPs, free and open-source software can be used. Graphical programming environments such as LabView or GNU Radio allow for the construction of flow graphs, which determine the processes of the signal and the flow of data through the program.
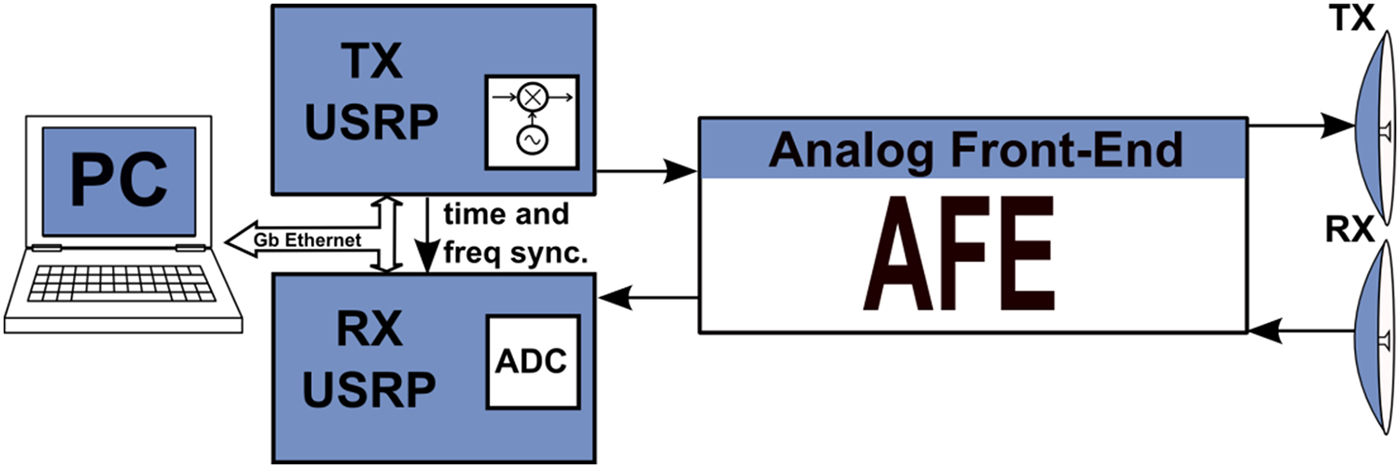
Fig. 5. Scheme of FMCW radar system with designed AFE.
In a FMCW radar the synchronization process is a crucial issue [Reference Gierlich, Huttner, Dabek and Huemer9]. The easiest method of synchronizing the sample clocks of two devices is by using a multiple input, multiple output (MIMO) cable [10]. In such a configuration a single Gigabit Ethernet interface is used to control both USRPs. The USRP connected to the GigE acts as a switch, which provides data to/from both USRP devices. It also handles the time synchronization of the data so the synchronization process is transparent. The total sample rate for USRPs connected to the single GigE port on the host computer cannot exceed 25 MS/s in the 16-bit mode.
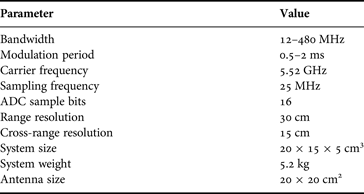
The next issue, which must be taken into consideration is the nonlinearity of the frequency sweep, which causes degradation of the resulting images [Reference Kurt11]. The use of USRPs limits the possibility of frequency sweep correction unless one attempts to make appropriate adjustments in the FPGA motherboard of the device. The most important system parameters are gathered and presented in Table 1.
Table 1. System specification.
The FMCW radar with the designed AFE tested in real operations is presented in Fig. 6 below. The whole system consists of two USRPs, one for signal generation and another for signal acquisition; an industrial PC for the controlling and synchronization of the system; and the designed AFE and DC–DC converters as the power source. Four DC–DC converters were used because four different supply voltages were needed for the system, but the idea was to supply the whole system from one power source. The overall dimensions are around 20 × 20 × 30 cm3, with a total weight of 5.2 kg (including antennas and an external power amplifier) and the total power consumption is around 70 Watts. The tests of the radar system with the designed AFE are presented in the next paragraph.

Fig. 6. FMCW radar system with designed AFE.
IV. SYSTEM VERIFICATION
A) Laboratory test
Before the system was tested in real environments, experiments had been carried out at the Warsaw University of Technology (WUT) with the first test done in front of the WUT main building. The application of the FMCW radar for determining range and velocity information has been extensively and well described [Reference Parrish5, Reference Wojtkiewicz, Misiurewicz, Nałęcz, Jędrzejewski and Kulpa12]. The main purpose of the tests was to verify if the FMCW radar with the designed AFE would work properly and whether all requirements made during the designing stage would be met.
The test scenario consisted of a stationary radar with its antenna main lobe directed towards a moving target. With this test the authors were able to check if the radar was capable of detecting a running man (a classical FMCW moving target indication (MTI) operation) and to evaluate the effectiveness of leakage cancellation. In this case the 0 IF signal represented the echo signal reflected from the moving object (the running man) at the very close distance of around 80 m from the radar. The generated chirp signal bandwidth was 480 MHz with a chirp duration of 0.5 ms. As already mentioned, the frequency of the recorded sinusoidal signal was proportional to the distance between the radar and the running man (see equation (5)) and it changed during the 10 s of acquisition (see Fig. 8). Figure 7 presents two periods of the IF signal. The signal length is 10000 samples, which is equal to 1 ms of time (ADC sampling was 10 MHz). The maximum amplitude of the 0 IF beat signal is from −1 V to +1 V. What could also be noticed was that the chirp signals were generated with a 10% length zero gap between the chirps. The range-time matrix is presented in Fig. 8. The man moving closer to and going away from the radar is clearly visible and the cancelation of the leakage signal is also presented as there is no echo from range 0 up to 25 m.

Fig. 7. The beat signal produced by two consecutive sweeps.

Fig. 8. The range time matrix of the first test of AFE – running man is visible.
After transforming the range-time matrix into a range-velocity matrix, the range and velocity of the running man can be determined. The results presented in Fig. 9 show the detected human body marked with a white circle. As can be seen, the man was running with a radial speed of around 3 m/s, which translates to 10 km/h at a distance of around 80 m from the radar.

Fig. 9. The results of the AFE system in a classical FMCW performance.
In conclusion, the moving target (the running man) as well as the absence of leakage signal in the resulting image can be clearly seen, which confirms the effectiveness of the AFE system.
B) SAR test using car platform
The next set of tests of the presented AFE were carried out in Pruszkow, Poland, with the goal of verifying the possibility of ground SAR imaging. The system antennas, mounted on the rooftop of the car, was set about 2 m above ground. The rest of the system – the designed AFE, USRPs and industrial PC – was mounted inside the car.
Figure 10 presents the radar system mounted in the car; the left picture shows the radar hardware inside the car, and the right picture shows the installation of the antennas on the roof of the car. For testing purposes two different types of antennas were used. Installing the antennas on the car rooftop limited the detection range, so only targets, which were visible (by the antennas) on the horizon could be imaged. In addition, reflections from near field objects limited the dynamic range of the signal. The targets of interest were buildings and forests, which were close to the radar (up to a few hundred meters).

Fig. 10. Car used as a radar carrier for the first mobile tests. From the left: radar hardware (AFE, USRP and PC) inside the car. From the right: antennas mounted on the rooftop of the car.
The scenario is presented in Fig. 11. The car was moving with a constant speed of around 50 km/h along a straight road (Przyszlosci Street in Pruszkow). The signal used to illuminate the target had a bandwidth of about 240 MHz and a pulse repetition frequency equal to 1 ms. To obtain the SAR image, an automatic signal processing algorithm developed by the authors was used. The resulting SAR image is presented below in Fig. 12 and the corresponding satellite Google Earth image of the area under observation is in Fig. 11. Due to the range resolution equal to approximately 0.6 m, determining the size of the objects was possible. The SAR image (Fig. 12) shows objects such as buildings, fences, and edges of the forest.

Fig. 11. Google Earth image of the scene.

Fig. 12. Ground SAR imaging.
C) Airborne SAR test
The final testing of the AFE was done in November 2013 with the goal of verifying the use of the presented AFE for an SAR application. A small aircraft – the PZL-104 Wilga – was used (see Fig. 13) as a carrier platform for the system. The measurement campaign was carried out in the area surrounding the city of Plock in Poland.

Fig. 13. The radar installation on PZL-104 Wilga aircraft.
Figure 14 presents two consecutive beat signals. In comparison with Fig. 7 the amplitude of the signal is lower because there are no objects close to the radar. Figure 15 presents the obtained SAR image of the Podolszyce district of Plock city (global positioning system (GPS) coordinates 52.543368, 19.763692). Figure 16 shows a Google optical image of the area under observation and illuminated by the radar. Figure 17 presents a video frame from the camera installed on board the aircraft. After comparing these images, it can be concluded that the SAR image – gathered in the microwave band – fits the objects in the optical image quite accurately. In addition comparing both images (Fig. 15 and Fig. 16) shows that, some objects have disappeared, while others have emerged. This is because the SAR imaging was done at the end of 2013, while the optical satellite image was taken at the beginning of 2010.

Fig. 14. The beat signal produced by two consecutive sweeps.

Fig. 15. Results of the final SAR tests: SAR image of the Podolszyce district of Plock city – (GPS coordinates 52.543368, 19.763692).

Fig. 16. Results of the final SAR tests: optical image of the Podolszyce district of Plock city, Poland – (GPS coordinates 52.543368, 19.763692). Google Maps.

Fig. 17. Results of the final SAR tests: Video frame from camera installed on board the aircraft: the Podolszyce district of Plock city, Poland – (GPS coordinates 52.543368, 19.763692). Yellow shade represents the main beam of the antenna.
The result obtained successfully verifies both the effectiveness of the designed AFE and the concept of using USRP hardware for SAR radars.
V. CONCLUSIONS
The design and validation tests of the compact C-band AFE system based on RF components were presented in this paper. The designed AFE system with the USRP devices and the PC constitute a full radar system, which can be used for research and various radar applications. The proposed AFE component of the radar system is cheap, light, and small in size. Taking into account the effectiveness and reliability of the presented system in collecting raw data, it has been decided that another AFE system based on RF components with two receiving channels should be implemented, enabling the possibility of interferometric measurements. Meanwhile, the proposed AFE system – implemented on a PCB by using surface mount technology – is currently being tested.
The SAR and MTI images presented in this paper were created with efficient, reliable, and low-cost components. Moreover, as the results show, the designed AFE can be used successfully as a radar applied for target detecting and imaging not only in academic projects, but also in real life applications.
 Damian Gromek is the author/coauthor of over 30 scientific papers. He has been involved in several projects made possible through grants from both European and national institutions. His research interests are digital signal processing, radar signal processing, synthetic aperture radar, noise radar, and remote sensing. He received his M.Sc. degree in Electronics from the Warsaw University of Technology, Warsaw, Poland, in 2011. As a Ph.D. student (since 2011) he works in the Research and Development Team at the Warsaw University of Technology.
 Piotr Samczyński (M'03) received his B.Sc. and M.Sc. degrees in Electronics and Ph.D and D.Sc. degrees in Telecommunications all from the Warsaw University of Technology (WUT), Warsaw, Poland in 2004, 2005 and 2010, 2013, respectively. Since 2010, he has been an Assistant Professor at the WUT; and since 2014 a member of WUT's Faculty of Electronics and Information Technology Council. From 2005 to 2010, he was a research assistant at the Przemyslowy Instytut Telekomunikacji S.A. (PIT S.A.), and from 2009 to 2010 he was the head of PIT's Radar Signal Processing Department. He is the author or co-author of over 150 scientific papers. His research interests are in the areas of radar signal processing, passive radar, synthetic aperture radar, and digital signal processing.
 Maciej Wielgo is a Ph.D. student at the Warsaw University of Technology, Poland. He received his M.Sc. degree in Telecommunications in 2014. He has been involved in several projects granted from national institutions. His research interests include passive and synthetic aperture radars, tracking systems, telecommunications systems, and signal processing.
 Mateusz Malanowski (S'02, M'08) received his M.Sc. and Ph.D. degrees in Electrical Engineering from the Warsaw University of Technology, Warsaw, Poland, in 2004 and 2009, respectively. He was a Research Scientist with FGAN (Forschungsgesellschaft fuer Angewandte Naturwissenschaften), Germany, and an Engineer with Orpal, Poland. Currently, he is an Assistant Professor at the Warsaw University of Technology. He is the author/coauthor of over 90 scientific papers. His research interests are radar signal processing, target tracking, passive coherent location, synthetic aperture radar and noise radar. He is a member of the Institute of Electrical and Electronics Engineers (IEEE) and Institution of Engineering and Technology (IET).
 Krzysztof Kulpa (M'1991, SM'2010) received his M. Sc., Ph.D. and Dr Sc. degrees from the Department of Electronic Engineering, Warsaw University of Technology (WUT) in 1982, 1987 and 2009, respectively. He is now the head of the Radar Technology Research Group at WUT and since 2011 Scientific Director of the Defense and Security Research Center of the Warsaw University of Technology. In 2014 he obtained the title of State Professor. His research interests are in the area of radar signal processing, including imaging, passive and noise radars. He has had more than 260 papers published in journals and conferences. He is a member of the Committee of Electronics and Telecommunication at the Polish Academy of Science, and also of IEEE, EUMA, AOC and URSI, where he has been chair of the Poland Section Commission F: Wave Propagation and Remote Sensing since 2012.


