


Fruits and vegetables (FV) are important for the prevention of many chronic diseases and maintaining a healthy weight, yet only 9 % of US adults in 2017 consumed the recommended five daily cups (1·5–2 cups of fruits and 2–3 cups of vegetables), including low-income older adults(Reference Lee-Kwan, Moore and Blanck1,Reference Guenther, Dodd and Reedy2) . Inadequate FV consumption is associated with increased risk of CVD(Reference Seligman, Laraia and Kushel3), type 2 diabetes(Reference Seligman, Bindman and Vittinghoff4), certain cancers(Reference Daneshi-Maskooni, Badri-Fariman and Habibi5), obesity(Reference Dhurandhar6,Reference Gundersen and Ziliak7) and depression(Reference Casey, Goolsby and Berkowitz8). Preventable diet-related chronic diseases are not only key drivers of poor health and disability but also have a profound impact on healthcare costs(Reference American Diabetes9–Reference Khavjou, Phelps and Leib12). Social and structural factors, such as cultural norms and economic mobility, contribute to diet-related behaviours and health disparities, particularly among low-income, and racial and ethnic minority households in the USA(Reference Kirkpatrick, Dodd and Reedy13,Reference Satia14) . Diet-related health disparities are further compounded by the disproportionate burden of food insecurity as well as limited access to nutritious and affordable foods among low-income and minority households(Reference Coleman-Jensen, Rabbitt and Gregory15), including low-income and minority seniors(Reference Borden, Doyle and Ingraham16).
The Supplemental Nutrition Assistance Program (SNAP) is the largest federally funded nutrition assistance programme serving on average 40 million individuals per month with an annual budget of approximately $70 billion(17). SNAP aims to reduce food insecurity by providing monthly benefits to supplement food budgets for eligible households with broad parameters around the types of grocery items that can be purchased. In 2017, 15 % of Rhode Island (RI) residents received SNAP benefits, compared with 13 % nationally(Reference Nchako and Cai18). On average, SNAP recipients receive $1·40 per meal(19). While this may help address food insecurity, this benefit amount may be insufficient to support participants with purchasing the recommended daily amounts of FV. As such, SNAP participants face many food resource management challenges, including procuring and preparing healthy meals(Reference Guthrie, Andrews and Frazao20–Reference Lucan, Barg and Long22) and on average, SNAP participants have less healthy diets than both SNAP-eligible nonparticipants and higher-income individuals(Reference Andreyeva, Tripp and Schwartz23,Reference Cole and Fox24) . In previous studies, cost(Reference Lucan, Barg and Long22,Reference Haynes-Maslow, Parsons and Wheeler25) and physical access(Reference Leung, Hoffnagle and Lindsay21) to produce are two primary barriers that prevent SNAP participants from purchasing and consuming fresh FV, in addition to quality, variety and access to transportation.
Mobile produce markets (MPM) vary in programme design and implementation, but they are characterised as small travelling markets that sell FV in targeted areas with limited access to FV(Reference Hsiao, Sibeko and Troy26). MPM typically sell a limited variety of items and operate a schedule that rotates between multiple locations, allowing them flexibility and adaptability to the preferences and needs of the communities they serve. For example, Food on the Move (FOTM), highlighted in this case study, operates a refrigerated trailer attached to a van that hosts weekly, 2-h markets at housing sites across RI and sells fifty to seventy different varieties of produce. MPM aim to reduce diet-related health disparities by bringing affordable, fresh produce directly to communities that face significant barriers to acquiring FV due to access or transportation barriers(Reference Hsiao, Sibeko and Troy26). A recent systematic review of MPM found a consistent association between MPM use and increased FV intake(Reference Hsiao, Sibeko and Troy26). However, some MPM have been unsuccessful in reaching customers who are representative of the intended target communities, highlighting the need for community engagement in their planning and implementation(Reference Ylitalo, During and Thomas27).
FOTM is an MPM in Providence, RI that was informed by two NIH-funded research trials that found the MPM was correlated with increases in FV consumption among children and low-income older adults(Reference Gans, Gorham and Risica28–Reference Gorham, Dulin-Keita and Risica30). For example, Live Well, Viva Bien, a cluster randomised controlled trial targeting low-income housing sites (both family and senior), found that the intervention group significantly increased total FV intake by 0·52 cups/d(Reference Gans, Gorham and Risica28). Given its success and impact, the Rhode Island Public Health Institute transitioned Live Well, Viva Bien to a community-based programme, known today as FOTM. A full description of the transition from the research trials to FOTM is described in detail elsewhere (‘in press’). The results of Live Well, Viva Bien, which found significant effects among the senior sites but not the family housing sites(Reference Gans, Gorham and Risica28), prompted FOTM to intentionally target senior housing sites for new market locations. FOTM expanded the programme model to include a SNAP incentive by offering a $1 for $1 match for all purchases made with SNAP benefits at all FOTM sites.
Providing a financial incentive for individuals to purchase healthy foods is an emerging strategy to increase FV consumption and improve public health(Reference Bleich, Rimm and Brownell31–Reference Parks, Stern and Fricke33). SNAP incentives are designed to encourage individuals to use their SNAP benefits to purchase healthy products by providing an economic incentive such as discounts, matching vouchers, coupons or rebates. Findings from programmes offering SNAP incentives show an increase in both purchases and consumption of FV(Reference Bartlett, Klerman and Olsho34–Reference Polacsek, Moran and Thorndike41). For example, the Healthy Incentives Pilot offered a 30 % rebate on purchases of targeted FV in grocery stores in Hamden County, MA. Participation in the programme was associated with an increase in FV consumption by almost a quarter of a cup, closing the gap between the current FV intake and the Healthy People 2020 objectives by 18 %(Reference Bartlett, Klerman and Olsho34). Similarly, a study in Utah investigated whether a farmers’ market-based SNAP incentive, Double-Up Food Bucks, impacted food security and FV intake(Reference Savoie-Roskos, Durward and Jeweks39).
However, the impacts of incentives on healthy eating behaviours at MPM have not been well characterised. A growing number of MPM offer SNAP incentives, yet few studies to date have examined SNAP incentives in an MPM setting. In particular, the impact of SNAP incentives on food security and food purchases in an MPM setting may be larger for vulnerable populations, such as older adults with limited mobility(Reference Hsiao, Sibeko and Troy26).
The primary purpose of this cross-sectional study is to characterise the customer base of FOTM MPM and describe their purchases and behaviours. This study describes the shopping habits and experiences of low-income seniors at FOTM markets, comparing demographics, food insecurity status and eating behaviours of participants who receive SNAP benefits to those who do not currently receive SNAP. We also explored whether customers who received SNAP benefits would purchase and consume more FV as a result of the 50 % discount at FOTM markets, relative to non-SNAP counterparts.
Methods
Programme overview and study setting
Since its transition from a research trial to a community-based programme, FOTM has operated an MPM at over fifty sites across RI. As of 2019, FOTM serves primarily subsidised senior housing facilities in the urban-core cities where the majority of RI’s communities of low socioeconomic status reside. FOTM aims to help older adults improve nutrition and food security, better manage diet-related chronic diseases and maintain independence. At the time of this study, FOTM had a total of twelve market sites at: subsidised senior housing facilities (n 9), public libraries (n 2) and a food pantry (n 1) that operate year-round. Market staff use a truck and refrigerated trailer to deliver a variety of culturally appropriate FV to these community sites for either monthly or weekly markets that are open for at least 2 h. FOTM offers between fifty and seventy different types of FV at each market, which are competitively priced with other discount grocery retailers in the area. Select markets that operate in public housing sites are only open to residents of that site, while other markets are open to the public. Rhode Island Public Health Institute has managed and grown the programme since 2014 as part of its mission to promote community health and to eliminate health disparities in RI. Most notably, FOTM provides a 50 % discount for purchases made with SNAP at the market. For example, a SNAP participant who purchases $50 worth of FV receives a 50 % discount at the point-of-sale and pays only $25 with their SNAP benefits.
Recruitment
In 2018, Rhode Island Public Health Institute launched an evaluation of the FOTM programme to measure and assess the association between the market use and dietary behaviours, food security and health outcomes. Customers were recruited to participate in a 20-min survey at FOTM markets from June to August 2018. Trained survey staff attended markets at twelve FOTM sites to distribute recruitment materials and enrol customers. In addition, market staff assisted with recruitment during checkout by describing the survey and incentive to customers. All FOTM customers aged 18 years or over were eligible to participate in the survey. Recruitment occurred at all sites between three and eight times during the study period depending on the frequency of the market (monthly v. weekly). In addition, flyers were distributed at all of the market sites with information on how to contact the study team if interested in the survey. (Ethical Standards Disclosure)
Surveys
The survey was interviewer-administered either in person during the FOTM market hours or via the phone, depending on the preference of the participant. Participants could take the survey in either English or Spanish. All participants provided verbal consent before launching the survey. The survey was programmed in Qualtrics and included 118 questions subdivided into separate sections to provide added security for protected health information. All participants were assigned a unique ID to protect confidentiality. All questions were voluntary, and all participants received a $10 gift card to FOTM.
Measures
All demographic measures were categorical variables. Food security status in the last 12 months was determined using responses to the USDA six-item short-form Food Security Survey Module (Reference Bickel, Nord and Price42). The total number of affirmative responses was summed to determine food security status as food secure (0–1) or food insecure (2–6), which was further divided into low food security (2–4) and very low food security (5–6). All questions related to shopping characteristics were for personal behaviours, regardless of whether or not someone was the primary food shopper for their household. Four questions assessed what was important for survey respondents when choosing where to buy most of their FV. Responses ranged on a five-point Likert scale from ‘not at all important’ to ‘extremely important’. For analysis, these were collapsed into two categories: ‘important’ (very, extremely) and ‘not important’ (not at all, slightly and moderately). One question assessed whether lack or cost of transportation was ever a barrier to getting to a FV retailer. SNAP enrolled customers were asked how many months they received SNAP benefits in the past year, their average monthly benefit amount (USD), their average monthly grocery purchase amount in dollars not using SNAP benefits (USD), how long benefits typically lasted during the month and if they had visited a food pantry in the last 30 d. Three questions assessed the impact of the SNAP incentive on FOTM customers’ self-reported FV purchases and consumption. One question assessed what percentage of spending on FV was at FOTM (none, one quarter, one-half, three quarters, all). A two-question FV screener from the National Cancer Institute’s Food Attitudes and Behaviors Survey assessed daily FV consumption(Reference Erinosho, Pinard and Nebeling43). Nine questions assessed FOTM markets’ impact on participants’ health, lifestyle and FV consumption. Responses ranged on a five-point Likert scale from ‘disagree a lot’ to ‘agree a lot.’ For analysis, these were collapsed into two categories: ‘agree’ (somewhat and a lot) and ‘disagree’ (neutral, somewhat and a lot).
Data analysis
The descriptive statistics calculated were proportions due to the categorical nature of the variables. As all questions were voluntary, ‘don’t know’ and ‘refused’ responses were re-coded as missing. Therefore, the item response rate for each question varied. Missing responses ranged from 0·0 to 7·0 % of total responses for all survey questions except for household income, where the missing responses were 15·9 % of the total. We hypothesised that respondents who received SNAP benefits would purchase and consume more FV as a result of the 50 % discount at FOTM markets, relative to non-SNAP customers. Therefore, we used χ 2 tests to evaluate differences in variables in Tables 1, 2 and 4 between respondents who received SNAP benefits and respondents who did not receive SNAP benefits. A two-sample t test was used to assess group differences for the average travel time to the grocery store. A P value for the difference between the two groups is shown for each variable. Statistical significance was defined at α = 0·05 level. All data analyses were performed using Stata version 14.2 (StataCorp LLC). Finally, multivariable mixed logistic regression analyses predicting increased FV purchase and consumption were conducted using R 3.5.3 (RStudio). These mixed logistic regression analyses accounted for between market site variability in outcomes.
Table 1 Characteristics of food on the move customers
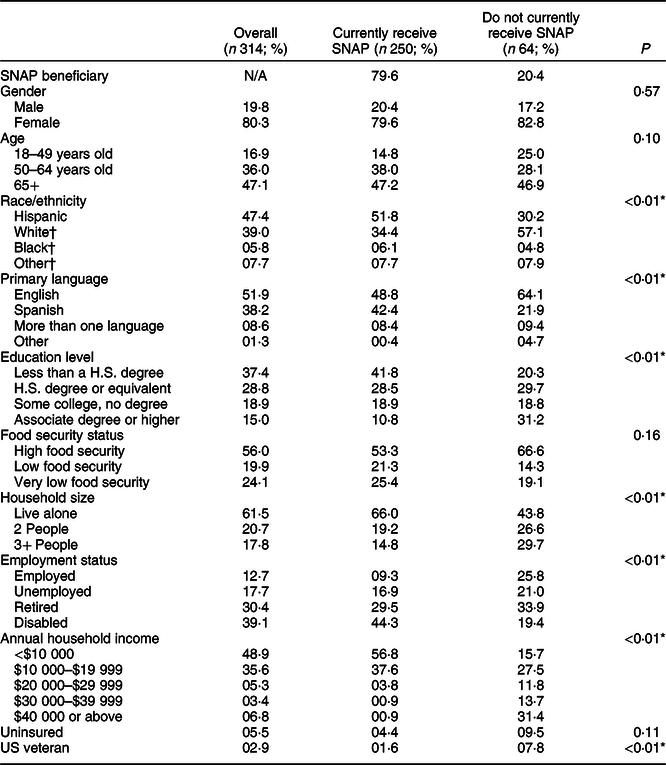
SNAP, Supplemental Nutrition Assistance Program.
* Statistically significant at the 0·05 level.
† Non-Hispanic.
Table 2 Typical shopping characteristics of food on the move customers
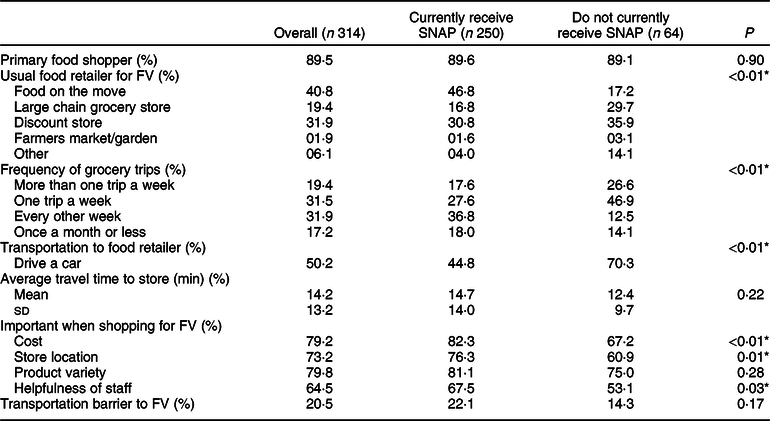
SNAP, Supplemental Nutrition Assistance Program; FV, fruits and vegetables.
* Statistically significant at the 0·05 level.
Results
A total of 330 customers participated in the survey, and the overall response rate was 68 % (out of 485 total customers who were offered an opportunity to participate). A total of thirteen surveys were excluded because they were either incomplete or survey administrators indicated that the responses were not reliable due to lack of comprehension or language barriers. An additional three surveys were excluded from analysis because they did not provide a response for whether or not they currently received SNAP benefits. Descriptive statistics were calculated for the overall sample (n 314), the proportion of the sample that received SNAP benefits (n 250), and the proportion that did not receive SNAP benefits (n 64).
Among those surveyed (n 314), the majority of FOTM customers (79·6 %) were active SNAP participants (Table 1). Customers were also primarily female and over the age of 50 years. Most respondents self-identified as Hispanic, followed by non-Hispanic white. English was the most common primary language spoken at home, followed by Spanish. Almost half of the customers were food insecure: 19·9 % screened as experiencing low food security and 24·1 % as experiencing very low food security. Among SNAP customers, almost half were screened as food insecure, although this was not statistically significant from non-SNAP customers. The majority of customers lived alone, had annual household incomes under $20 000 and had a high school degree or less. Most customers were either disabled or retired. The majority of FOTM customers were insured, and very few were US veterans. Between SNAP and non-SNAP customers, there were statistically significant differences (P < 0·01) in race/ethnicity, primary language, education level, annual household income, household size, employment status and veteran status. We also compared the differences in population characteristics between the senior sites, library and food pantry, and participants were had similar demographic backgrounds (data not shown).
Approximately nine out of every ten FOTM customers reported being the primary food shopper for their household (Table 2). Four out of every ten FOTM customers reported that FOTM was their usual food retailer for FV. The next most common food retailer for FV was discount grocery stores, followed by large grocery store chains. Most customers either made one trip to the grocery store per week or one trip every other week. One in five customers noted transportation as a barrier to getting FV. There were significant differences (P < 0·01) in usual food retailer for FV and grocery trip frequency between SNAP and non-SNAP customers. Non-SNAP customers were significantly more likely than SNAP customers to drive a car to get to the grocery store (P < 0·01). SNAP customers were significantly more likely to report that cost (P < 0·01), store location (P = 0·01) and helpfulness of staff (P = 0·03) were important factors for choosing where to shop for FV than non-SNAP customers.
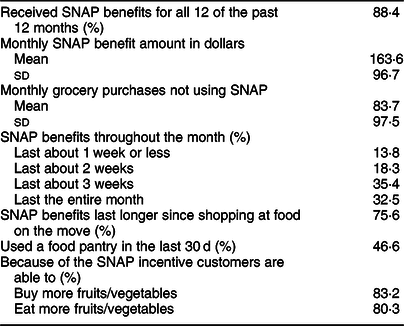
Among current SNAP customers, the vast majority received benefits for all 12 months in the past year (Table 3). The average monthly SNAP benefit amount was $163·6 (sd $96·7), which was positively correlated with household size (results not shown). Two-thirds of FOTM customers reported that SNAP benefits do not usually last throughout the entire month. Almost half of the SNAP customers reported using a food pantry in the past month. Customer experience with SNAP at FOTM was viewed very positively. Overwhelmingly, customers cited that their SNAP benefits last longer since they started shopping at FOTM. Customers also agreed that they buy and eat more FV because of the SNAP incentive.
Table 3 Supplemental Nutrition Assistance Program (SNAP) benefits and shopping habits at Food on the Move Markets (n 250)
The majority of customers reported consuming 1–2 cups of fruit per day and 1–2 cups of vegetables per day, with significant differences in vegetable consumption between SNAP and non-SNAP customers (P = 0·04) (Table 4). Most customers (84·9 %) reported this as increase in total FV consumption. SNAP customers were more likely than non-SNAP customers to buy at least half of their FV from FOTM (P < 0·01) and to agree that shopping at the markets for FV is more convenient (P = 0·03) and costs less (P < 0·01) than where they usually buy groceries. Compared with non-SNAP customers, SNAP customers were also more likely to agree that they buy more FV (P ≤ 0·01), eat more FV (P ≤ 0·01), better manage their health (P < 0·01) and eat a healthier diet (P = 0·01) because they shop at FOTM.
Table 4 Impact of food on the move markets
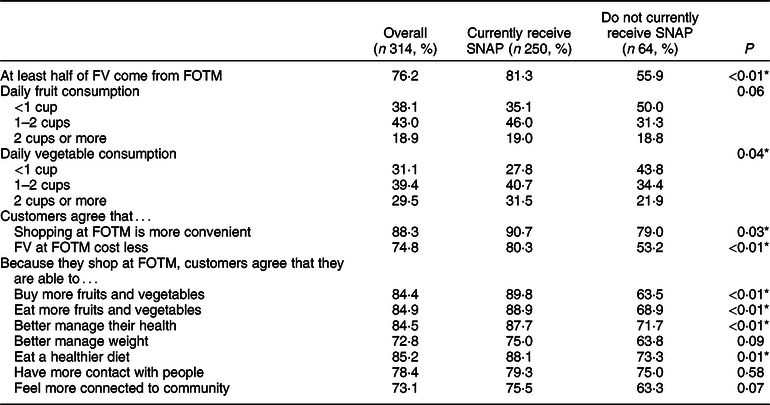
SNAP, Supplemental Nutrition Assistance Program; FV, fruits and vegetables; FOTM, Food on the Move.
* Statistically significant at the 0·05 level.
Finally, multivariable mixed logistic regression analyses indicated that, after accounting for between-market site variability (including frequency of market visits) and adjusting for demographic characteristics (age, gender, race, ethnicity and household size), SNAP customers were more likely to report buying more FV (aOR = 3·09; 95 % CI 1·61, 5·94) and report eating more FV (aOR = 2·80; 95 % CI 1·41, 5·55) because they shop at FOTM (Table 5). However, FOTM customers in households with more than three people were less likely to report buying more FV because they shop at FOTM compared with households with only one person (aOR = 0·28, 95 % CI 0·11, 0·71), and FOTM customers in households with three or more people were less likely to report eating more FV because they shop at FOTM (aOR = 0·31, 95 % CI 0·12, 0·81) (Table 5).
Table 5 Mixed multivariable logistic regression results for Food on the Move (FOTM) shopper outcomes
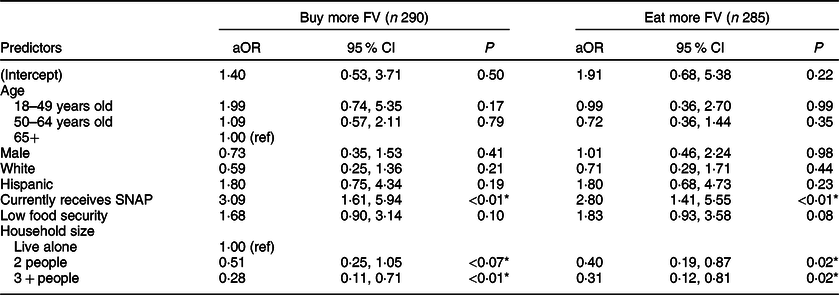
FV, fruits and vegetables; SNAP, Supplemental Nutrition Assistance Program.
* Statistically significant at the 0·05 level.
Discussion
The results of this study demonstrate that FOTM successfully reaches and engages some of RI’s most vulnerable populations, in particular low-income seniors living in public housing. In general, FOTM customers are over 50 years old, low-income (annual household income <$20 000), female, Hispanic, either retired or disabled and currently receive SNAP benefits. FOTM’s diverse customer base reflects an intentional programme design, focused on reaching seniors in subsidised senior housing facilities in urban areas of RI; this population previously demonstrated high responsiveness and impact during the Live Well, Viva Bien trials(Reference Gans, Risica and Keita29). These results contrast with previous studies that found MPM customers may not be representative of the intended audiences or people at greatest risk for having limited access to healthy foods. This also underscores the importance of developing community partnerships that can contribute to MPM reach and success(Reference Ylitalo, During and Thomas27,Reference Zepeda, Reznickova and Lohr44) . Even with access to the MPM, the burden of food insecurity among FOTM customers (44 %) is more than three times greater than the overall prevalence of food insecurity in RI (12·4 %)(Reference Coleman-Jensen, Rabbitt and Gregory15). Among FOTM SNAP customers, 46·7 % are food insecure, compared with 33·4 % among non-SNAP customers, although not statistically significant (P = 0·16). Over 40 % of customers indicated that FOTM was their primary source for FV; similarly, over 80 % of SNAP customers purchased at least half of their FV from FOTM. Taken together, these findings suggest that FOTM is reaching among the most vulnerable and food-insecure Rhode Islanders, and facilitating healthy purchasing behaviours.
FOTM aims to enhance physical access to produce by bringing fresh FV directly to their place of residence or other community spaces and lower the cost of produce by offering competitively priced products as well as a 50 % discount at the point-of-sale for purchases made with SNAP benefits. Previous qualitative research found that cost and physical access were two of the most common barriers to FV consumption among communities of low socioeconomic status(Reference Leung, Hoffnagle and Lindsay21,Reference Lucan, Barg and Long22,Reference Haynes-Maslow, Parsons and Wheeler25) , including low-income older adults(Reference Hsiao, Sibeko and Troy26). Similarly, one in five FOTM customers indicated that transportation was a barrier to purchasing FV. The findings from the survey highlight that an MPM offering a SNAP incentive programme successfully lowers costs and access barriers to FV for low-income seniors. The majority of FOTM customers agree that shopping at FOTM for FV is more convenient than where they normally shop for groceries. Similarly, almost three quarters of FOTM customers agreed that FV at FOTM cost less than their regular grocery retailer.
These results also highlight specific positive impacts of FOTM markets on customers, many of which were driven by the SNAP incentive, increasing the effects of the MPM among SNAP customers. For example, SNAP customers were more likely to describe the markets as convenient and affordable, highlighting the importance of the SNAP incentive programme. FOTM’s 50 % discount model is a larger financial incentive than other pricing programmes, including Healthy Incentives Pilot, which may contribute to the positive effects(Reference Bartlett, Klerman and Olsho34). Increasing FV consumption among SNAP customers is particularly important given the evidence that households enrolled in SNAP are less likely to consume the recommended amount of FV(Reference Guthrie, Andrews and Frazao20,Reference Darmon and Drewnowski45) , including low-income older adults(Reference Guenther, Dodd and Reedy2). The SNAP incentive at FOTM is specifically designed to address this disparity by lowering the cost of fresh FV. Furthermore, the application of a SNAP incentive at an MPM may be more socially acceptable, especially among low-income seniors because of the store location and helpfulness of staff. FOTM is centred around these aspects of the customer shopping experience, and higher satisfaction for these characteristics was observed among SNAP customers. For example, FOTM hires and trains market staff who strive to build meaningful, trusting relationships with customers and hosts markets in community spaces with the senior housing facility. These qualities may explain in part why FOTM was the FV retailer of choice among SNAP customers.
Our survey findings show that SNAP customers were more likely to agree that they buy and eat more FV than non-SNAP customers, even after controlling for market location, age, race/ethnicity and household size. However, after adjusting for SNAP, customers from larger households were less likely to report buying and eating more FV because they shopped at FOTM. This may be because larger households face greater resource constraints, which diminish their ability to consume FV. FOTM seeks to facilitate FV consumption by bringing weekly markets to communities that otherwise lack access to nutritious foods and by lowering the cost of FV by offering a financial incentive for purchases made with SNAP benefits. The SNAP incentive is the only difference in market experience between SNAP and non-SNAP customers. The positive results indicate that the SNAP incentive is synergistic with the MPM design and is an acceptable setting for nutrition incentive programmes. These survey results further support the evidence base that SNAP incentives increase self-reported FV purchase and consumption(Reference Bartlett, Klerman and Olsho34,Reference Freedman, Mattison-Faye and Alia36,Reference Phipps, Braitman and Stites38–Reference Polacsek, Moran and Thorndike41) . Increasing marketing efforts that advertise FOTM’s lower prices and providing nutrition education programmes may further bolster healthy eating behaviours among this population, though previous research has reported that attendance at voluntary nutrition education programmes can be low(Reference Gans, Risica and Keita29,Reference Moran, Thorndike and Franckle40) .
Limitations
This study has several limitations. The use of a cross-sectional survey limits the ability to generalise the findings and makes it impossible to determine cause and effect relationships. Because of the real-world nature of the evaluation of the programme, we did not include a control group and baseline measurements prior to programme engagement. We were also unable to determine the reach of the programme due to the public nature of most sites, where non-residents may also be frequent customers. The narrow geographic location may also limit the generalisability of the findings throughout the country. However, RI’s small size in terms of land area and population makes the findings more generalisable to the state level. Finally, individuals of low socioeconomic status who chose to participate in a financially incentivised survey may be systematically different than those who chose not to participate.
However, to the authors’ knowledge, this is one of the first studies to evaluate an MPM that operates a SNAP incentive programme targeting low-income seniors. Furthermore, very few studies have evaluated a SNAP incentive programme design of a 50 % discount on FV purchases made with SNAP benefits v. $1:$1 matching programmes and other types of subsidies.
Conclusion
FOTM has been successful in addressing an unmet need for fresh, affordable produce among vulnerable populations in RI. The success of FOTM is directly linked with the SNAP incentive, as satisfaction with the market experience was particularly pronounced among SNAP customers. Innovative programmes like FOTM can have a meaningful impact on FV consumption, which represents a huge opportunity for promoting healthy food purchases in RI and nationally. Longitudinal transaction-level data are needed to continue to evaluate the impact of FOTM on food security, dietary quality and health outcomes. This study improves understanding of the experience of current FOTM customers that may be relevant to other settings.
This evidence suggests public health opportunities for innovative policies and programmes to improve access to and affordability of FV in communities of low socioeconomic status. For populations with limited access to grocery retailers, in particular low-income seniors with transportation barriers, our programme highlights the efficacy of MPM as a strategy to increase access to FV and reduce health disparities and chronic disease burden. Our experiences also underscore the importance of focusing on communities with a high SNAP enrolment rate and larger populations of older adults. Given the strong impact of this programme on healthy eating behaviours for low-income seniors, FV programmes might be even more impactful when expanded with large-scale grocery retailer, where 90 % of shoppers redeem their SNAP benefits.
Acknowledgements
Acknowledgements: First and foremost, we would like to thank our customers who graciously participated in the survey and remain loyal supporters of the FOTM programme. We would also like to thank our survey administrators who worked tirelessly to collect complete, high-quality surveys with market customers. And lastly, we would like to thank our generous funders, without whom this work would not be possible, including the AARP Foundation, Blue Cross Blue Shield of RI, Rhode Island Department of Health, Tufts Health Plan Foundation and USDA. Financial Support: This work was supported by the US Department of Agriculture Food Insecurity Nutrition Incentive Program (grant no. 2017-70025-26693, 2017–2020), AARP Foundation (grant no. HUN-2016-12-003, 2016–2018), Blue Cross Blue Shield of RI (2018 Transitional BlueAngel Community Health Grant) and RI Department of Health – Health Equity Zones. Conflict of Interest: None. Authorship: A.N. contributed to writing and all aspects of study including study design, data analysis and interpretation. R.L. managed data collection, analysed the data and wrote the manuscript. E.H. and S.D. assisted with data collection, data analysis and manuscript writing. E.D.C. and E.L. coordinated operations for the Food on the Move program. J.R. oversaw statistical analyses. S.A., W.E., C.C. and P.R. provided input on background and discussion sections. All authors reviewed and approved the final version. Ethics of human subject participation: This study was conducted according to the guidelines laid down in the Declaration of Helsinki, and all procedures involving study participants were approved by the Brown University Institutional Review Board as exempt from full committee review. Digital and verbal consent was obtained from all participants and was witnessed and formally recorded.


