


1. Introduction
Vapour bubble growth has long been an area of scientific interest, as they underpin numerous natural phenomena (Prosperetti Reference Prosperetti2017) and engineering applications, such as ultrasonic cleaning (Yasui Reference Yasui2018) and two-phase thermal management systems (Robinson & Judd Reference Robinson and Judd2004). Vapour bubble growth can also have deleterious effects; for example, they have been shown to play a significant role in the explosive failure of pressurised containers (Reinke Reference Reinke1997) and the dryout failure of pool boiling systems (Chu et al. Reference Chu, Joung, Enright, Buie and Wang2013). Understanding the growth behaviour of vapour bubbles is therefore an important open problem, and current theoretical models remain incomplete.
In one of the earliest theoretical analyses on homogeneous vapour bubble growth, Plesset & Zwick (Reference Plesset and Zwick1954) equated the latent heat required to grow the bubble to the heat available through conduction. Their Plesset–Zwick (PZ) model predictions showed excellent agreement with experimental results for water (Dergarabedian Reference Dergarabedian1953) and later for other fluids (Dergarabedian Reference Dergarabedian1960; Florschuetz, Henry & Khan Reference Florschuetz, Henry and Khan1969). However, the PZ model was subsequently shown to significantly overpredict the growth of bubbles at reduced pressures (Lien Reference Lien1969), where there is an increased time scale at which thermal effects dominate the bubble's growth. This overprediction results from an unphysical infinite initial velocity, instead of being limited by inertial forces until the thermal time scale has been reached.
Mikic, Rohsenow & Griffith (Reference Mikic, Rohsenow and Griffith1970) accounted for this inertial limit and derived a formula that interpolates between the inertial velocity given by Rayleigh (Reference Rayleigh1917) and the thermal velocity of Plesset & Zwick (Reference Plesset and Zwick1954); their model is now commonly referred to as the Mikic–Rohsenow–Griffith (MRG) model. The MRG model removes the infinite initial velocity predicted by the PZ model, instead bounding it by the inertial limit, which then better matched experimental data (Lien Reference Lien1969). While the MRG model accurately captures the transition between the inertial- and thermal-limiting velocities, it still overpredicts the growth of an initially static bubble, as it assumes a finite initial velocity. Additionally, there does not exist a model capable of capturing the effects of capillarity and viscosity, which are both relevant to early-stage growth (Avdeev Reference Avdeev2016).
This theoretical bottleneck, coupled with the difficulties in obtaining high-resolution data for isolated bubble growth, has led to the development of numerical techniques for the measurement of bubble growth rates (Dalle Donne & Ferranti Reference Dalle Donne and Ferranti1975; Lee & Merte Reference Lee and Merte1996). These numerical investigations have been used to show excellent agreement with the existing theories, failing only when the assumptions made by the theories are shown to be invalid (Robinson & Judd Reference Robinson and Judd2004). Most numerical models solve the coupled momentum and energy differential equations, with varying approximations for the treatment of heat transfer in the thermal boundary layer (Prosperetti & Plesset Reference Prosperetti and Plesset1978). Recent works have investigated the approximations typically made in the momentum equation, such as Bardia & Trujillo (Reference Bardia and Trujillo2019), who added the effects of mass transfer across the bubble interface. While these numerical studies provide high-resolution data for the growth of vapour bubbles, they do not provide additional clarity to the understanding of the relationship between the inertial and thermal limitations on bubble growth rates that can be obtained from an analytical model.
In this paper we present a new class of inertio-thermal models for the growth of vapour bubbles that captures the competition between inertial and thermal effects on bubble growth. We find that the entire lifetime of the bubble can be modelled by limiting the growth by the available inertia. When compared with existing experimental and numerical data, we show better agreement than the MRG model. We are able to incorporate viscous and capillary effects that are required for nanoscale bubble growth, with comparisons against our own molecular simulations.
2. Model formulation
2.1. Inertial bubble growth
In the absence of thermal effects, the growth of a spherical vapour bubble with vapour pressure  $P_v$ surrounded by a liquid at pressure $P_\infty$ is described by the generalised Rayleigh–Plesset (RP) equation for Newtonian fluids (Prosperetti Reference Prosperetti1982)
 \begin{equation} R\dot U_l + \frac{3}{2}U_l^2-\frac{J}{\rho_l}\left[ 2U_l +J\left( \frac{1}{\rho_v}-\frac{1}{\rho_l} \right)\right] = \frac{1}{\rho_l}\left( P_v - P_\infty -\frac{2\gamma}{R} -\frac{4\mu U_l}{R} \right) , \end{equation}
where  $R$ and $U_l$ represent the bubble radius and the radial velocity in the liquid at the interface, respectively, with dots used to represent their time derivatives; while $\rho _l$, $\gamma$ and $\mu$ represent the liquid's density, surface tension and dynamic viscosity, respectively. The term $\rho _v$ represents the density of the vapour and $J$ is the mass flux across the liquid–vapour interface. The mass flux can be used to relate the radial velocity of the bubble $\dot {R}$ to the velocity of the liquid at the interface $J=\rho _l(U_l-\dot {R})$. For cases away from the critical point, where $\rho _l \gg \rho _v$, the contribution of mass transfer can be neglected, giving the classical RP equation (details in supplementary material available at https://doi.org/10.1017/jfm.2022.734)
 \begin{equation} R\ddot{R} + \frac{3}{2}\dot{R}^2 = \frac{1}{\rho_l}\left({P_v - P_\infty} - \frac{2\gamma}{R} - \frac{4\mu \dot{R}}{R}\right). \end{equation}
 We can see from (2.2) that the stationary case of this model, i.e. when  $\dot {R} = \ddot {R} = 0$, returns the critical radius from nucleation theory $R_{c} = {2\gamma }/{\Delta P}$ (Kaschiev Reference Kaschiev2000, p. 49), where ${\Delta P}$ is the difference between liquid and vapour pressure, i.e. $\Delta P={P_v - P_\infty }$. By integrating (2.2), it has been shown that the inertial bubble velocity reaches a maximum value of $A$, given as (Prosperetti Reference Prosperetti2017)
 \begin{equation} \dot{R}_{RP,max} = A = \sqrt{\frac{2\Delta P}{3\rho_l}}. \end{equation}
Taking the initial acceleration of  ${\ddot {R}}= \Delta P/\rho _l R_0$ (Brennen Reference Brennen2013, p. 38), the time taken by a stationary bubble of initial size $R_0$ to reach this inertial velocity $A$, can be approximated as
 \begin{equation} \tau_{RP} = \frac{A}{\ddot{R}} = R_0\sqrt{\frac{2\rho_l}{3\Delta P}}. \end{equation}
2.2. Thermal bubble growth
Inertial bubble growth continues as long as the pressure difference across the bubble interface is maintained. However, in reality, heat must be conducted through the liquid as the bubble grows in order to balance the latent heat of vaporisation required to grow the bubble. This results in a drop in the bubble vapour pressure  $P_v$ as it grows, and therefore a drop in the pressure difference $\Delta P$. In this section, an overview of existing thermally limited bubble growth models is provided.
Plesset & Zwick (Reference Plesset and Zwick1954) assumed that this heat is conducted through a thin thermal boundary layer, and equated it to the latent heat to obtain an expression for bubble velocity during thermally limited growth (details in the supplementary material)
 \begin{equation} \dot{R}_{PZ}= Ja \sqrt{\frac{3\alpha}{{\rm \pi} t}}, \end{equation}
where  $\alpha = k/\rho _l c_p$ is the thermal diffusivity of the liquid, $k$ is the thermal conductivity and $c_p$ is the specific heat capacity. The Jakob number $Ja$, is the ratio of sensible heat to latent heat, given by $Ja = {\rho _l c_p \Delta T_0}/{\rho _v h_{lv}}$, where $\Delta T_0$ is the initial liquid superheat, and $h_{lv}$ is the enthalpy of vaporisation.
Mikic et al. (Reference Mikic, Rohsenow and Griffith1970) rewrote (2.5) in the form
 \begin{equation} \dot{R}_{PZ}= \frac{B}{2\sqrt{t}}\left(1-\frac{T_{v} - T_{sat}}{\Delta T_0}\right), \end{equation}
where  $B=Ja\sqrt {{12\alpha /{\rm \pi} }}$, $T_{v}$ is the instantaneous vapour temperature and $T_{sat}$ is the saturation temperature of the liquid. Assuming that the instantaneous superheat and pressure difference vary linearly (Theofanous & Patel Reference Theofanous and Patel1976; Lee & Merte Reference Lee and Merte1996) i.e.
 \begin{equation} \frac{T_{v} - T_{sat}}{\Delta T_0} = \frac{P_{v} - P_\infty}{\Delta P_0}, \end{equation}
where  $\Delta P_0$ is the initial pressure difference, (2.5) can now be rewritten in terms of the instantaneous pressure difference, $P_{v}-P_\infty$
 \begin{equation} P_{v}-P_\infty = \Delta P_0\left(1-\frac{2\sqrt{t}}{B}\dot{R}\right), \end{equation}
where we have used  $\dot {R}$ in place of $\dot {R}_{PZ}$ to clarify that the pressure difference varies with bubble velocity, consistent with literature on this topic (Prosperetti Reference Prosperetti1982; Lee & Merte Reference Lee and Merte1996).
Mikic et al. (Reference Mikic, Rohsenow and Griffith1970) then modified the inertial-limiting velocity (2.3) presented in the previous section by using the instantaneous (time-varying) pressure difference to recalculate the velocity rather than the initial (constant) pressure difference typically used, resulting in the MRG model. Thus, the MRG model accounts for the change in vapour pressure as the bubble grows and cools, producing a quadratic equation for  $\dot {R}$. This is expressed in terms of the initial limiting velocity $A_0$, calculated using the initial pressure difference $\Delta P_0$. The negative root of this equation was rejected, giving
 \begin{equation} \dot{R}_{MRG}= A_0\left[\sqrt{\frac{A_0^2}{B^2}t+1}-\sqrt{\frac{A_0^2}{B^2}t}\right]. \end{equation}
Equation (2.9) represents an improvement over the PZ model (2.5) as it extends the applicability of the model to earlier stages of bubble growth, removing the non-physical infinite initial velocity that would be obtained if the PZ model were extrapolated (as  $t\rightarrow 0$, $\dot {R}_{PZ}\rightarrow \infty$ while $\dot {R}_{MRG}\rightarrow A$). The MRG model has been shown to accurately predict the transition from inertially limited to thermally limited bubble growth (Lee & Merte Reference Lee and Merte1996; Robinson & Judd Reference Robinson and Judd2004). Importantly, it sets the time scale
 \begin{equation} \tau_{MRG} = \frac{B^2}{A^2}, \end{equation}
when thermal effects cause the bubble growth to diverge from the inertial limit. Several papers have since made modifications to this model to better capture vapour bubble growth (Board & Duffey Reference Board and Duffey1971; Theofanous & Patel Reference Theofanous and Patel1976; Prosperetti & Plesset Reference Prosperetti and Plesset1978). These modifications generally involve using a different relationship between the vapour pressure and temperature difference, typically a direct linear relationship (Lee & Merte Reference Lee and Merte1996; Robinson & Judd Reference Robinson and Judd2004), instead of the Clausius–Clapeyron approximation originally used by Mikic et al. (Reference Mikic, Rohsenow and Griffith1970).
While the MRG model is an improvement over the PZ model, it still assumes that the bubble begins growing at the inertial-limiting velocity  $A$, ignoring the finite time required for the bubble to reach this velocity from rest. This assumption implies an infinite radial acceleration in the case of an initially static bubble, which is clearly non-physical. In this work, we account for the finite acceleration of initially static vapour bubbles rather than assuming the limiting value from (2.3), as elaborated in the next section.
2.3. Inertio-thermal bubble growth
While (2.2) is challenging to solve analytically in its full form, an analytical solution can be obtained for the inviscid case ( $\mu = 0$) (Dergarabedian Reference Dergarabedian1953). However, this solution only provides the time taken for bubble growth for a given radius, and cannot be inverted to obtain an equation for the temporal variation in bubble radius. This prevents us from using a fully analytical solution to the RP equation with a time-varying vapour pressure, even in the case of zero viscosity.
Instead, we develop a simplified model for the radial velocity in the absence of capillary and viscous effects ( $\mu =\gamma =0$) following the methodology of Avdeev (Reference Avdeev2016, pp. 55–58). The RP equation (2.2) can be written in the simplified form (Brennen Reference Brennen2013, p. 37)
 \begin{equation} \dot{R}_{RP} = {A}\sqrt{ 1 -\left(\frac{R_0}{R} \right)^3}. \end{equation}
Avdeev then integrates this expression in the limits of  $R\to R_0$ and $R\to \infty$ and provides a simpler approximation for the radius
 \begin{equation} R = \frac{R_0}{3} + \frac{2R_0}{3}\sqrt{ 1 + \frac{t^2}{\tau_{RP,0}^2} }, \end{equation}
by assuming a constant pressure difference  $\Delta P_0$, with $\tau _{RP,0}$ representing the corresponding inertial time scale from (2.4), computed using $\Delta P_0$ instead of $\Delta P$. Taking the time derivative of (2.12) returns the following approximation for the original expression given in (2.11):
 \begin{equation} \dot{R}_{RP,0} = \frac{A_0}{\sqrt{ 1 + \dfrac{\tau_{RP,0}^2}{t^2} }}. \end{equation}
 This model interpolates between the linearly increasing velocity expected in the initial stages of the bubble growth ( $\dot {R} \approx \ddot {R} t$) and the constant velocity in the late stages, when the velocity has reached the inertial limit ( $\dot {R} \approx A_0$). This model has been shown to give excellent agreement with the exact solution (Avdeev Reference Avdeev2016, p. 58).
2.3.1. Full inertio-thermal model
Using this simple model for the evolution of the bubble's radius, we can now develop a new model for the instantaneous velocity of the bubble  $\dot {R}_{RP,i}$, accounting for the change in pressure as the bubble grows. As Avdeev (Reference Avdeev2016, pp. 55–58) did for constant pressure, we interpolate between the early and late stages of growth. In the early stages of growth, for $t\ll \tau _{RP}$, the radial velocity is given as $\dot {R} = \ddot {R} t = At/\tau _{RP}$. Similarly, in the late stages of growth, for $t\gg \tau _{RP}$, the radial velocity is given by $\dot {R} = A$. Interpolating between these values gives us
 \begin{equation} \dot{R}_{RP,i} = \frac{A}{\sqrt{ 1 + \dfrac{\tau_{RP}^2}{t^2} }}, \end{equation}
which describes the acceleration of the bubble from rest to its limiting value  $A$, with a time scale of $\tau _{RP}$ (as opposed to $A_0$ and $\tau _{RP,0}$, respectively, in (2.13)). Note it is the term in the denominator that ensures the bubble velocity starts from zero, which is missing from (2.3) and therefore the MRG model (2.9). Equation (2.14) is equivalent to allowing the pressure to change over time in the velocity expression calculated from (2.13).
Following Mikic et al. (Reference Mikic, Rohsenow and Griffith1970), we substitute the instantaneous pressure difference from (2.8) into our new inertial growth equation (2.14), and treat the radial velocity terms as equivalent. We then obtain the following expression:
 \begin{equation} \dot{R} = \sqrt{\frac{A_0^2}{1 + \frac{\tau_{RP,0}^2}{t^2\left( \displaystyle 1-\dfrac{2\sqrt{t}}{B}\dot{R} \right)}} \left( \displaystyle 1-\dfrac{2\sqrt{t}}{B}\dot{R} \right)}, \end{equation}
where  $A_0^2( 1-({2\sqrt {t}}/{B})\dot {R} ) = A^2$ and ${\tau _{RP,0}^2}/{( 1-({2\sqrt {t}}/{B})\dot {R} )}=\tau _{RP}^2$, from (2.3) and (2.4), respectively. Here, we switch from $\dot {R}_{RP}$ to $\dot {R}$ to equate the radial velocity terms, as was done with the MRG model. This expression accounts for the thermal effects on both the inertial-limiting velocity $A$ and on the inertial time scale $\tau _{RP}$. Rearranging (2.15) gives a cubic expression in $\dot {R}$
 \begin{equation} \frac{2\sqrt{t}}{B} \dot{R}^3 + \left(\frac{4A_0^2t}{B^2} -1 -\frac{\tau_{RP,0}^2}{t^2}\right)\dot{R}^2 -\frac{4A_0^2\sqrt{t}}{B}\dot{R} +A_0^2 = 0, \end{equation}
which can be solved analytically using Cardano's formula. The solution to equation (2.16) is what we refer to as the full inertio-thermal (FIT) model. While it can be shown that the three roots to equation (2.16) are real through discriminant analysis, the roots can only be expressed in a complex form (details in the supplementary material). For the case of  $\tau _{RP,0} = 0$, corresponding to the velocity initially having a value equal to the inertial limit, the roots of the equation are exactly the PZ model (2.5), the rejected negative result from the MRG derivation and the MRG model (2.9), respectively. As the FIT model presents as a complex equation, we can alternatively find approximations to the solutions of (2.16), which are less accurate than the FIT, but potentially more useful. These approximations further allow us to include the effects of capillarity and viscosity, which are not accounted for in (2.14).
2.3.2. Approximate inertio-thermal model
If we return to the derivation of (2.13), the assumption of constant pressure difference manifests in the integral (Avdeev Reference Avdeev2016, p. 55)
 \begin{equation} \int_0^t \frac{A}{R_0} {\rm d}t \approx \frac{3t}{2\tau_{RP,0}}. \end{equation}
If we substitute the integral from (2.17) into (2.12) rather than the approximated value, we retrieve an expression for the radius of the bubble with a time-varying pressure
 \begin{equation} R = \frac{R_0}{3} + \frac{2R_0}{3}\sqrt{ 1 + \left(\frac{\displaystyle 3\int_0^t \dfrac{A}{R_0} {\rm d}t}{2} \right)^2 }. \end{equation}
Taking the time derivative of (2.18) gives us an approximation for the radial velocity with varying pressure
 \begin{equation} \dot{R}_{RP,i} = \frac{A}{\sqrt{ 1 + \left(\frac{\displaystyle 2}{\displaystyle3\int_0^t \dfrac{A}{R_0} {\rm d}t} \right)^2}}. \end{equation}
 Taking  $A=A_0\sqrt {1-({2\sqrt {t}}/{B})\dot {R}}$ as before, the integral term in (2.19) can be approximated by taking a Taylor series expansion around $t=0$ giving
 \begin{align} \int_0^t \frac{A}{R_0} {\rm d}t = \frac{A_0}{R_0} \int_0^t \sqrt{1-\frac{2\sqrt{t}}{B}\dot{R}} \,{\rm d}t = \frac{A_0}{R_0} \left( t - \frac{2t^{3/2}\dot{R}(0)}{3B} - \frac{t^2\dot{R}(0)^2}{4B^2} + O(t^{5/2}) \right). \end{align}
Evaluating this approximation for the initially static case  $\dot {R}(0)=0$ and ignoring the higher-order terms lets us approximate equation (2.19) as
 \begin{equation} {\dot{R}} = \frac{A_0\sqrt{1-\dfrac{2\sqrt{t}}{B}\dot{R}}}{\sqrt{ 1 + \dfrac{\tau_{RP,0}^2}{t^2}}}. \end{equation}
Solving this expression for  $\dot {R}$ gives
 \begin{equation} \dot{R}_{AIT} = \frac{A_0}{\sqrt{1 + \dfrac{\tau_{RP,0}^2}{t^2}}}\left[\sqrt{\frac{A_0^2}{B^2\left(1 + \dfrac{\tau_{RP,0}^2}{t^2}\right)}t+1}-\sqrt{\frac{A_0^2}{B^2\left(1 + \dfrac{\tau_{RP,0}^2}{t^2}\right)}t}\right], \end{equation}
which we will refer to as the approximate inertio-thermal (AIT) model. Alternatively, rather than the above process, we can directly replace the inertial-limiting velocity  $A_0$ in the MRG model (2.9) with the instantaneous velocity from (2.14), which again gives (2.22).
The AIT accounts for the need for the bubble to have grown (and phase change to have occurred), in order for the temperature gradient to form in the liquid. We can rewrite the AIT model more generally in terms of the instantaneous velocity predicted by the constant pressure RP model equation (2.13),  $\dot {R}_{RP,0}$, as
 \begin{equation} \dot{R}_{AIT}= \dot{R}_{RP,0}\left[\sqrt{\frac{\dot{R}_{RP,0}^2}{B^2}t+1}-\sqrt{\frac{\dot{R}_{RP,0}^2}{B^2}t}\right]. \end{equation}
This allows us to include the effects of capillarity and viscosity in our model through the calculation of the inertial velocity  $\dot {R}_{RP,0}$ directly from (2.2). This is achieved in our case by numerically calculating the value using a Runge–Kutta ordinary differential equation (ODE) solver.
The AIT model offers us a clearer insight into the coupling of inertial and thermal effects in the growth of vapour bubbles. We can now see how the inertial growth of the bubble causes the heat transfer behaviour to change. As the bubble accelerates, a greater heat transfer rate is required to maintain the growth, slowing down the bubble's velocity. Similarly, the model captures how, in the absence of significant inertial effects, the time scale for thermal diffusion controlled growth can be significantly increased. Most importantly, the effects of surface tension and viscosity can be included in the AIT model by explicitly calculating the value of  $\dot {R}_{RP,0}$ from (2.2) (note that this is not possible in the FIT model). Using this model we can now better understand the coupled inertia and thermal diffusion effects on the growth of vapour bubbles when capillarity and viscosity are relevant.
2.3.3. Simple inertio-thermal model
In cases when the ratio of the inertial time scale  $\tau _{RP}$ (2.4) to the thermal time scale $\tau _{MRG}$ (2.10) is low i.e. for $\tau _{RP}/\tau _{MRG} <1$, inertial effects occur on a faster time scale than thermal effects, allowing them to be treated as independently changing parameters. This allows further simplification of the AIT model as the bubble will have approached its inertial-limiting velocity before thermal effects on growth are significant, giving
 \begin{equation} \dot{R}_{SIT} = \frac{\dot{R}_{RP,0} \dot{R}_{MRG}}{A_0}. \end{equation}
We call (2.24) the simple inertio-thermal (SIT) model. As with the AIT model, when  $t\gg \tau _{RP,0}$ the effect of changing inertia can be disregarded in the SIT model as well. In addition, when $t\ll \tau _{MRG}$, the $\tau _{RP,0}/t$ terms in (2.22) can be disregarded, justifying the simplification in (2.24). Again, capillary and viscous effects can be included by explicitly calculating the instantaneous inertial velocity term $\dot {R}_{RP,0}$ from (2.2). In general, we can perform this simplification and use the SIT model whenever $\tau _{RP}<\tau _{MRG}$.
The FIT, AIT and SIT models, from (2.16), (2.22) and (2.24), respectively, represent a new class of inertio-thermal models for vapour bubble growth. For the cases with  $\tau _{RP}<\tau _{MRG}$, the SIT model can be used, as inertial and thermal effects occur on different time scales. For $\tau _{RP}>\tau _{MRG}$, the AIT model should be used, as it captures the interaction between inertial and thermal effects. The FIT can be used for all time scale ratios, but only in the absence of viscous and capillary effects. An analysis of the agreement of the three models has been presented in the SI, highlighting the poor agreement of the SIT model for $\tau _{RP}>\tau _{MRG}$, but an improved agreement for $\tau _{RP}<\tau _{MRG}$.
3. Model validation
3.1. In the absence of viscous and capillary effects
We can quantify the effect of capillarity through the ratio of the bubble's initial radius to the critical radius  $\mathcal {R} = R_0/R_c$. The effect of viscosity can be quantified by the Reynolds number, $Re = A_0R_0\rho _l/\mu$. We would expect the capillary and viscous effects to be greater for lower values of $\mathcal {R}$ and $Re$, respectively. In the absence of viscous and capillary effects, we would expect our inertio-thermal model to deviate most from the MRG model predictions when the thermal time scale is smaller than the inertial, i.e. $\tau _{RP}/\tau _{MRG}>1$. The experiments of Florschuetz et al. (Reference Florschuetz, Henry and Khan1969) meet this criterion as $\tau _{RP}/\tau _{MRG}\approx 42.5>1$. The effects of capillarity and viscosity can be neglected for this case as $\mathcal {R}\approx 60$ and $Re\approx 1700$.
The predictions of the MRG (2.9) and inertio-thermal (IT) models are compared with the data in Florschuetz et al. (Reference Florschuetz, Henry and Khan1969) in figure 1(a). We can see from the figure that the IT models better describe the early stages of the bubble's growth. The initial inertial velocity predicted by the MRG model overpredicts the actual growth rate. In the latter stages of the bubble's growth, the velocities predicted by both models converge to the limiting value of the PZ model. Therefore, in the absence of viscous and capillary effects, the MRG model overpredicts the experimental data overall, while the IT model predictions (which lie on top of each other) are more accurate. In this case, we see good agreement between all three IT models, as there are no effects of capillarity or viscosity.

Figure 1. Comparisons of the predictions of the MRG and our IT models with the experimental work of (a) Florschuetz et al. (Reference Florschuetz, Henry and Khan1969), and (b) Dergarabedian (Reference Dergarabedian1953). Note the symbol  $\gamma$ in (b) represents the inclusion of surface tension in the calculation of the AIT and SIT models.
It is worth noting that the results reported by Florschuetz et al. (Reference Florschuetz, Henry and Khan1969) were for reasonably isolated bubbles that nucleated in the bulk liquid. This ensured that the thermal boundary layer of the bubble was not disrupted by the presence of other bubbles or the walls of the test vessel during the measurement period. In contrast to Lien (Reference Lien1969), where the maximum disruption to the thermal boundary layer was expected in the early stages of growth due to the electrodes used caused the bubble nucleation, Florschuetz et al. (Reference Florschuetz, Henry and Khan1969) nucleated bubbles on natural nucleation sites in the bulk liquid. In this case, the greatest deviation from theory is expected in the later stages of growth, when the bubble has grown sufficiently large for its thermal boundary layer to interact with the surroundings. For this reason, we can attribute the disagreement of the early stage experimental results and the MRG model to the limiting inertia and not the presence of other bubbles or walls.
3.2. The effect of capillarity
Capillary effects become important in determining the growth of bubbles when they are close to the critical size. In these cases, the available hydrodynamic pressure in the bubble is reduced by the Laplace pressure across the interface. Both numerical (Lee & Merte Reference Lee and Merte1996; Robinson & Judd Reference Robinson and Judd2004) and experimental (Dergarabedian Reference Dergarabedian1960) studies have focused on the growth of critically sized bubbles. One of the earliest such studies was that of Dergarabedian (Reference Dergarabedian1953), who experimentally measured the growth of vapour bubbles at low superheats. The case shown in figure 1(b) is of the growth of a water vapour bubble at a superheat of  $\Delta T = 3.1 \ {\rm K}$. The bubble is grown from close to the critical radius, with $\mathcal {R} \approx 1.05$. The effect of viscosity can be neglected as $Re \approx 100$. The SIT model (with capillary effects included, shown as ${\rm SIT} + \gamma$ in figure 1b) can be used to predict the bubble growth here, as $\tau _{RP}<\tau _{MRG}$ ( $\tau _{RP} \approx 2.3 \ \mathrm {\mu }{\rm {s}}$ and $\tau _{MRG} \approx 5.3 \ \mathrm {\mu }{\rm s}$). The SIT model allows us to use the exact inertial velocity, calculated from numerically integrating the RP equation (2.2), which includes the effects of capillarity, using a Runge–Kutta ODE solver. We can see from figure 1(b) that the SIT curve provides better agreement with the experimental data than the MRG model, most notably during the earlier stages of growth. The AIT model (with capillary effects included, shown as ${\rm AIT} + \gamma$ in figure 1b) also provides good agreement for the growth of the bubble, predicting a slightly higher radius than the SIT model. The FIT model, which does not include capillary effects, does not show the same level of agreement. In this case, when capillarity dominates the early stage growth behaviour, the FIT model predicts bubble radii noticeably closer to those of the MRG model than the AIT and SIT models.
Again, as with the case in figure 1(a), the effects of surrounding bubbles and the walls of the experimental container are deemed negligible in their effect on the experimental results as their distances are significantly greater than the thermal boundary layer thickness  $\delta _T$, which we can approximate as $\delta _T = \sqrt {\alpha t} \approx {R}/{2Ja}$ (Dergarabedian Reference Dergarabedian1953). This allows us to attribute the decreased growth rate in the early stages of growth to the limiting inertia, rather than limited thermal diffusion due to the disruption of the boundary layer (Enríquez et al. Reference Enríquez, Sun, Lohse, Prosperetti and Van Der Meer2014).
Numerical modelling of the growth of sodium bubbles was performed by Dalle Donne & Ferranti (Reference Dalle Donne and Ferranti1975) who coupled the energy and RP equations directly, and solved them with a Runge–Kutta solver. Prosperetti & Plesset (Reference Prosperetti and Plesset1978) additionally included the thin thermal boundary layer assumption of Plesset & Zwick (Reference Plesset and Zwick1954) to simplify the energy equation. These bubbles are initiated at close to their critical size, and capillary effects therefore play a significant role in the dynamics of the bubbles.
Figure 2 tracks the bubble radius  $R$ for cases representing (a) high, (b) moderate and (c) low superheats, respectively, compared with the MRG and IT model predictions. We can see from these plots that the AIT and SIT models, with capillary effects included, provide better agreement with the numerical data across the range of superheats. During the early stages of the bubble growth, the MRG model fails to capture the acceleration of the initially static bubble. This leads to the overprediction of the velocity and, subsequently, the radius of the bubble as seen for each of the three cases in figure 2(a–c). This overprediction does not occur for the AIT and SIT models, which capture these dynamic inertial effects. Little disagreement between the FIT and MRG models is seen due to the strong effects of capillarity in these near critically sized bubbles, which is not included in either model. During the late stages of the bubble growth, the agreement between all our IT models and the MRG model improves, as with previous cases. When the bubble has grown to the point where the dynamic inertial effects have stabilised, the growth is determined entirely by thermal effects. In the case of the low superheat, shown in figure 2(c), some disagreement between the results of Prosperetti & Plesset (Reference Prosperetti and Plesset1978) and the MRG model, and by extension the SIT model, is observed at larger time scales. This is attributed to the invalidity of the thin thermal boundary layer approximation at low Ja where additional terms ignored in the PZ model become important (Plesset & Zwick Reference Plesset and Zwick1954; Avdeev Reference Avdeev2016).

Figure 2. A comparison of the predictions of the MRG and IT models with the numerical studies of (a) high, (b) moderate and (c) low superheats from the work of Prosperetti & Plesset (Reference Prosperetti and Plesset1978), and (d) Robinson & Judd (Reference Robinson and Judd2004).
Robinson & Judd (Reference Robinson and Judd2004) perform similar numerical calculations, investigating the transition from surface tension- to thermally controlled growth of water vapour bubbles across a range of operating conditions. Their analysis shows that the assumptions in the MRG model are invalid at low  $Ja$, showing disagreement with their results for $Ja<10$. This is attributed to the theoretical limits of the PZ model, which is not accurate for $Ja<4$ (Avdeev Reference Avdeev2016). We account for this disparity by considering the changing inertial driving force in our IT models. Figure 2(d) shows vastly improved agreement between the results of Robinson & Judd (Reference Robinson and Judd2004) and the AIT and SIT models when compared with the MRG model for $Ja=9$. When the IT models are compared with each other, there is slightly better agreement visible with the SIT model than the AIT model, which will be elaborated on in the next section. Note that the bubble radius data from Robinson & Judd (Reference Robinson and Judd2004) are offset by the initial radius, and the time data are offset by a thermal time constant, which is the time taken for the system to react to a change in the thermal environment and is given as $t_c = 4\gamma ^2/(9\alpha \Delta P^2)$.
3.3. The effect of viscosity
So far, we have only analysed bubble growth in the absence of viscous effects. Viscosity has been shown to be largely insignificant in many of the cases analysed in literature (Robinson & Judd Reference Robinson and Judd2004), and so is typically not included in numerical investigations (Dalle Donne & Ferranti Reference Dalle Donne and Ferranti1975; Lee & Merte Reference Lee and Merte1996). However, for critically sized bubbles at near-spinodal conditions, viscosity becomes one of the determining factors in the growth rate of the bubble (Avdeev Reference Avdeev2016, p. 63). These conditions are difficult to produce experimentally. The small critical radii near the spinodal mean that it is very likely that a nucleation event will occur in an unplanned location, making it harder to study. Combined with the difficulties of measurement on the length and time scales necessary to capture the bubble growth in sufficient detail, this means that experimental data are not readily available to make comparisons. Thus, to validate our model predictions for bubble growth within this regime, we performed molecular dynamics (MD) simulations (details in the supplementary material).
Our MD simulations allow us to measure the growth of argon vapour bubbles with high spatial and temporal resolution. Simulations were performed with bubbles of initial radius  $5 \ \textrm {nm}$ and $7 \ \textrm {nm}$, each at two operating conditions; temperatures of $130 \ \textrm {K}$ and $135\ \textrm {K}$, and pressures of $0.1 \ \textrm {MPa}$ and $1 \ \textrm {MPa}$, respectively. These cases have Reynolds numbers in the range $Re=2.6\unicode{x2013}4.7$, meaning that viscous effects are of greater importance here than previous cases. The value of
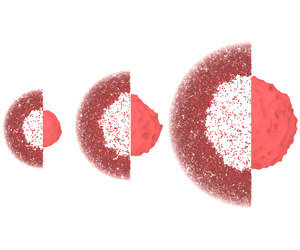
  $\tau _{RP}/\tau _{MRG}$ ranges from 0.01–0.4, permitting the SIT model to be used for these cases. The plots in figure 3 compare the MD results with the predictions of the RP, MRG and IT models. Inset in figure 3(a) is a series of simulation snapshots showing a section of the MD simulation alongside the measured bubble profile and the model predictions. We consistently see that the MRG model overpredicts the initial growth rate. The RP prediction matches the early stage growth rate, but overpredicts at later stages. We can see excellent agreement with the SIT model predictions for the entire timespan for each of the cases, along with reasonable agreement of the AIT model.

Figure 3. Comparison of the predictions of the RP, MRG and IT models with the MD simulations for four different conditions; (a)  $R_0=7 \ \textrm {nm}$, $T = 135 \ \textrm {K}$ and $P =1\ \textrm {MPa}$; (b) $R_0=5 \ \textrm {nm}$, $T = 135 \ \textrm {K}$ and $P =1\ \textrm {MPa}$; (c) $R_0=7 \ \textrm {nm}$, $T = 130 \ \textrm {K}$ and $P =0.1\ \textrm {MPa}$; and (d) $R_0=5 \ \textrm {nm}$, $T = 130 \ \textrm {K}$ and $P =0.1\ \textrm {MPa}$. Inset in (a) is a series of simulation snapshot segments (left) alongside the measured bubble profile and model predictions at times of 0, 0.5 and 1 ns. Note the symbols $\gamma$ and $\mu$ represent the inclusion of surface tension and viscosity, respectively, in the calculation of the AIT and SIT models.
These results imply consistently improved agreement of the SIT model over the AIT model, despite the additional simplifications made in the derivation of the SIT model. From the derivation, we would expect the SIT model to underpredict the radius of the bubble as it predicts a greater cooling of the bubble than the available inertia would allow as the bubble accelerates from rest. However, the linear temperature–pressure relationship used in the derivation of the MRG model, and through it the IT models (i.e. (2.7)) overpredicts the vapour pressure during the growth process (Prosperetti & Plesset Reference Prosperetti and Plesset1978) and has been shown to overpredict bubble radii by up to  $40\,\%$ (Lee & Merte Reference Lee and Merte1996). Therefore, the apparent advantage of the SIT over the AIT only results from the cancellation of these errors, and not due to greater accuracy in modelling capacity (more details on this are given in § S5 of the supplementary material). Both the SIT and AIT models are well within this range of error for the MD cases presented in figure 3, at $15\,\%$ and $20\,\%$ respectively. Meanwhile the error in the MRG model predictions is considerably higher during the early stages of growth, only reducing to an acceptable level as the bubble grows far from its initial size.
The effect of viscosity in isolation can be studied by comparing the predictions of the SIT model with and without viscosity. Plotted in figure 4 is the case from figure 3(a) comparing the SIT model, the SIT model without viscosity (SIT  $\mu =0$), the SIT model without viscosity and capillarity (SIT $\mu =\gamma =0$) and the FIT model with the MD data. We can see from this plot that, in the absence of viscosity and capillarity, the SIT model is quite close to the FIT model. Figure 4 shows how viscosity can be readily included into the AIT and SIT models when needed.

Figure 4. Comparison of the predictions of the SIT model with and without viscosity and capillarity with the MD simulations.
4. Conclusions
Accounting for the changing inertial effects during the growth of an isolated vapour bubble has allowed us to extend the applicability of the existing bubble growth models. We present a new class of IT models that capture the bubble's inertially limited growth from rest, removing the singularity in the acceleration of the bubble that is present in other models. We show excellent agreement with experimental and numerical data from the literature as well as our own molecular simulations.
The FIT model describes the growth of an isolated bubble in the absence of viscous and capillary effects, and will be most applicable for describing the growth of large vapour bubbles, where the effect of viscosity and capillarity is reduced. The AIT model provides an approximate solution to the FIT model, in a manner resembling the MRG model. Despite introducing some predictive errors, it captures the interplay between the thermal and inertial effects, with the effect of thermal diffusion becoming more relevant as the bubble grows from rest. When the time scale ratio between inertial and thermal growth is low, the SIT model can be used. This provides a simple scaling of the velocity but does not account for the interplay between the thermal and inertial effects, treating them as independently changing parameters. We have shown that in certain cases when inertial effects occur on a quicker time scale than the thermal effects, i.e.  $\tau _{RP}<\tau _{MRG}$, the SIT model can give more accurate results than the AIT model despite its simpler form. This improved agreement is likely due to the cancellation of errors introduced in the model derivations (Theofanous & Patel Reference Theofanous and Patel1976) rather than a more accurate modelling of the problem. The exact criterion for when the intrinsic error in the SIT model outweighs the systematic error in the temperature–pressure relationship remains uncertain. However, we hope that this work will motivate further research into this topic and better complete our understanding of the interplay of inertial and thermal effects. The AIT and SIT models have the added advantage that they can include effects such as viscosity and capillarity, which are needed to accurately reproduce bubble growth rates.
It is hoped that this improved understanding of homogeneous vapour bubble growth will lead to improvements in control of bubble systems. As technologies become more precise and more compact, understanding the growth behaviour of the full lifetime of vapour bubbles will become more significant. While there are additional modelling considerations that must be made to better represent these applications, such as the presence of a wall during heterogeneous bubble growth, the IT models presented here represent the most accurate theoretical approach to predict homogeneous vapour bubble growth across all length and time scales.
Supplementary material
Supplementary material is available at https://doi.org/10.1017/jfm.2022.734.
Funding
This work was supported in the UK by the Engineering and Physical Sciences Research Council (EPSRC) under Grant Nos EP/N016602/1, EP/R007438/1 and EP/V012002/1. For the purpose of open access, the authors have applied a CC BY public copyright licence to any Author Accepted Manuscript version arising from this submission. All MD simulations were run on ARCHER and ARCHER2, the UK's national supercomputing service.
Data availability statement
The data that support the findings of this study are openly available in the Edinburgh DataShare repository at https://doi.org/10.7488/ds/3507.
Declaration of interests
The authors report no conflict of interest.


 Open access