


Introduction: Embracing Cellular Diversity
Cell atlasing is an emerging technique for cataloging the identities of individual cells within a tissue, organ, or organism based on molecular phenotype [Reference Regev1]. Despite the name, spatial information has not yet been established as a fundamental component of cell atlasing initiatives. But, as with any map, spatial information is critical. In addition to characterizing cellular diversity, cell atlases should provide information about molecular composition and spatial position; however, until recently, the technology was not available to characterize both simultaneously. Now, high-resolution image-based technology makes capturing molecular and spatial cell atlases accessible.
Why create a cell atlas? These maps represent a crucial step toward understanding how a diverse array of cell types coalesce to achieve a functional organ or body, and how the degradation of that functionality can result in disease. But since organs are made of vast numbers of cells with roughly 70 million neurons in the mouse brain [Reference Herculano-Houzel2], 100 billion in the human brain [Reference Herculano-Houzel3], and billions of cells in any given human organ, creating a comprehensive cell atlas is a massive undertaking. Moreover, while some cell types are common and easy to detect, others are rare and elude all but the highest throughput methods.
Simultaneously cataloging cell transcriptional state, location, and morphology provides more comprehensive insight than characterizing any one of the parameters without the other two. Transcriptional state reveals exactly which genes are being expressed for the cell to perform its biological function. Spatial context illuminates the constant communication and cell-cell interactions that occur between neighboring cells that are essential to the biological function of the tissue. Cell morphology, often related to cell state and function, can reveal subtle details of how cells operate within the tissue.
Because cell atlases represent a map of all cell types within a tissue, these maps make it possible to compare normal and diseased tissue in great detail to identify the cellular origin of the disease pathology. For example, observing molecular changes in microglia cells of an aging brain might reveal the mechanisms of neurodegeneration [Reference Valles4]. This side-by-side comparison of healthy and diseased cell atlases may one day enable researchers to find the underlying causes of complex diseases, syndromes, and even normal states like aging for which there is not a simple genetic or cellular cause that underlies the physiological phenomenon.
How to Build a Cell Atlas
Cell atlases characterize the genome, proteome, transcriptome, metabolome, and metabolic flux of individual cells that make up a tissue [Reference Lee5]. These data can be gathered by a variety of methods, but because a true cell atlas provides both phenotypic and spatial information, methods that do not provide spatial context must be combined with imaging. Popular methods to acquire these data include:
• Single-cell RNA sequencing catalogs huge numbers of cells based on genetic phenotype but destroys the cells before measurement so therefore requires supplemental spatial information for context.
• Protein staining or multiplexed protein imaging yields biologically relevant spatial information, but this information is not quantitative, and multiplexing is typically limited to less than 100 target proteins.
• RNA image-based methods generate images of labeled RNA species within a tissue. This class of methods includes in situ sequencing and fluorescent in situ hybridization (FISH)-based methods. In situ sequencing methods generally involve inefficient enzymatic amplification steps and are not able to measure a large fraction of transcripts in the sample. In contrast, FISH-based methods only involve direct hybridization of probes to the target transcript and can be highly sensitive and quantitative. Of these, multiplexed error-robust fluorescence in situ hybridization (MERFISH) has sufficiently high multiplexing capacity and cell throughput for cell atlas purposes.
FISH Technology Then and Now
The evolution of FISH technology has been about 50 years in the making [Reference Huber6]. At the method's core, fluorescent probes are constructed to bind specifically to a target RNA transcript. The probes are then hybridized to fixed tissues and imaged with a fluorescence microscope. The original FISH implementations revealed the expression patterns of RNA expression for one or a few genes across a tissue in a manner very similar to immunofluorescence. Then, in 1998, Singer et al. published a report in Science describing a higher-resolution and more quantitative version of the method: single molecule FISH (smFISH). This new method enabled researchers to observe the position of individual RNA molecules within single cells [Reference Femino7]. smFISH is incredibly sensitive and quantitative because it uses multiple probes for each individual target RNA so that each molecule is then sufficiently bright to be observed and localized with a high-resolution microscope (Figure 1). However, it was originally low gene throughput and therefore not amenable to producing a cell atlas.

Figure 1: Schematic of smFISH (left) and a fluorescence image from a smFISH measurement (right). smFISH enables direct quantification of the number of transcripts expressed in each cell by multiply tiling fluorescent probes to the target transcript and imaging with a high-resolution fluorescent microscope. Under the microscope, each transcript appears as a single point, and by counting the points the number of copies is directly quantified. The small blue circles in the diagram represent fluorescent dyes, and the colored lines indicated different RNA species. MERFISH expands on smFISH by allowing hundreds to tens of thousands of genes to be quantified simultaneously.
Subsequently, in 2015, Harvard professor Xiaowei Zhuang greatly expanded the multiplexing capacity of smFISH by combining it with a massively multiplexed barcoding scheme, creating MERFISH [Reference Chen8]. Because MERFISH combines the sensitivity of smFISH while dramatically increasing the number of genes that can be measured in a single sample, it is a powerful tool for cell atlas projects. A single MERFISH experiment can analyze hundreds of thousands of cells and quantify hundreds of millions of RNA transcripts (Figure 2). This astronomical volume of data can then be processed to characterize the transcript expression, cell morphology, spatial coordinates of cells, cell type, cell state, and cell-cell interactions across a full biological sample. Furthermore, MERFISH's robust experimental design requires no intermediate steps that could cause bias in transcript detection, such as enzymatic amplification. This gives MERFISH an unparalleled target detection efficiency of 95 percent in cell culture [Reference Moffitt9] and 70 percent in tissue [Reference Wang10].

Figure 2: A MERFISH measurement across a full mouse brain coronal slice (top), where transcripts are shown as colored dots that represent various RNA species. MERFISH measures hundreds to thousands of genes across large tissue slices with single-molecule resolution. Any region in the output data can be zoomed in (red square in the center image) to achieve cellular resolution (bottom image).
Compelling studies of the brain have showcased how MERFISH can be used to illuminate the rich cellular heterogeneity and organization this organ is known for. In 2018, Moffitt et al. used MERFISH, in combination with single cell-RNA sequencing, to map the identities and locations of over 70 cell types in the mouse preoptic hypothalamus [Reference Moffitt11]. While the region was known to house cell types that play roles in phenomena including sleep, social behavior, and homeostatic function, the significance of the structural organization of these cells was not understood. By creating cell-by-cell profiles of gene expression informed by spatial context, the researchers began to understand how different cell types within the hypothalamic preoptic region are organized to form behavior circuits underlying many behavioral phenomena, and they were even able to characterize which populations of neurons become active during different mouse behaviors.
More recently, in a 2020 preprint, Wang et al. used MERFISH to conduct quantitative, high-resolution spatial profiling of ~4,200 RNA species within mouse hippocampal neurons to form a cell atlas of the distinct transcriptomic regions inside individual neurons [Reference Wang10]. The authors detected approximately 11,000 RNA molecules per cell and found that cell bodies, axons, dendrites, and even smaller dendritic regions, had their own distinct transcriptional profiles. This likely contributes to their relatively autonomous nature in the brain. Overall, this cell atlas will serve as a quantitative resource for future studies of localized functions within neurons.
The Future of MERFISH
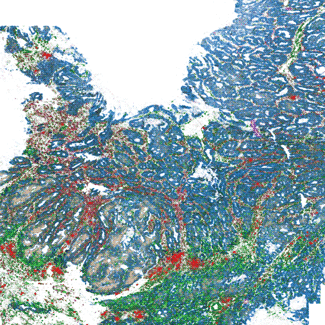
Using MERFISH to explore the brain is just the beginning. This technology is a tool for a new generation of genomic discovery that not only distinguishes cell types within a tissue sample but also identifies functionally distinct regions within individual cells. MERFISH studies are already contributing to our understanding of what defines a cell's identity, and results hint at how immensely nuanced and complex this definition will be (Figure 3). MERFISH-generated cell atlases may help researchers address a wide array of questions spanning from the determination of cell fate and organization during development to the regulation of gene expression in cells during aging, disease, and even drug treatment. MERFISH technology is also capable of exploring how environmental context can alter otherwise-identical cells; for example, to examine how different oxygen and nutrient levels experienced by the two poles of the human liver have resulted in liver cells with distinct phenotypes. Overall, as MERFISH becomes more widespread, it will prove to be a highly efficient and versatile tool to interrogate the inner workings of biology on a cell-by-cell level. As researchers explore more high-resolution spatial and phenotypic data, they'll map out uncharted regions and shed light on new unknowns with every experiment.

Figure 3: A MERFISH measurement of 417 genes across a human colon cancer sample. IGHA1 expression (red) depicts the infiltration of B cells into the tumor marked by the expression of SOX9 (blue). The other 415 genes reveal the subtle variations in cell type and cell state across the tumor.


