


There is a common belief that breakfast is the ‘most important meal of the day’( Reference Rampersaud, Pereira and Girard 1 ). However, about one-third of young people, including children (pre-pubertal and typically <11 in girls and <13 years in boys) and adolescents (between puberty and adulthood)( Reference Tanner, Whitehouse and Marshall 2 ), in many countries skip breakfast regularly( Reference Vereecken, Dupuy and Rasmussen 3 , Reference Zakrzewski, Gillison and Cumming 4 ). Cross-sectional reports that show infrequent breakfast consumption to be associated with overweight and obesity have led to premature assumptions that breakfast can be used as an intervention for weight loss( Reference Brown, Bohan Brown and Allison 5 ). Indeed, the lower adiposity status in children who frequently consume breakfast was not observed uniformly across twelve countries( Reference Zakrzewski, Gillison and Cumming 4 ). Thus, the strength, direction and causal nature of associations between breakfast frequency and adiposity are questionable.
The mechanistic basis for a causal link between breakfast frequency and adiposity may be examined by assessing energy intake (EI) and expenditure. Indeed, a sustained positive energy balance where EI exceeds energy expenditure causes weight gain( Reference Hill 6 ). Despite their higher adiposity, young people who skip breakfast have lower( Reference Deshmukh-Taskar, Nicklas and O’Neil 7 , Reference Sjöberg, Hallberg and Höglund 8 ) or similar( Reference Dubois, Girard and Potvin Kent 9 ) daily EI when compared with breakfast consumers. Interventions show that 1 d of breakfast omission did not increase subsequent EI to compensate for the energy deficit created by breakfast omission in children aged 8–10 years( Reference Kral, Whiteford and Heo 10 ) and in adolescents aged 13–17 years( Reference Leidy and Racki 11 ). Increased lunchtime EI has, however, been reported in men in response to 1 d of breakfast omission( Reference Clayton, Barutcu and Machin 12 ). Under free-living conditions, adults generally show higher daily EI when breakfast is consumed( Reference Reeves, Huber and Halsey 13 , Reference Betts, Richardson and Chowdhury 14 , Reference Yoshimura, Hatamoto and Yonekura 15 ), even when reductions in EI at lunch( Reference Yoshimura, Hatamoto and Yonekura 15 ) or between 12.00 and 18.00 hours( Reference Reeves, Huber and Halsey 13 ) are observed. However, daily EI was similar in obese adults assigned to daily breakfast omission or consumption for 6 weeks( Reference Chowdhury, Richardson and Holman 16 ). In overweight and obese ‘breakfast-skipping’ females aged 15–20 years, daily EI was increased with normal-protein breakfast consumption, but a high-protein breakfast reduced evening snacking and did not increase daily EI( Reference Leidy, Ortinau and Douglas 17 ). In a similar mixed-sex sample, 12 weeks of high-protein breakfast consumption reduced free-living daily EI, whereas breakfast skipping and normal-protein breakfast consumption did not( Reference Leidy, Hoertel and Douglas 18 ). However, these studies were based on young people accustomed to breakfast omission and only determined the impact of breakfast addition, not removal( Reference Leidy, Ortinau and Douglas 17 , Reference Leidy, Hoertel and Douglas 18 ).
When determining free-living EI via self-report in adolescents, compliance and underreporting are major challenges( Reference Boushey, Kerr and Wright 19 ). Adolescents report a preference for methods using technology, such as a disposable camera( Reference Boushey, Kerr and Wright 19 ), which eliminate the need for participants to estimate portion size and are less burdensome than weighed food diaries( Reference Martin, Nicklas and Gunturk 20 , Reference Wang, Kogashiwa and Kira 21 ). Digital photography methods have been validated against weighed food diaries and 24 h recall in adults( Reference Wang, Kogashiwa and Kira 21 ) and are reliable and valid when measuring children’s food intake in cafeteria settings( Reference Martin, Newton and Anton 22 ). However, understanding the individual variation in free-living EI assessed using digital photography requires investigation to determine clinically meaningful intervention effects( Reference Atkinson and Batterham 23 ).
In addition to EI, physical activity (PA) is a key determinant of energy balance, weight gain and health( Reference Hill 6 , Reference Janssen, Katzmarzyk and Boyce 24 ). Cross-sectional studies using objective measures of PA (e.g. accelerometry) have reported more frequent breakfast consumption to be associated with higher PA in girls but not boys( Reference Corder, van Sluijs and Steele 25 ), or in boys but not girls( Reference Vissers, Jones and Corder 26 ), or on weekends but not weekdays( Reference Corder, van Sluijs and Ridgway 27 ). In lean( Reference Betts, Richardson and Chowdhury 14 ) and obese( Reference Chowdhury, Richardson and Holman 16 ) adults assigned to 6 weeks of daily breakfast consumption or omission, higher PA energy expenditure in the morning was shown in the breakfast consumption groups, and this resulted in increased total daily PA energy expenditure in the lean adults( Reference Betts, Richardson and Chowdhury 14 ). In support, an acute within-participant cross-over study showed increased morning PA energy expenditure assessed via accelerometry when breakfast was consumed compared with when it was omitted in women( Reference Yoshimura, Hatamoto and Yonekura 15 ). However, another study using pedometers and heart rate monitors showed no effect( Reference Halsey, Huber and Low 28 ). Furthermore, it is not known whether consuming breakfast can increase PA in young people.
The adolescent period is a crucial time to promote dietary and PA behaviours for health, particularly in girls( Reference Todd, Street and Ziviani 29 ). Furthermore, breakfast skipping is highly prevalent in this population( Reference Timlin, Pereira and Story 30 ). Thus, the current study used a randomised, cross-over design to compare the effect of three consecutive weekdays of breakfast omission with standardised breakfast (SB) consumption on free-living EI and PA in girls aged 11–15 years. In a sub-sample, we examined the natural variability in free-living daily EI assessed using digital photography to determine the interindividual intervention response.
Methods
Participants
In this dual centre project, forty-nine girls aged 11–15 years were recruited from schools in the two locations in England. The study was conducted according to the guidelines laid down in the Declaration of Helsinki and all procedures involving human subjects/patients were approved by the respective University Research Ethics Committees. Written informed parental consent and child assent were obtained for all participants. Girls were excluded from the study if they had health related issues identified from a health screen questionnaire (e.g. allergies to the breakfast meals, fitted with a pacemaker) or were unable to walk or wear a PA monitor on their wrist.
Preliminary measurements
Stature was measured to the nearest 0·01 m using a portable Leicester height measure (SECA Corporation). Body mass was measured and percent body fat estimated to the nearest 0·1 kg and 0·1 % respectively using a Tanita Body Composition Analyser (BC-418 MA; Tanita Corporation); subsequently, BMI was calculated as body mass divided by stature squared (kg/m2). Using age and sex-specific BMI centiles( Reference Cole, Freeman and Preece 31 ), the girls were then classified as non-overweight (2nd to 85th centile) or overweight (85th to 95th centile). Waist circumference was measured to the nearest millimetre on exhalation at the midpoint between the last rib and top of the iliac crest using a non-elastic tape measure( Reference McCarthy, Jarrett and Emmett 32 ). To describe the pubertal status of the study sample, the girls were asked to provide a validated( Reference Brooks-Gunn, Warren and Rosso 33 , Reference Morris and Udry 34 ) self-assessment of their physical maturation using secondary sexual characteristics with the assistance of a primary home-based carer( Reference Tanner 35 ). Habitual breakfast frequency was assessed by asking participants the following question: ‘How often do you usually have breakfast?’ Participants were asked to indicate their response separately for weekdays and for weekend days. Response categories were ‘never’ to ‘5 d’ for the week, and ‘never’ to ‘2 d’ for the weekend. To provide an indication of the composition and energy content of the participants’ habitual breakfasts, they recorded their breakfast intakes across 3 d (Tuesday, Wednesday and Thursday, i.e. the weekdays selected for the intervention described below) using digital photography and a written food diary. Breakfast EI and macronutrient intakes were calculated using Dietplan 6.7 (Forestfield Software).
Experimental design
Using a within-measures cross-over design, participants completed two, 3-d conditions in a counter-balanced order: no breakfast (NB) and SB. The conditions were conducted across the same three weekdays (i.e. Tuesday, Wednesday and Thursday) with either a 4- or an 11-d washout between conditions. For the duration of each 3-d condition, participants were asked to record their diet and wear a wrist-worn accelerometer. The order of the conditions for each participant was produced using a computer-based random number generator by the principal investigator (J. K. Z.-F.). All data were collected between December 2013 and July 2014.
On each morning of each 3-d condition, participants arrived at school in the fasted state (no food or drink consumed except water from 21.00 hours the previous day) and were asked not to eat breakfast (NB) or to consume the SB provided within 30 min (between 08.15 and 08.45 hours). For NB, participants were provided with 375 ml of water. The participant’s first opportunity to consume food or drink during the post-breakfast period was 10.30 hours (i.e. during school break time); thus, NB involved abstaining from energy-containing food and beverages between 21.00 hours the previous day and 10.30 hours the following morning. The participants were reminded on each day of the experimental conditions to refrain from snacking until 10.30 hours and reported that they complied with these instructions. The SB consisted of 56·3 g wheat biscuits (Weetabix), 188 ml semi-skimmed milk (Tesco Stores Ltd) and 375 ml orange juice (Tesco Stores Ltd). The breakfast was low glycaemic index (GI), with a calculated GI of 54( Reference Atkinson, Foster-Powell and Brand-Miller 36 , Reference Wolever and Jenkins 37 ). We chose a ready-to-eat cereal because this type of breakfast is associated with reduced obesity risk when compared with ‘other breakfasts’( Reference Deshmukh-Taskar, Nicklas and O’Neil 7 ). Recommendations suggest breakfast should be 20 % of daily EI( 38 ) and reviews define breakfast typically as containing 20–35 % of total daily energy needs( Reference Timlin and Pereira 39 ). Therefore, the SB contained 2092 kJ (500 kcal), equating to approximately 22–26 % of daily energy requirements for 11–15-year-old girls, which take into account total daily energy expenditure plus the deposited energy costs for growth (8096–9594 kJ/d (1935–2293 kcal/d))( 40 ). The SB was consumed at school rather than home to monitor compliance to the breakfast intervention and record any leftovers. If the SB was not consumed completely, it had to represent at least 20 % of recommended daily EI for the participant to be included in the final sample( 38 ).
Dietary assessment
Participants recorded their daily diet using a digital camera (ViviCam 46; Vivitar) and food diary during each condition. A similar method has been validated previously in adults( Reference Wang, Kogashiwa and Kira 21 ) and children( Reference Martin, Newton and Anton 22 ). The participants were asked to photograph all foods and beverages consumed and use the photographs as a recall method when completing their food diaries each evening. The food diaries included a record of the day, time, type, brand name, preparation method, estimated portion size and any leftovers of all food and drink consumed. Before completing the main conditions, the girls received a tutorial and written instructions on using the digital camera and food diary. On the morning after each day of dietary recording, the research team checked the participants’ food diaries for completeness and cross-referenced the food diaries with the corresponding photographs. For missing photographs, portion size was estimated by the participants using the Young Person’s Food Atlas( Reference Foster, Adamson and Hawkins 41 , Reference Foster and Adamson 42 ) with assistance from the research team; further details were added to the diary when appropriate. The mass of all foods and beverages consumed were estimated by comparing the digital photographs, taken by the participants, with the Young Person’s Food Atlas( Reference Foster, Adamson and Hawkins 41 , Reference Foster and Adamson 42 ); this method has shown good agreement with weighed food diaries in children aged ≥11 years( Reference Foster, Hawkins and Barton 43 ). Food diaries were analysed using Dietplan 6.7 to estimate EI and macronutrient intakes, which were blocked into three time periods to separate breakfast, lunch and the evening meal and align with the school timetable: (i) 06.00–09.00 hours (including breakfast and early morning snacks), (ii) 10.30–14.00 hours (including school break time snacks and lunch) and (iii) 14.00 until 21.00 hours (including dinner and evening snacks). Percentage breakfast EI compensation was calculated for SB relative to NB (i.e. the difference in post-breakfast EI between SB and NB divided by SB breakfast EI multiplied by 100); values of 100 % indicated complete compensation for breakfast EI. Portions of fruit and vegetable consumed were quantified using the National Health Service guidelines for 5 portions/d( 44 ). High-fat and sugary snacks were defined as sweet baked products, cookies, ice cream, cakes, desserts, jams, sugar, sweets, nuts, potato crisps, cheese products, popcorn and soft drinks( Reference Sjöberg, Hallberg and Höglund 8 ).
Variability of daily energy intake
To determine the natural variability of daily EI, the primary outcome variable, a sub-sample of ten girls completed two, 3-d free-living diet (FD) conditions on 2 consecutive weeks at least 4 weeks before commencing the main study. On each day, the girls were free to eat and drink as they pleased and were instructed to record their dietary intakes using the digital photography and food diary method described above (see the ‘Dietary assessment’ section ). Thus, the data provided an indication of the variability in habitual dietary intakes between two 3-d periods rather than being an assessment of measurement reliability. The 95 % limits of agreement (LoA) for daily EI were calculated by determining a 95 % limit above and below the mean difference for FD trial 1 and FD trial 2 (systematic error (1·96×random error)), as outlined by Bland & Altman( Reference Bland and Altman 45 ). Student’s paired t tests were used to identify systematic change in the mean from trial one to two; whereas Pearson’s product moment correlations between the paired residuals and the mean (proportional error check) and the absolute residuals and the mean (heteroscedasticity check) were examined to ensure the 95 % LoA were representative of the whole sample. It has been estimated that excessive weight gain could be prevented in children and adolescents by reducing positive energy balance by 628 kJ/d (150 kcal/d)( Reference Wang, Gortmaker and Sobol 46 ). Therefore, we deemed that LoA of ≤±628 kJ/d (150 kcal/d) would be an acceptable test–retest error for daily FD EI.
The data on variability of EI was also used as a control arm to quantify the true interindividual differences in the EI response to the breakfast intervention(
Reference Atkinson and Batterham
23
). To determine a ‘true’ effect, Atkinson & Batterham(
Reference Atkinson and Batterham
23
) suggest comparing the sd of changes in the intervention arm (i.e., the effect sd) with the sd of changes from the control arm (i.e. the control sd). The sd of the true individual response is: $\sqrt {( {{\scriptstyle SD}_{{\rm e}}^{\,\,\,2} {\minus}{\scriptstyle SD}_{{\rm c}}^{\,\,\,2} } )} $
, where
sd
e is the effect sd and
sd
c is the control sd
(
Reference Atkinson and Batterham
23
). The magnitude of the sd of true individual responses is appraised in terms of clinical importance. As with our LoA analysis, we deemed that a difference of ≥±628 kJ/d (150 kcal/d) would be clinically important when comparing the control and intervention SD(
Reference Wang, Gortmaker and Sobol
46
).
$\sqrt {( {{\scriptstyle SD}_{{\rm e}}^{\,\,\,2} {\minus}{\scriptstyle SD}_{{\rm c}}^{\,\,\,2} } )} $
, where
sd
e is the effect sd and
sd
c is the control sd
(
Reference Atkinson and Batterham
23
). The magnitude of the sd of true individual responses is appraised in terms of clinical importance. As with our LoA analysis, we deemed that a difference of ≥±628 kJ/d (150 kcal/d) would be clinically important when comparing the control and intervention SD(
Reference Wang, Gortmaker and Sobol
46
).
Physical activity assessment
Wrist-worn accelerometers that have been validated in 8–14 year olds (GENEActiv; Activinsights Ltd) were used to assess PA for the duration of each 3-d condition( Reference Phillips, Parfitt and Rowlands 47 ). The accelerometers were set to record at 85·7 Hz using a 1-s epoch. The girls were asked to wear the accelerometers on their non-dominant wrist for 3 d at all times, removing only for bathing and water-based activities. To estimate daily time spent sedentary and in light PA (LPA) and moderate-to-vigorous PA (MVPA), GENEActiv cut-points specific to 8–14 year olds were applied and expressed as percentage of total daily wear time( Reference Phillips, Parfitt and Rowlands 47 ). The minimal amount of accelerometer data that were considered acceptable was 10 h/d of wear time on all 3 d of both breakfast conditions( Reference Rowlands, Rennie and Kozarski 48 ).
Statistical analyses
Statistical analyses were completed using IBM SPSS statistics software for Windows version 21 (IBM Corporation). Total daily EI, macronutient intakes and PA were compared between the two conditions using student’s paired t tests. For post-breakfast EI and macronutrient intakes, condition × time of day (2×2) repeated-measures ANOVA were used to examine differences between the conditions across the two time periods (i.e. 10.30–14.00 and 14.00–21.00 hours). Weekday habitual breakfast frequency and BMI were considered as covariates, but were not used because the data did not satisfy the assumptions for covariate analysis (i.e. they were not significantly associated with the dependent variables across all conditions). Homogeneity of covariances were examined by Mauchly’s test of sphericity, and a Greenhouse–Geisser correction was applied to the df if the sphericity assumption was violated. Cohen’s d effect sizes (d) were calculated to gauge the magnitude of differences between conditions for all significant effects. In the absence of published anchors, a d≥0·20 was considered the minimum important difference in all outcome measures, 0·50 to <0·80 moderate and ≥0·80 large( Reference Cohen 49 ). Values are presented as means and standard deviations unless stated otherwise.
Justification of sample size
The calculated sample size was based on total daily EI (the primary outcome variable) and LPA (% wear time), as this PA intensity has been shown to be sensitive to breakfast manipulation in adults( Reference Betts, Richardson and Chowdhury 14 ). A worthwhile difference in EI or energy expenditure between the two conditions was defined as 628 kJ/d (150 kcal/d)( Reference Wang, Gortmaker and Sobol 46 ). Our variability study showed that the sd of the EI difference between two, 3-d FD conditions was 1147 kJ/d (274 kcal/d). A 628 kJ/d increase in energy expenditure requires approximately 45 min of LPA at 14·0 kJ/min in adolescent girls( Reference Phillips, Parfitt and Rowlands 47 , Reference Schmitz, Treuth and McMurray 50 ). This would equate to 5 % of weekday waking hours and an sd of 6 %( Reference Rowlands, Rennie and Kozarski 48 , Reference Treuth, Catellier and Schmitz 51 ). Using these figures, the number of participants estimated to detect a significant change at 90 % power with a two-sided significance level of 0·05 was 35 for daily EI and 30 for LPA. To be included in the final sample, participants had to meet the following criteria: (1) attended the breakfast intervention club on all days; (2) abstain from all foods and beverages until 10.30 hours for NB; (3) consume at least 20 % of recommended daily EI if they did not consume the SB completely( 38 ); (4) record their diet and wear the accelerometer as specified. Thus, forty-nine participants were recruited to allow for a dropout of 10–30 %.
Results
Participant characteristics
The final sample for dietary analysis included forty participants (nine were excluded: three broke the fast before 10.30 hours during NB, one did not consume an adequate amount of the SB and five did not record their dietary intakes as specified). Three participants that were included in the final sample did not eat all of the SB, but consumed enough so that SB EI was at least 20 % of recommended daily EI( 38 ). Table 1 shows the anthropometric characteristics and habitual breakfast frequencies of the final sample. The nine girls who were excluded from the final analyses did not have significantly different physical characteristics or breakfast frequencies compared with the 40 who were included (P≥0·10).
Table 1 Participant characteristics
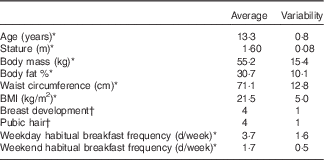
* Means and standard deviations.
† Medians and interquartile ranges.
Variability of daily energy intake
At the group level (n 10), EI was similar between FD trial 1 and FD trial 2 (5063 (sd 1332) v. 5244 (sd 1293) kJ/d (1211 (sd 319) v. 1255 (sd 309) kcal/d); t=−0·500; P=0·629). The systematic bias was 181 (random error 1147) kJ/d (43 (random error 274) kcal/d). This resulted in 95 % LoA of −2067 to 2428 kJ/d, (−494 to 580 kcal/d) (see online Supplementary Document S1). Significant proportional bias was not evident (r −0·038; P=0·917) and random errors were homoscedastic (r −0·040; P=0·912). The LoA based on all ten girls exceeded our a priori acceptable test–retest variability of ±628 kJ/d (150 kcal/d). However, seven of the ten participants had paired EI values across the repeat measurements that were within ±628 kJ/d (150 kcal/d), suggesting the natural variation in FD may be small enough to detect subtle changes in EI that could prevent excessive weight gain( Reference Wang, Gortmaker and Sobol 46 ). In the remaining three girls, one had a particularly large difference of 3141 kJ/d between the repeat measurements. When excluding this participant (n 9), the systematic error was reduced by −148 (random error 512) kJ/d, and the 95 % LoA were tightened to −1151 to 855 kJ/d, but still exceed the ±628 kJ/d cut-off.
Breakfast energy and macronutrient intake
Accounting for leftovers, breakfast energy and macronutrient intakes for SB were: EI 1962 (sd 121) kJ (469 (sd 29) kcal), 88·3 (sd 6·0) g carbohydrate (CHO), 16·4 (sd 1·3) g protein, 5·7 (sd 0·7) g fat and 5·8 (sd 0·6) g fibre. For comparison, the girls consumed 766 (sd 439) kJ (183 (sd 105) kcal), 29·4 (sd 16·1) g CHO, 5·4 (sd 3·7) g protein, 5·4 (sd 4·5) g fat and 1·2 (sd 1·0) g fibre for breakfast habitually. The energy, CHO, protein and fibre intake of the SB were higher than the girls habitual breakfasts (P<0·005; d=3·69–5·32), whereas fat intakes were similar (P=0·672; d=0·09).
Daily and post-breakfast energy intake
Fig. 1 shows daily and time-specific EI for each breakfast condition. Daily EI was higher in SB than NB (P<0·0005). For daily EI, we quantified the true interindividual differences in the intervention responses using the control sd from the variability data described above and the SD of the residuals from the breakfast conditions( Reference Atkinson and Batterham 23 ). The sd of the true individual response was 636 (95 % CI 229, 1042) kJ/d (152 (55, 249) kcal/d) for SB v. NB. Using our cut-off of ≥628 kJ/d (150 kcal/d), the large differences in the control and intervention sd may be clinically important.

Fig. 1 Energy intake during different times of the day for the no breakfast (NB, ![]() ) and the standardised breakfast (SB,
) and the standardised breakfast (SB, ![]() ) conditions (n 40). Values are means, with standard deviations represented by vertical bars. * Significant main effect of condition for total daily energy intake using paired t tests and for total energy intake between 10.30 and 21.00 hours using a condition × time of day ANOVA (P≤0·025). † Significant main effect of time of day using ANOVA (P=0·003).
) conditions (n 40). Values are means, with standard deviations represented by vertical bars. * Significant main effect of condition for total daily energy intake using paired t tests and for total energy intake between 10.30 and 21.00 hours using a condition × time of day ANOVA (P≤0·025). † Significant main effect of time of day using ANOVA (P=0·003).
Post-breakfast (i.e. 10.30–21.00 hours) EI was 483 (sd 1309) kJ/d higher in NB compared with SB (P=0·025; d=0·37), independent of the time of day (P=0·993) (Fig. 1). The higher post-breakfast EI in NB accounted for 24 (sd 66) % of the SB EI.
Daily and post-breakfast macronutrient intakes
Table 2 shows daily macronutrient intakes for each breakfast condition. Daily CHO, fibre and protein intakes were higher in SB compared with NB (d≥0·81 for all comparisons), whereas daily fat intake was not. The effect of condition was NS for CHO, fat, protein and fibre intakes for the post-breakfast period (P≥0·451; d≤0·14 for all comparisons) and there was no interaction with time of day (P≥0·329). The time of day main effect showed that protein and fibre intakes were higher in the 14.00–21.00 hours period than the 10.30–14.00 hours period (P≤0·026; d≥0·50), but this difference only approached significance for CHO with a small effect (P=0·054; d=0·40).
Table 2 Daily energy and macronutrient intakes during 3 d of no breakfast (NB) or standardised breakfast consumption (SB) using a randomised cross-over design (n 40)* (Mean values and standard deviations)
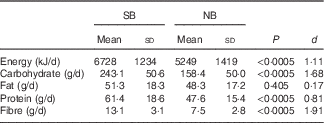
d, Cohen’s d effect size.
* Paired t tests and Cohen’s d effect sizes were used to compare the SB and NB conditions.
Daily fruit and vegetable and high-fat and sugary snack consumption
The breakfast condition main effect for daily portions of fruit and vegetables consumed was not significant (1·1 (sd 1·1) for NB v. 1·1 (sd 0·8) for SB; P=0·801). Although the mean number of high-fat and sugary snacks consumed per day tended to be higher for NB (3·0 (sd 1·5)) compared with SB (2·6 (sd 1·3)) (P=0·097), the effect was only small (d=0·26).
Daily physical activity
A total of thirty-five girls had valid accelerometer data and were included in PA analyses. Wear time was 14·2 (sd 1·2) h/d for SB and 14·1 (sd 1·3) h/d for NB (P=0·488). Daily time spent sedentary or in LPA or MVPA (% wear time) was not different between conditions (Table 3).
Table 3 Daily time spent sedentary and in physical activity during 3 d of no breakfast (NB) or standardised breakfast consumption (SB) using a randomised cross-over design (n 35)* (Mean values and standard deviations)
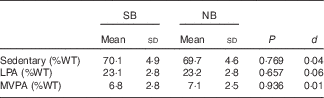
d, Cohen’s d effect size; %WT, percentage of total wear time; LPA, light physical activity; MVPA, moderate to vigorous physical activity.
* Paired t tests and Cohen’s d effect sizes were used to compare the SB and NB conditions.
Discussion
Using an experimental cross-over design, this study showed that total daily EI was higher when adolescent girls consumed an approximately 1962 kJ SB when compared with NB over 3 consecutive weekdays. Although NB increased post-breakfast EI, the degree of EI compensation was small and only accounted for approximately 24 % of the SB. In addition, breakfast manipulation did not affect time spent sedentary or in PA.
Our study supports previous research showing that breakfast consumption results in higher daily EI in young people( Reference Kral, Whiteford and Heo 10 , Reference Leidy, Ortinau and Douglas 17 ) and adults( Reference Clayton, Barutcu and Machin 12 , Reference Reeves, Huber and Halsey 13 , Reference Betts, Richardson and Chowdhury 14 , Reference Yoshimura, Hatamoto and Yonekura 15 , Reference Chowdhury, Richardson and Tsintzas 52 ) when compared with breakfast omission. In addition to being statistically significant, random within-subject variation and measurement error did not explain the higher daily EI with breakfast consumption, which exceeded the natural variability in EI by more than 628 kJ/d (150 kcal/d) and may thus have clinical importance for weight gain( Reference Atkinson and Batterham 23 , Reference Wang, Gortmaker and Sobol 46 ). The 483 kJ/d (115 kcal/d) increase in post-breakfast EI (i.e. between 10.30 and 21.00 hours) when the girls omitted breakfast amounted to only a quarter of the SB. This incomplete EI compensation may be due to the large size of the SB, which contained 2·6 times more energy than the participants’ habitual breakfasts. As CHO-based breakfasts containing approximately 1·3 times less energy than our SB also did not result in EI compensation in young people( Reference Kral, Whiteford and Heo 10 , Reference Leidy, Ortinau and Douglas 17 ), examining the effects of smaller breakfasts similar in energy content to the habitual breakfasts of adolescent girls (approximately 766 kJ in our sample) may enhance the ecological validity of the findings and likelihood EI compensation being complete. Although the increased EI with breakfast omission was distributed evenly across the day in our study, reports in adults indicate that these effects are specific to certain time periods( Reference Clayton, Barutcu and Machin 12 , Reference Reeves, Huber and Halsey 13 , Reference Yoshimura, Hatamoto and Yonekura 15 ). It has also been shown that such effects may depend on the sex and breakfast habits of the sample( Reference Halsey, Huber and Low 28 ), whereas habitual breakfast frequency was not related to the outcome variables in our sample of adolescent girls. Nevertheless, the 95 % CI for the sd of the individual response (229–1042 kJ/d) indicates large interindividual variability in compensatory EI responses to breakfast omission. Thus, individual characteristics that may explain this variability, such as eating and PA habits, body composition, age and socioeconomic status warrant clarification.
Unlike most previous experimental studies in adults that involved unstandardised breakfast manipulation( Reference Reeves, Huber and Halsey 13 , Reference Betts, Richardson and Chowdhury 14 , Reference Chowdhury, Richardson and Holman 16 , Reference Halsey, Huber and Low 28 ), we provided a standardised, wholegrain ready-to-eat cereal-based breakfast. This type of breakfast was chosen because it has strong association with lowered obesity risk in adolescents( Reference Deshmukh-Taskar, Nicklas and O’Neil 7 ) and it is a convenient breakfast choice that requires minimal preparation time, which could be appealing for adolescents who skip breakfast due to a ‘lack of time’( Reference Shaw 53 ). The small, but statistically significant increase in post-breakfast EI (i.e. between 10.30 and 21.00 hours) with breakfast omission reported here is in contrast with research in ‘breakfast-skipping’ adolescents showing that normal-protein breakfasts do not reduce subsequent EI( Reference Leidy and Racki 11 , Reference Leidy, Ortinau and Douglas 17 , Reference Leidy, Hoertel and Douglas 18 ). Although breakfast GI was not reported in these studies( Reference Leidy and Racki 11 , Reference Leidy, Ortinau and Douglas 17 , Reference Leidy, Hoertel and Douglas 18 ), it is possible that the low GI breakfast in our study promoted a slower release of glucose into the blood, which can reduce hunger and lunchtime EI( Reference Warren, Henry and Simonite 54 ) and prolong satiety( Reference Ball, Keller and Moyer-Mileur 55 ) in young people and may explain our discrepant findings( Reference Leidy and Racki 11 , Reference Leidy, Ortinau and Douglas 17 , Reference Leidy, Hoertel and Douglas 18 ). However, the link between GI and EI is controversial( Reference Bornet, Jardy-Gennetier and Jacquet 56 , Reference Sun, Li and Zhang 57 ), with the satiating effect of low GI foods possibly being due to their higher fibre content( Reference Bornet, Jardy-Gennetier and Jacquet 56 ). Nevertheless, the 5·8 g of fibre in our SB was within the range of the breakfasts in previous studies (2·0–6·1 g)( Reference Leidy and Racki 11 , Reference Leidy, Ortinau and Douglas 17 ). Thus, differences in fibre content of the CHO-based breakfasts may not explain discrepancies between our results and previous work. Increased EI in response to breakfast omission may be due to a host of metabolic and behavioural responses induced by the appetite regulatory system, including increased pre-dinnertime neural activation in brain regions controlling food motivation/reward in late adolescent girls( Reference Leidy, Ortinau and Douglas 17 ). Such mechanisms require further research in young people.
Although weighed food records are often considered the criterion reference measure of free-living EI in adults, self-reported EI can be underestimated through poor compliance, participant selection bias, recording bias and changes to diet to facilitate recording( Reference Macdiarmid and Blundell 58 ). In adolescents, the reliability and validity of weighed food diaries is less certain and the participant burden is particularly high( Reference Burrows, Martin and Collins 59 , Reference Livingstone, Robson and Wallace 60 ). In an attempt to increase compliance to recording dietary intakes in our study, we used a food diary accompanied by photographic evidence rather than a weighed food diary( Reference Boushey, Kerr and Wright 19 ). Although previous research has indicated that the addition of photographs to a traditional diet diary can enhance the validity and reliability of dietary recording( Reference Small, Sidora-Arcoleo and Vaughan 61 ), our comparison of two 3-d records showed 95 % LoA for EI of −2067 to +2428 kJ/d (−494 to +580 kcal/d). This high variability of free-living EI, potentially resulting from environmental, biological and methodological factors( Reference Tarasuk and Beaton 62 ), may limit the potential to detect clinically meaningful differences of 628 kJ/d (150 kcal/d)( Reference Wang, Gortmaker and Sobol 46 ). Previous literature on free-living EI variability using 3 d diet records has used varied statistical approaches and produced mixed findings( Reference Carlsohn, Fusch and Scharhag-Rosenberger 63 , Reference Tremblay, Sévigny and Leblanc 64 ). Interestingly, our LoA are narrower than studies reporting ‘acceptable’ agreement with a 3-d diet record in adults( Reference Toeller, Buyken and Heitkamp 65 ) and a food menu in free-living young people( Reference Chaput, Jomphe-Tremblay and Lafrenière 66 ). Thus, the use of a clinically relevant anchor may have affected the interpretation of the LoA in these studies.
Consistent with cross-sectional reports( Reference Sjöberg, Hallberg and Höglund 8 , Reference Dubois, Girard and Potvin Kent 9 , Reference Timlin, Pereira and Story 30 ), the higher daily EI with SB consumption was due to higher intakes of CHO, protein and fibre, whereas breakfast did not affect daily fat intakes. These differences in daily macronutrient intakes were a direct effect of the breakfast meal rather than post-breakfast intakes. Nevertheless, it is likely that the tendency for higher high-fat and sugary snack consumption contributed to the increased post-breakfast EI when breakfast was omitted. This finding also suggests that the nature of the cross-sectional association between infrequent breakfast consumption and higher unhealthy snack consumption( Reference Sjöberg, Hallberg and Höglund 8 , Reference Dubois, Girard and Potvin Kent 9 ) may be causal. Overall, the girls consumed about one portion of fruit and vegetables a day, a concerning number considering that a minimum of five portions per day is recommended( 44 ). Although breakfast consumption has been associated with higher fruit and vegetable consumption( Reference Arora, Nazar and Gupta 67 , Reference Utter, Scragg and Mhurchu 68 ), the present study suggests that any such relations are not causal, at least in our sample over a 3-d intervention. As food groups other than fruit and vegetables contribute to micronutrient intakes, whether breakfast manipulation affects micronutrient intakes warrants examination using assessment periods of more than 3 d( Reference Bingham 69 ).
The small post-breakfast EI compensation in the present study suggests that a higher PA energy expenditure may be more important in contributing to the healthy weight status in frequent breakfast consumers( Reference Rampersaud, Pereira and Girard 1 , Reference Vereecken, Dupuy and Rasmussen 3 , Reference Zakrzewski, Gillison and Cumming 4 , Reference Brown, Bohan Brown and Allison 5 , Reference Deshmukh-Taskar, Nicklas and O’Neil 7 ). However, our finding that breakfast did not affect sedentary time or MVPA supports cross-sectional findings in girls aged 9–10 years when using accelerometry to quantify PA on weekdays and weekends( Reference Vissers, Jones and Corder 26 ) and experimental research in adults showing no effect of breakfast manipulation on PA assessed via pedometers and heart rate monitors during a working week( Reference Halsey, Huber and Low 28 ). Although breakfast manipulation did not affect LPA in the girls in the present study, energy expenditure from LPA assessed over 7 d was higher in lean adults who consumed breakfast daily compared with those who omitted breakfast daily( Reference Betts, Richardson and Chowdhury 14 ). In the obese cohort of this 6 weeks intervention, total PA energy expenditure in the morning was higher in the breakfast group compared with the breakfast omission group( Reference Chowdhury, Richardson and Holman 16 ). An acute randomised cross-over trial using accelerometry also showed that consuming breakfast increased PA energy expenditure when compared with breakfast omission in women classified as habitual breakfast eaters( Reference Yoshimura, Hatamoto and Yonekura 15 ). The adolescent girls in our study may have responded differently to the adults in previous studies( Reference Betts, Richardson and Chowdhury 14 , Reference Yoshimura, Hatamoto and Yonekura 15 , Reference Chowdhury, Richardson and Holman 16 ) because the provision of breakfast at school meant that they had limited opportunity to engage in free-living PA directly after consuming breakfast. Thus, providing breakfast at home and including weekend days may increase the scope for detecting effects on PA.
The present study has several limitations. First, breakfast manipulation over 3 weekdays does not allow us to apply the findings to weekends, where diet and PA patterns are different( Reference Corder, van Sluijs and Ridgway 27 , Reference Treuth, Catellier and Schmitz 51 , Reference Hjorth, Damsgaard and Michaelsen 70 ), or to determine the effects of longer intervention periods. Second, similar to previous studies( Reference Leidy, Ortinau and Douglas 17 , Reference Leidy, Hoertel and Douglas 18 ), we provided a fixed absolute breakfast portion. However, providing breakfast relative to daily energy requirements may be recommended to reduce between–participant variability in the response to breakfast manipulation. Similarly, methods that provide less variable measures EI would help support our findings, although this is challenging in free-living conditions( Reference Macdiarmid and Blundell 58 , Reference Burrows, Martin and Collins 59 , Reference Livingstone, Robson and Wallace 60 ). In addition, standardising pre-intervention diet and the duration of the washout period between participants would help to minimise the influence of these factors on the study outcomes. Third, future studies employing more sensitive measures to quantify free-living PA or energy expenditure (e.g. combined heart rate-accelerometry or doubly labelled water) over longer measurement periods (e.g. 7 d) would be valuable in extending the findings reported here. In doing so, the possibility that breakfast consumption may affect PA through an interaction with wake time and sleeping patterns requires consideration. Differences in wake time are unlikely to have confounded the comparison between SB and NB in our study, as the provision of breakfast at school rather than at home meant that the participants were not required to wake up any earlier to consume the SB. Nevertheless, the independent effects of breakfast frequency, timing and composition warrant study. Finally, the generalisability of our findings to adolescent boys and to younger children requires investigation.
In conclusion, adolescent girls showed a small increase in post-breakfast EI of 483 kJ/d (115 kcal/d) that was not sufficient to compensate completely for 3 consecutive weekdays of breakfast omission when compared with SB consumption (approximately 1962 kJ/d). Thus, total daily EI remained greater when a SB was consumed. We also report no evidence of breakfast affecting time spent sedentary or in PA. These findings require examination using extended periods of breakfast manipulation and more sensitive devices to quantify PA energy expenditure in young people.
Acknowledgements
The authors thank Daniella Gibson, Shakyla Horton, Nicola King and Kelly Mason for their assistance with data collection for the study. This study received no external funding.
J. K. Z.-F. and K. T. designed the study (project conception, development of overall research plan, and study oversight). All authors contributed to the data collection (hands-on conduct of the experiments and data collection). J. K. Z.-F., T. P. and K. T. analysed the data and/or performed statistical analyses. J. K. Z.-F. and K. T. wrote the paper. J. K. Z.-F. had primary responsibility for final content. All authors have read and approved the final manuscript.
None of the authors has any conflicts of interest to declare.
Supplementary material
For supplementary material/s referred to in this article, please visit https://doi.org/10.1017/S0007114517002148


